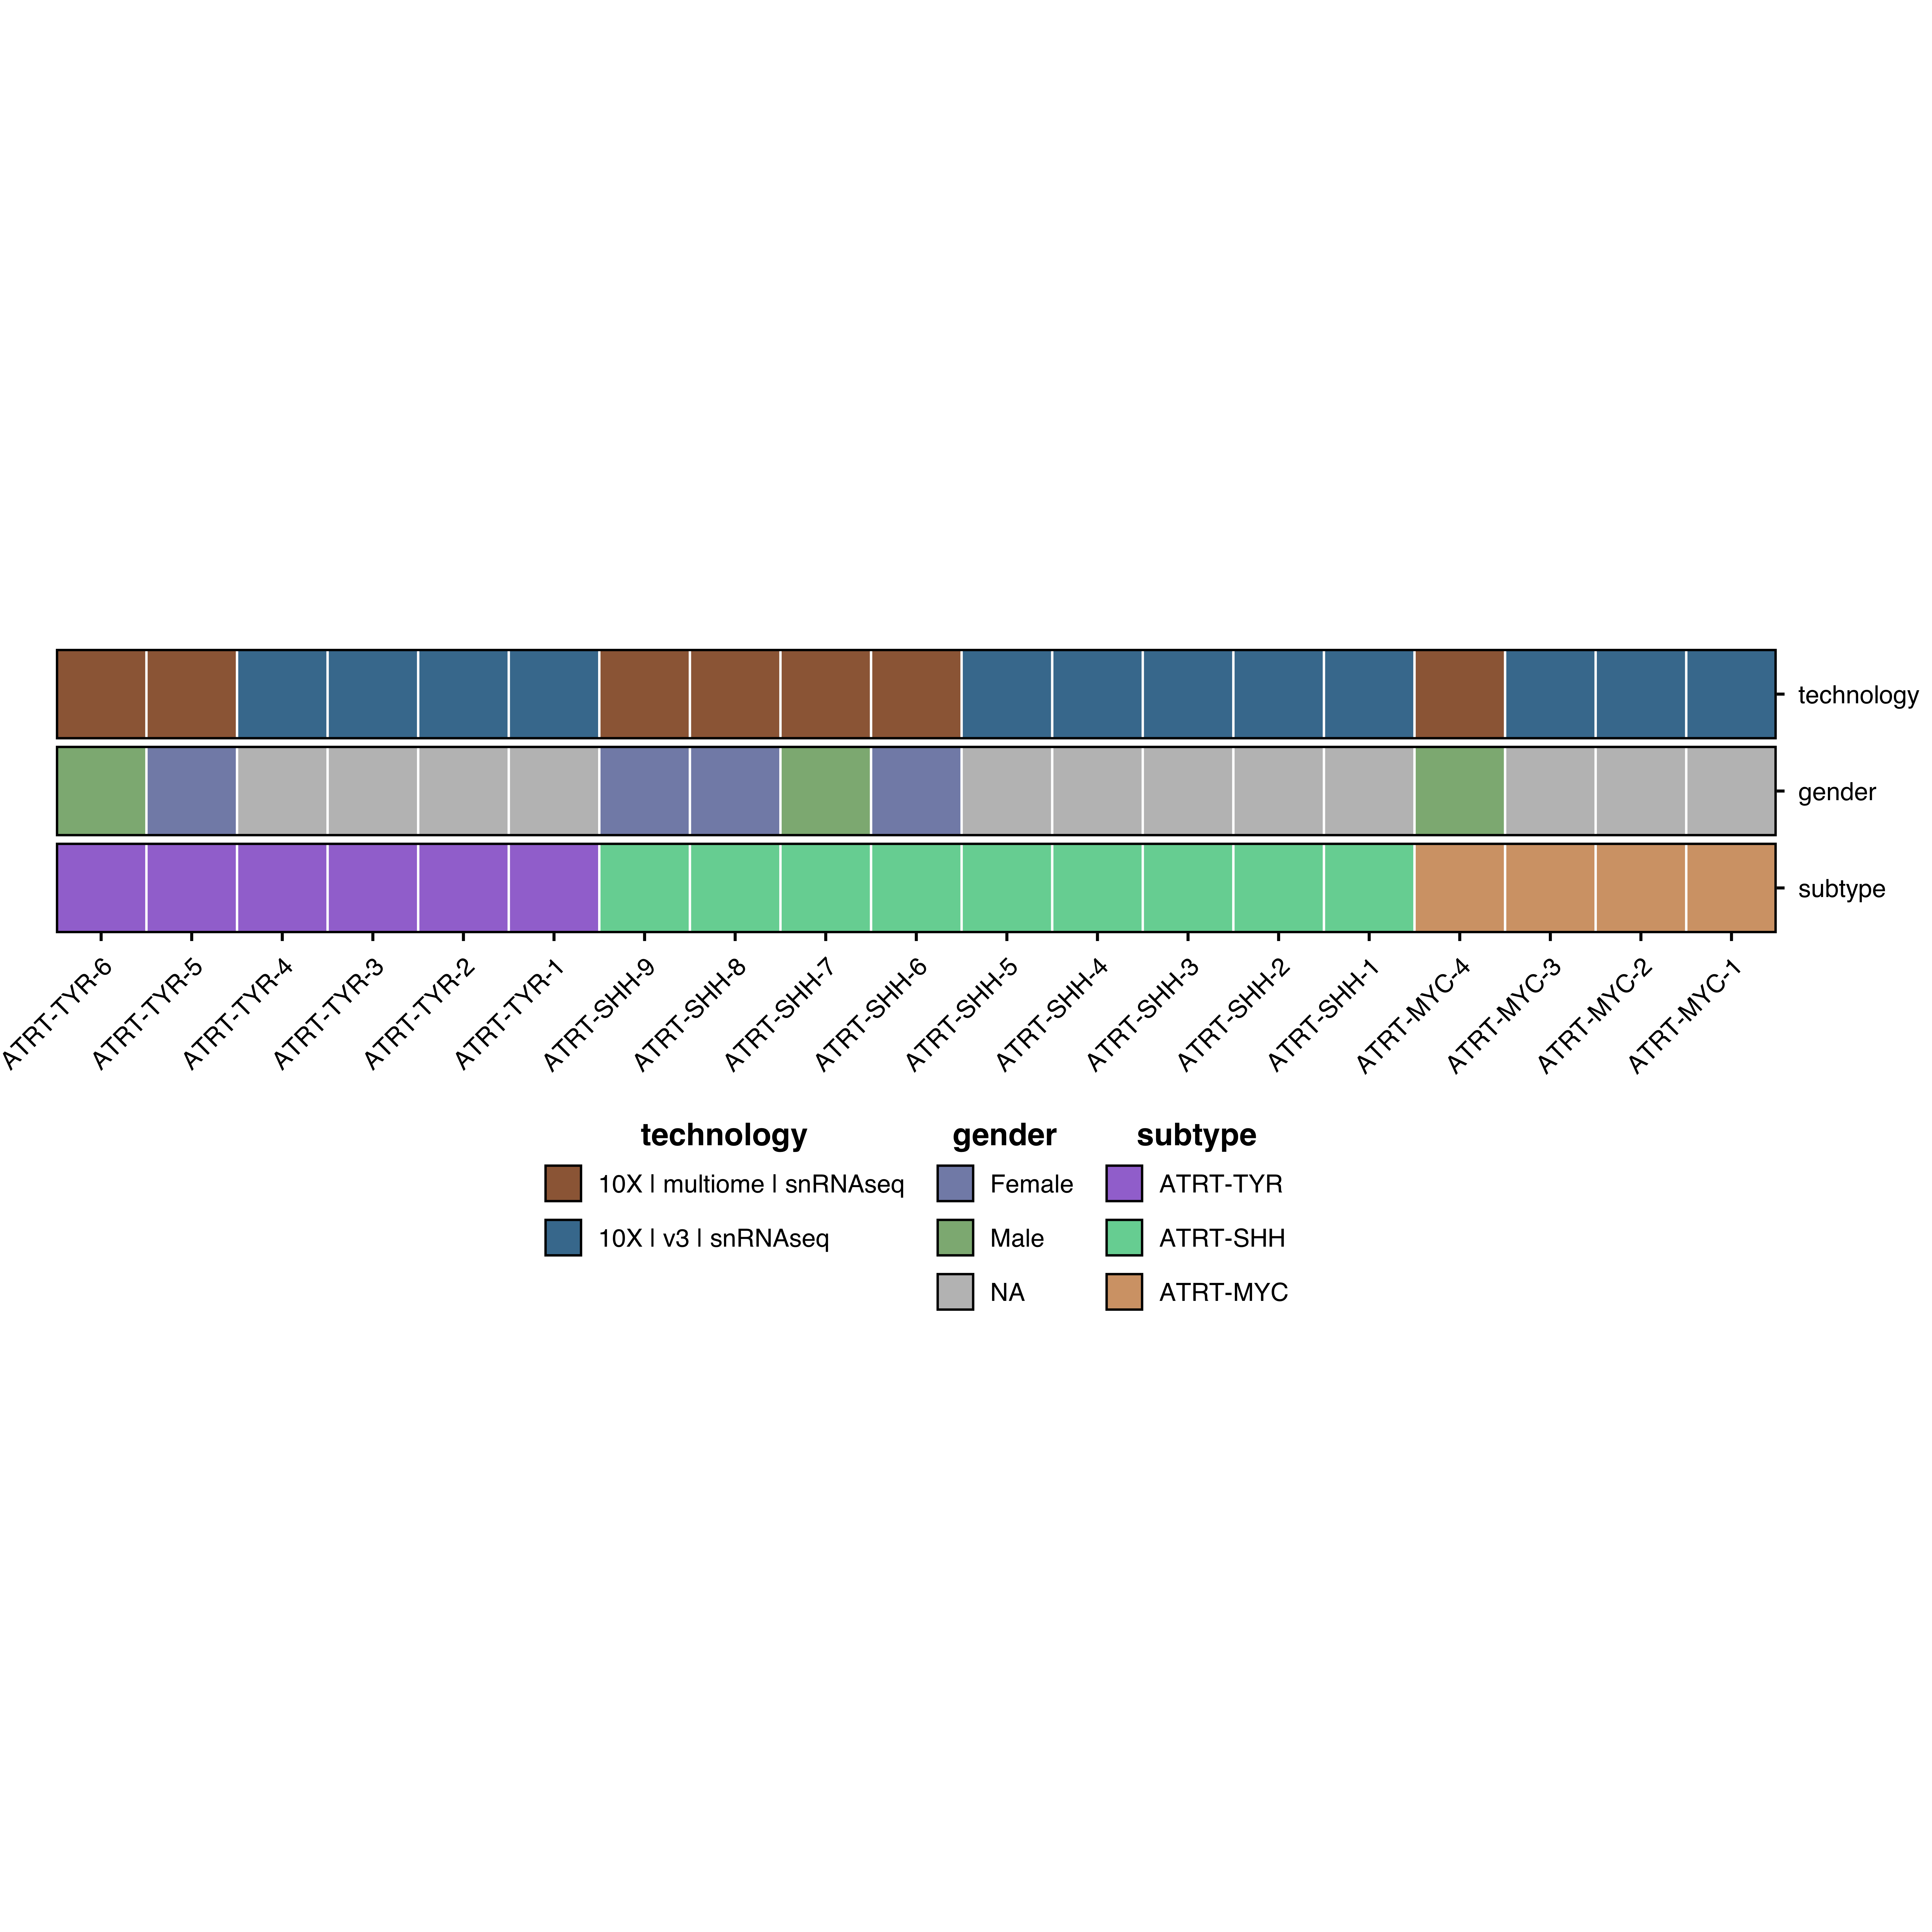
Metadata heatmaps display categorical metadata variables across samples or groups. Ideal for visualizing patient characteristics, experimental conditions, or sample annotations.
Basic usage
p <- SCpubr :: do_MetadataHeatmap ( sample = sample , group.by = "ID" ,
metadata = c ( "technology" , "gender" , "subtype" ) ,
flip = FALSE ,
legend.ncol = 1 )
p
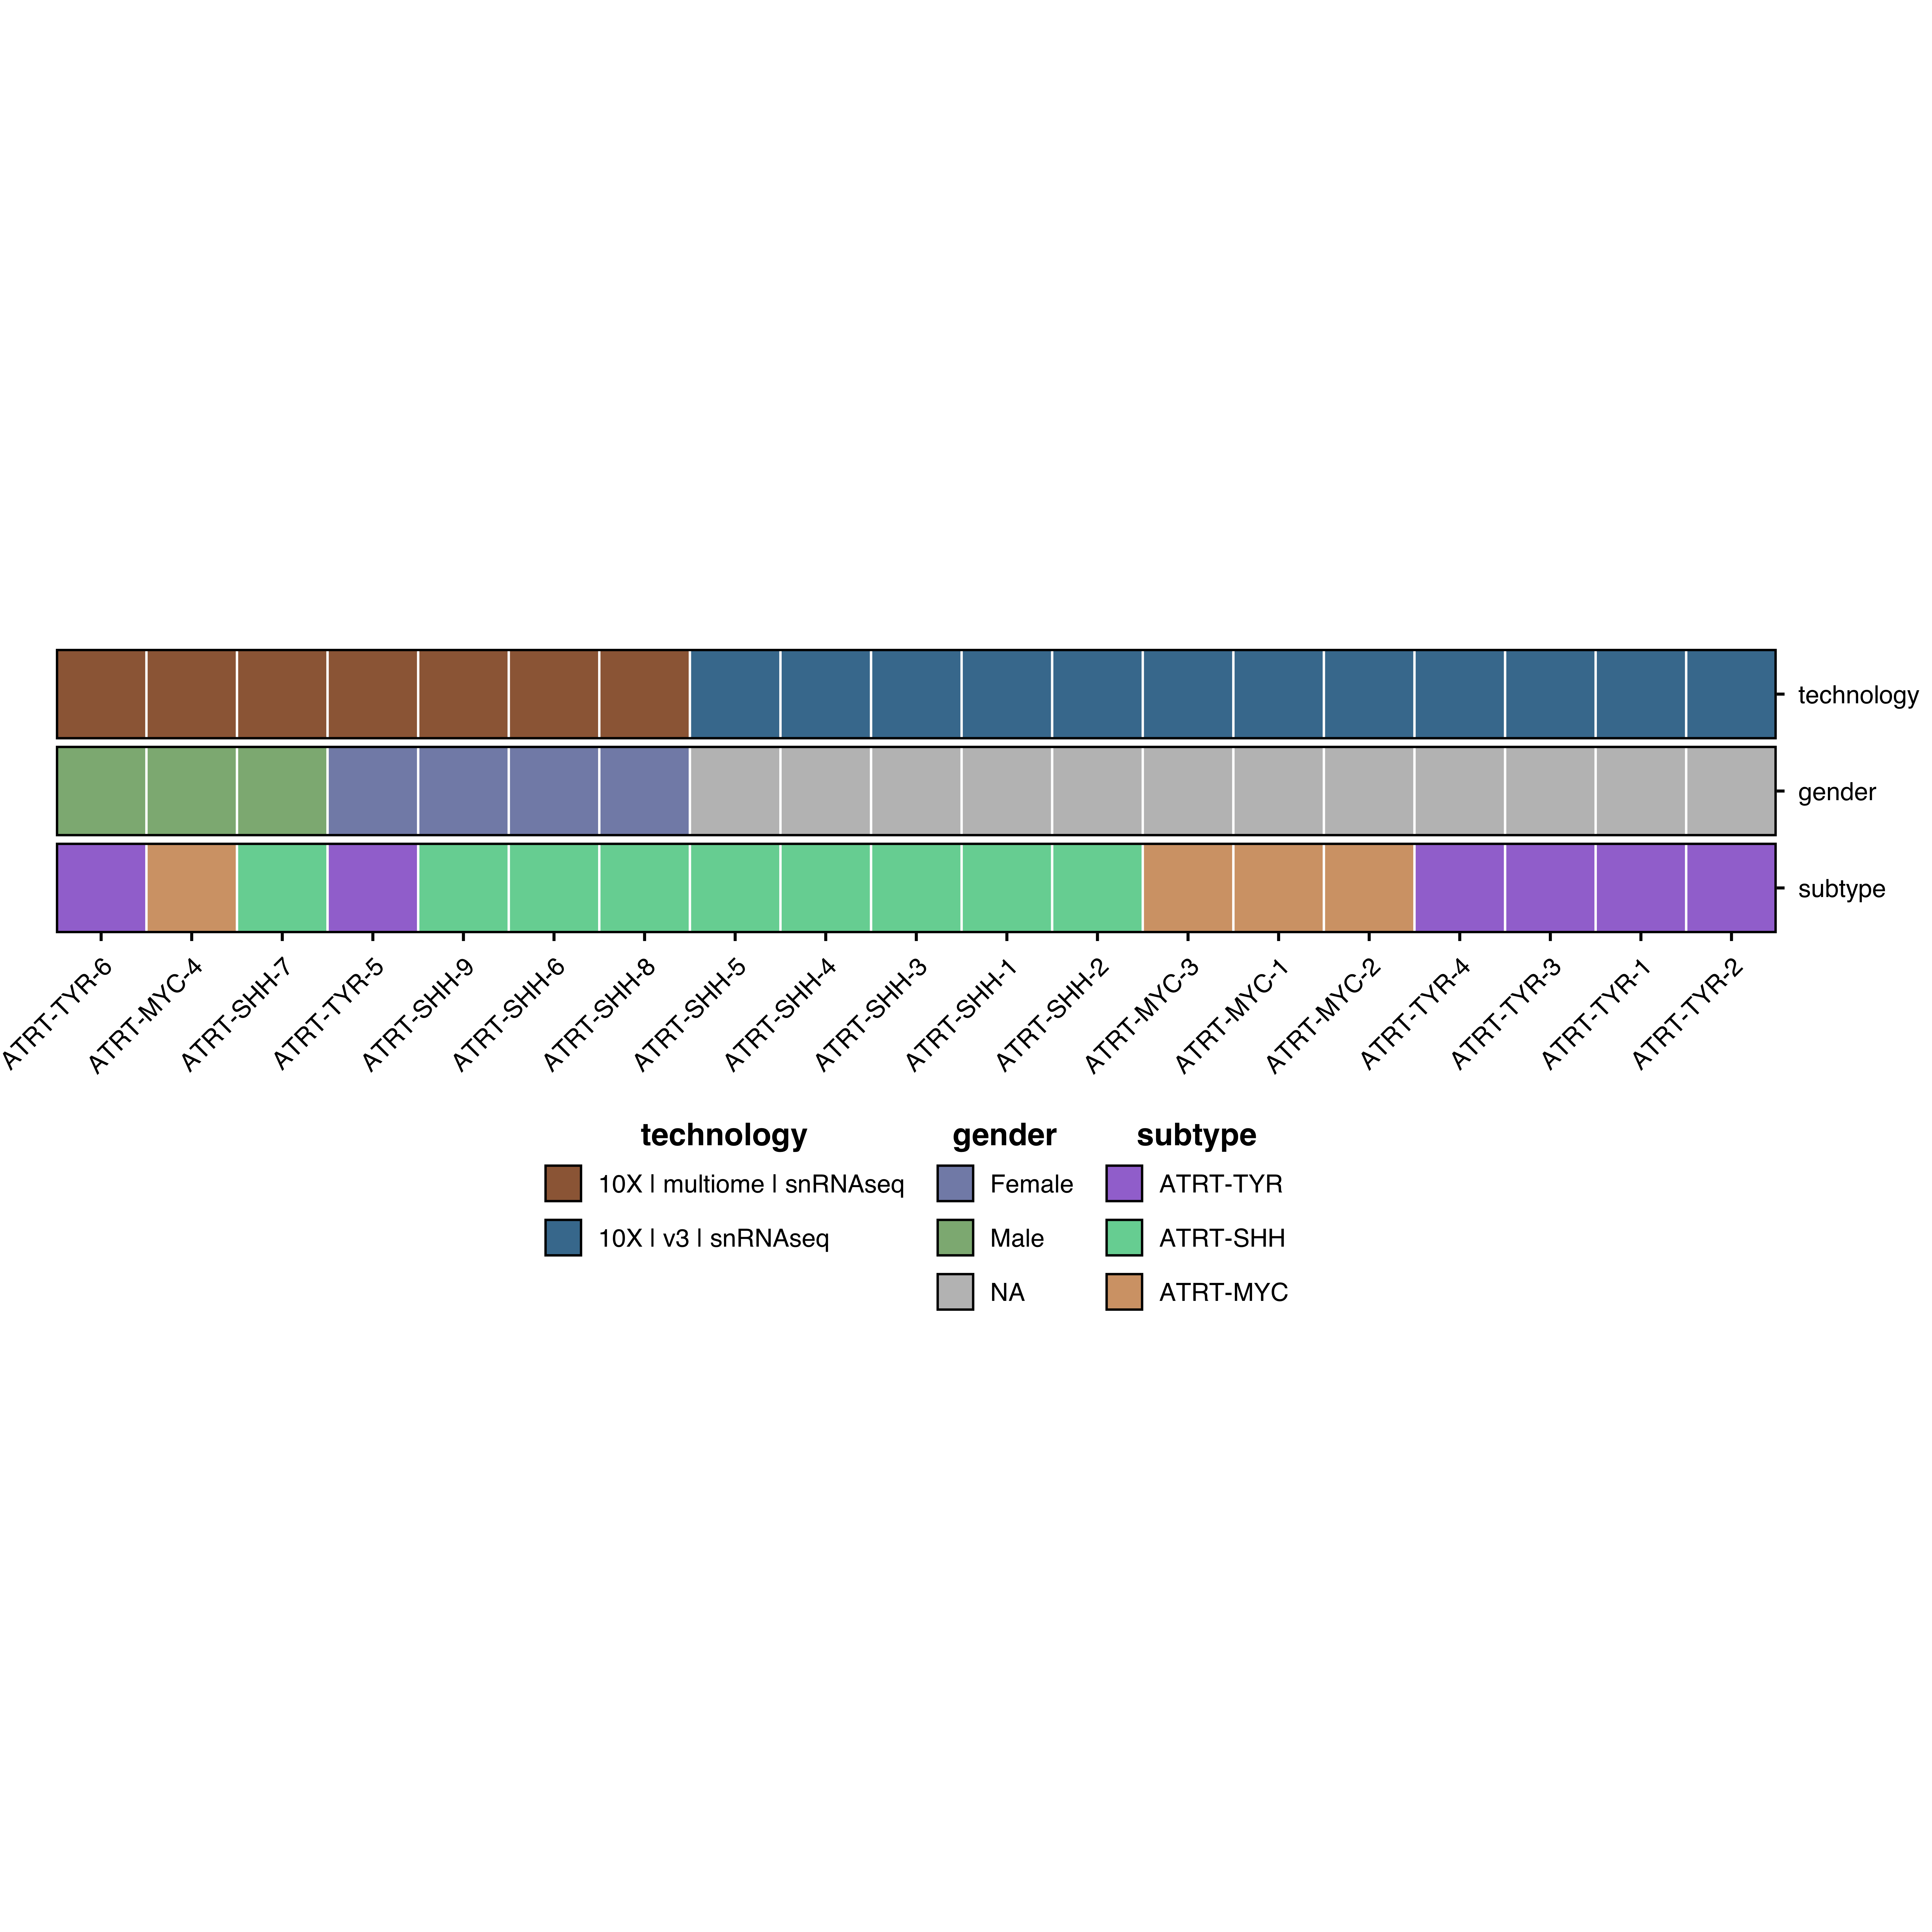
Cluster samples
p <- SCpubr :: do_MetadataHeatmap ( sample = sample , group.by = "ID" ,
metadata = c ( "technology" , "gender" , "subtype" ) ,
legend.ncol = 1 ,
flip = FALSE ,
cluster = TRUE )
p
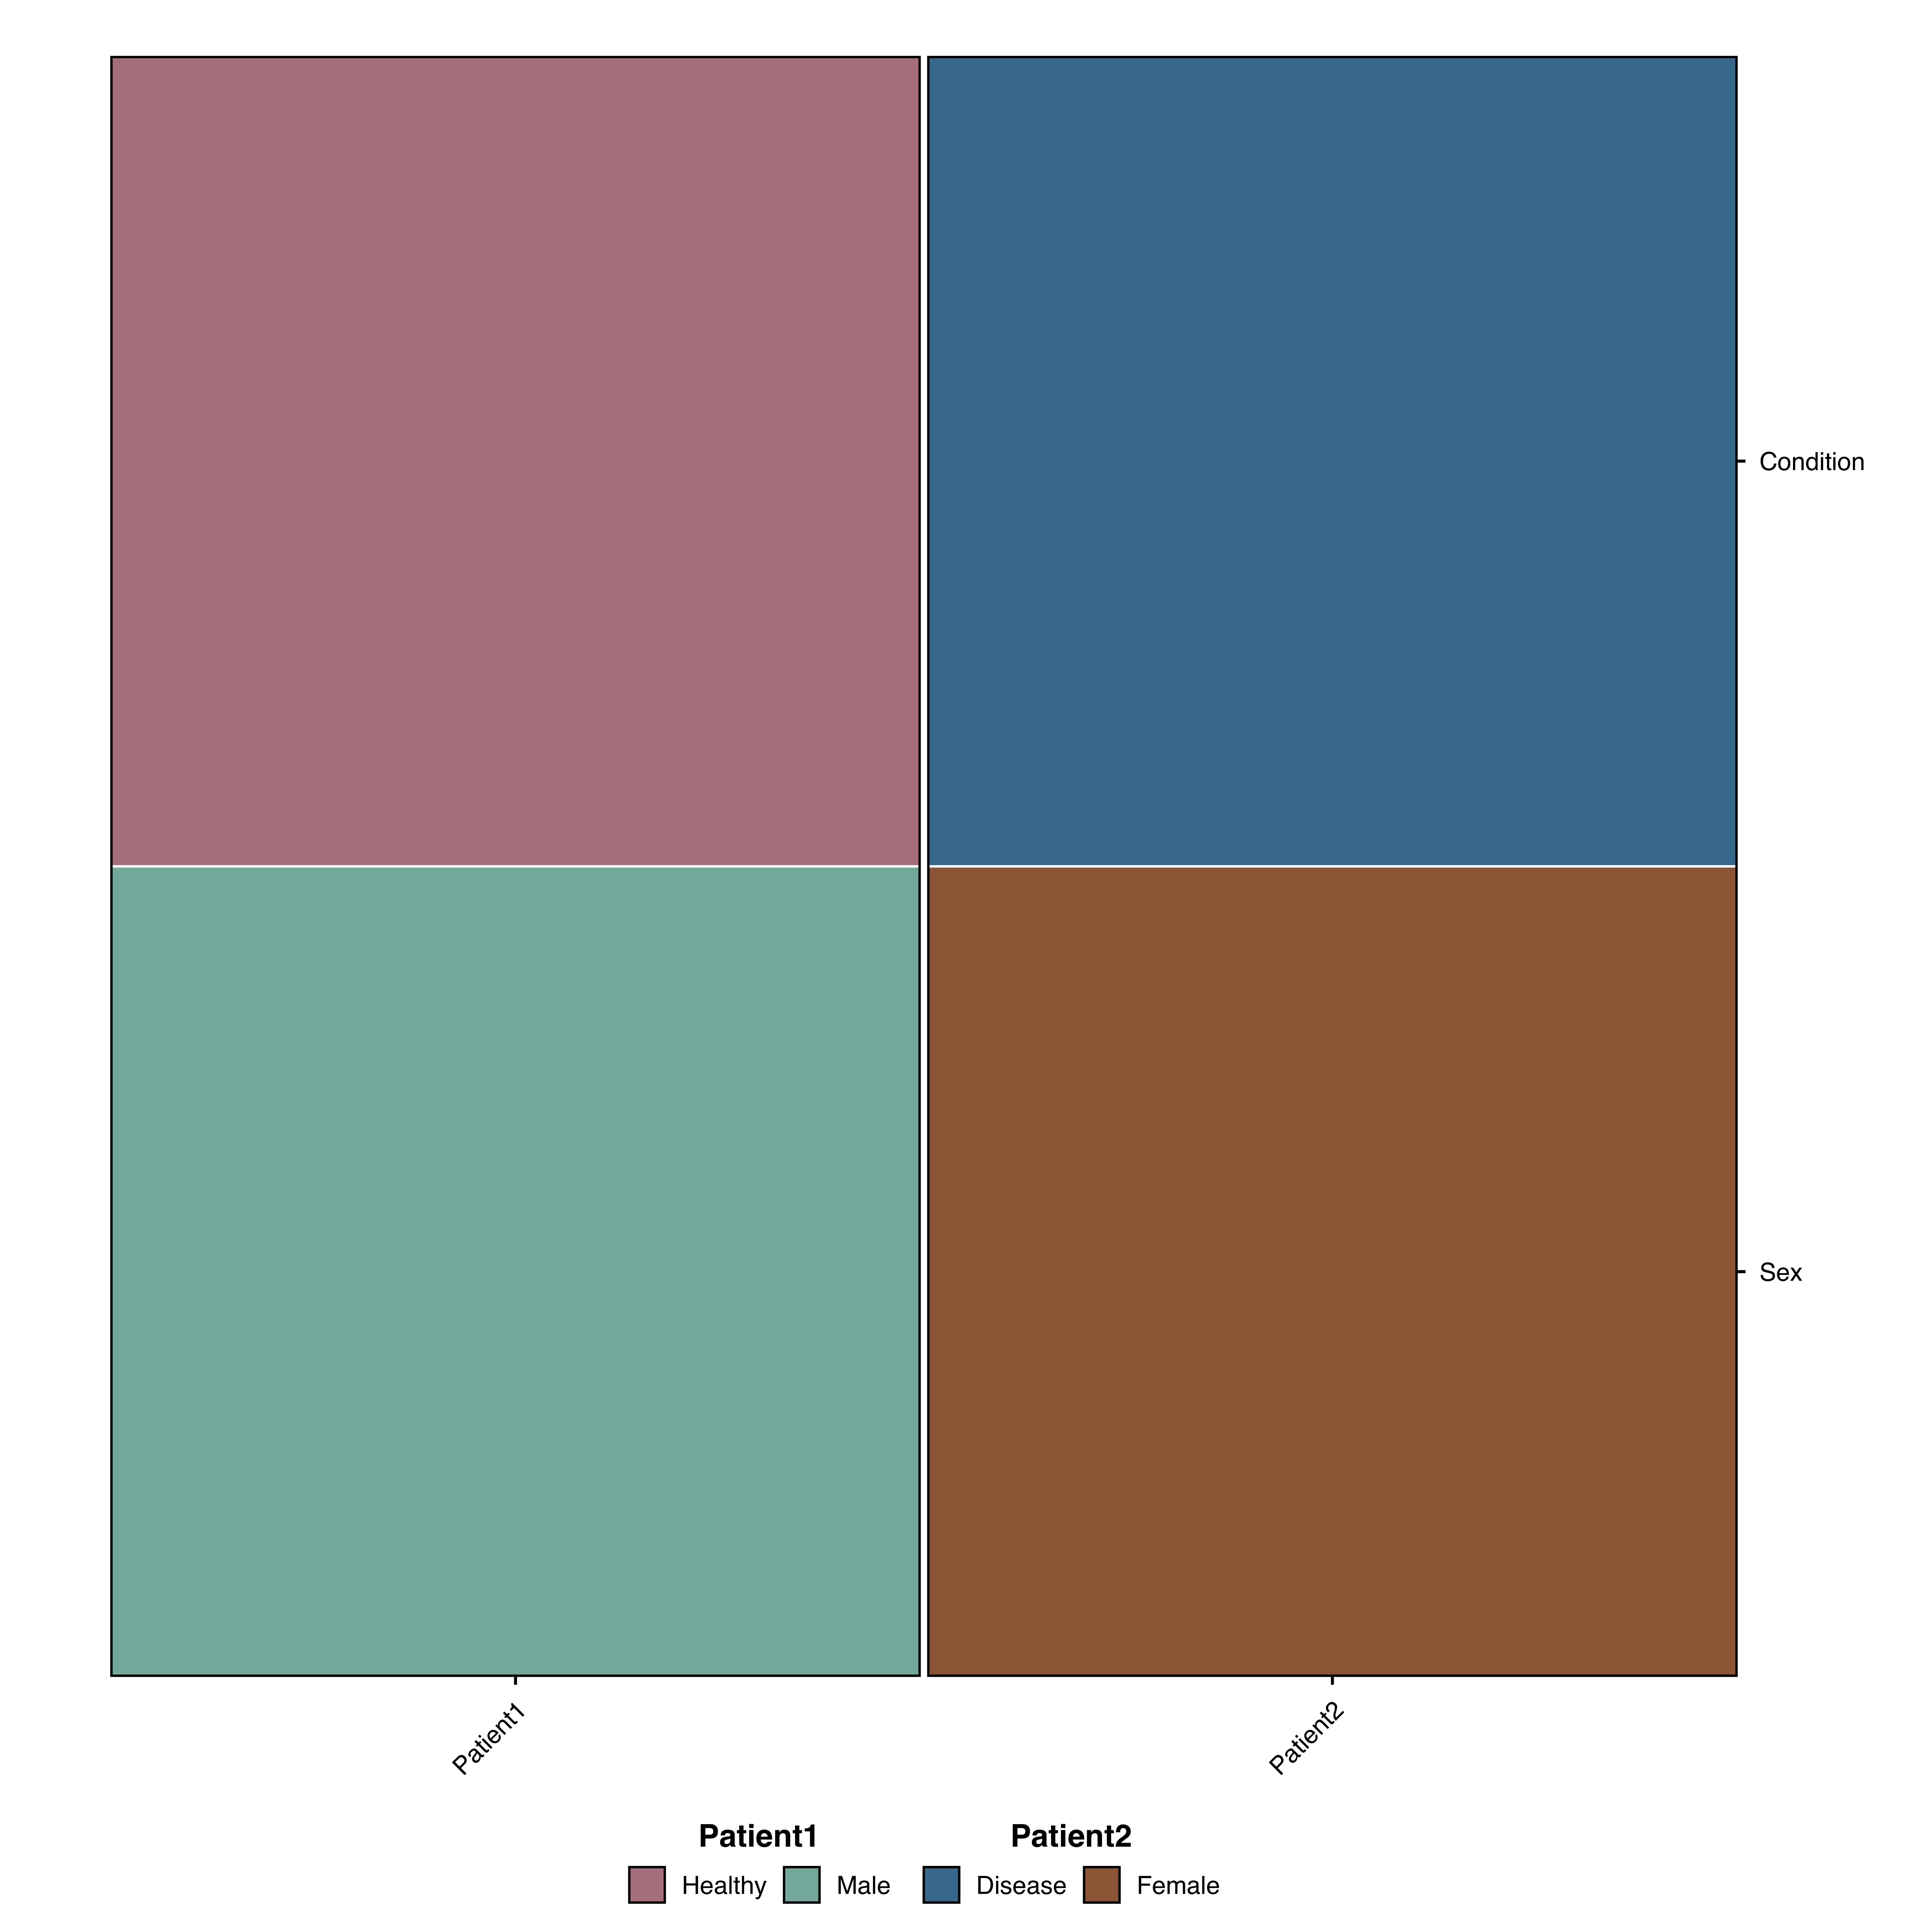
From data frame
df <- data.frame ( Patient1 = c ( "Healthy" , "Male" ) ,
Patient2 = c ( "Disease" , "Female" ) ,
row.names = c ( "Condition" , "Sex" )
) p <- SCpubr :: do_MetadataHeatmap ( from_df = TRUE , df = df )
p
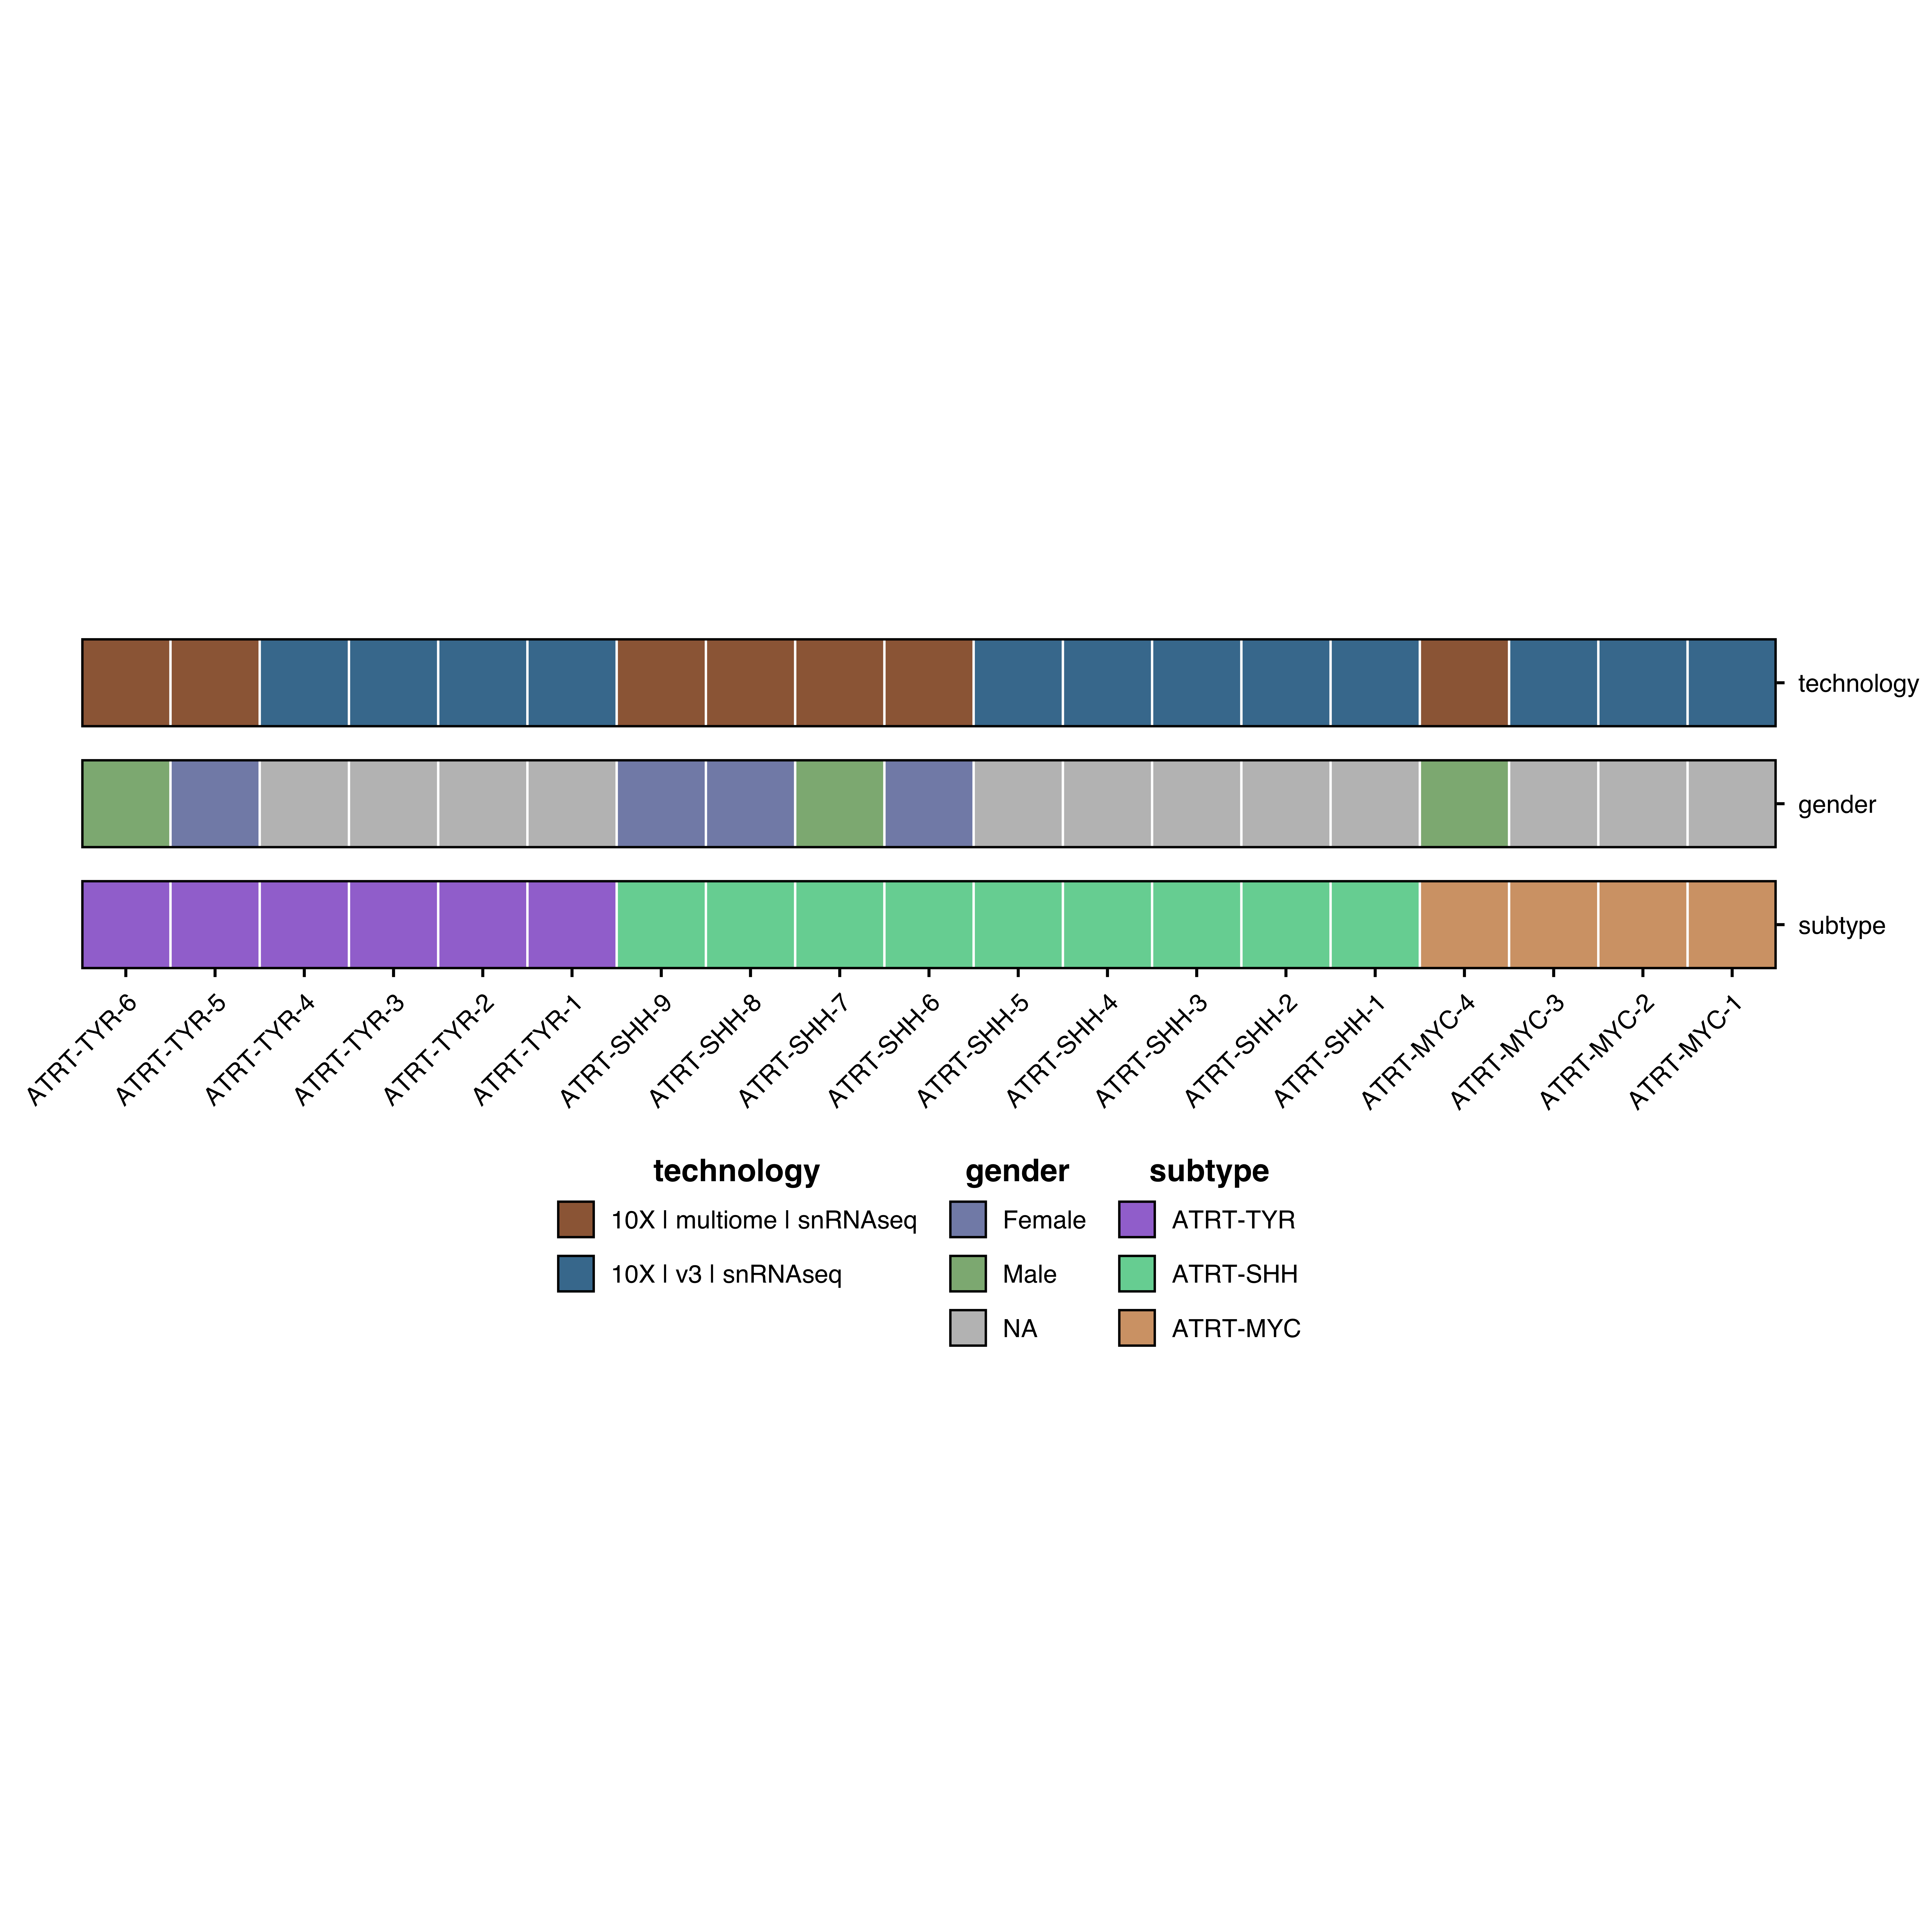
Adjust gap between rows
p <- SCpubr :: do_MetadataHeatmap ( sample = sample , group.by = "ID" ,
metadata = c ( "technology" , "gender" , "subtype" ) ,
flip = FALSE ,
legend.ncol = 1 ,
heatmap.gap = 5 )
p
Parameter reference
For parameters shared across many functions (typography, legend styling, grid), see Shared features .
Core parameters
group.byColumn defining groups
—
metadataMetadata columns to show
—
colors.useNamed list of color mappings
NULL
Layout
clusterHierarchical clustering
FALSE
flipVertical layout
TRUE
heatmap.gapGap between rows (mm)
1
From data frame
from_dfUse data frame input
FALSE
dfData frame with metadata
NULL