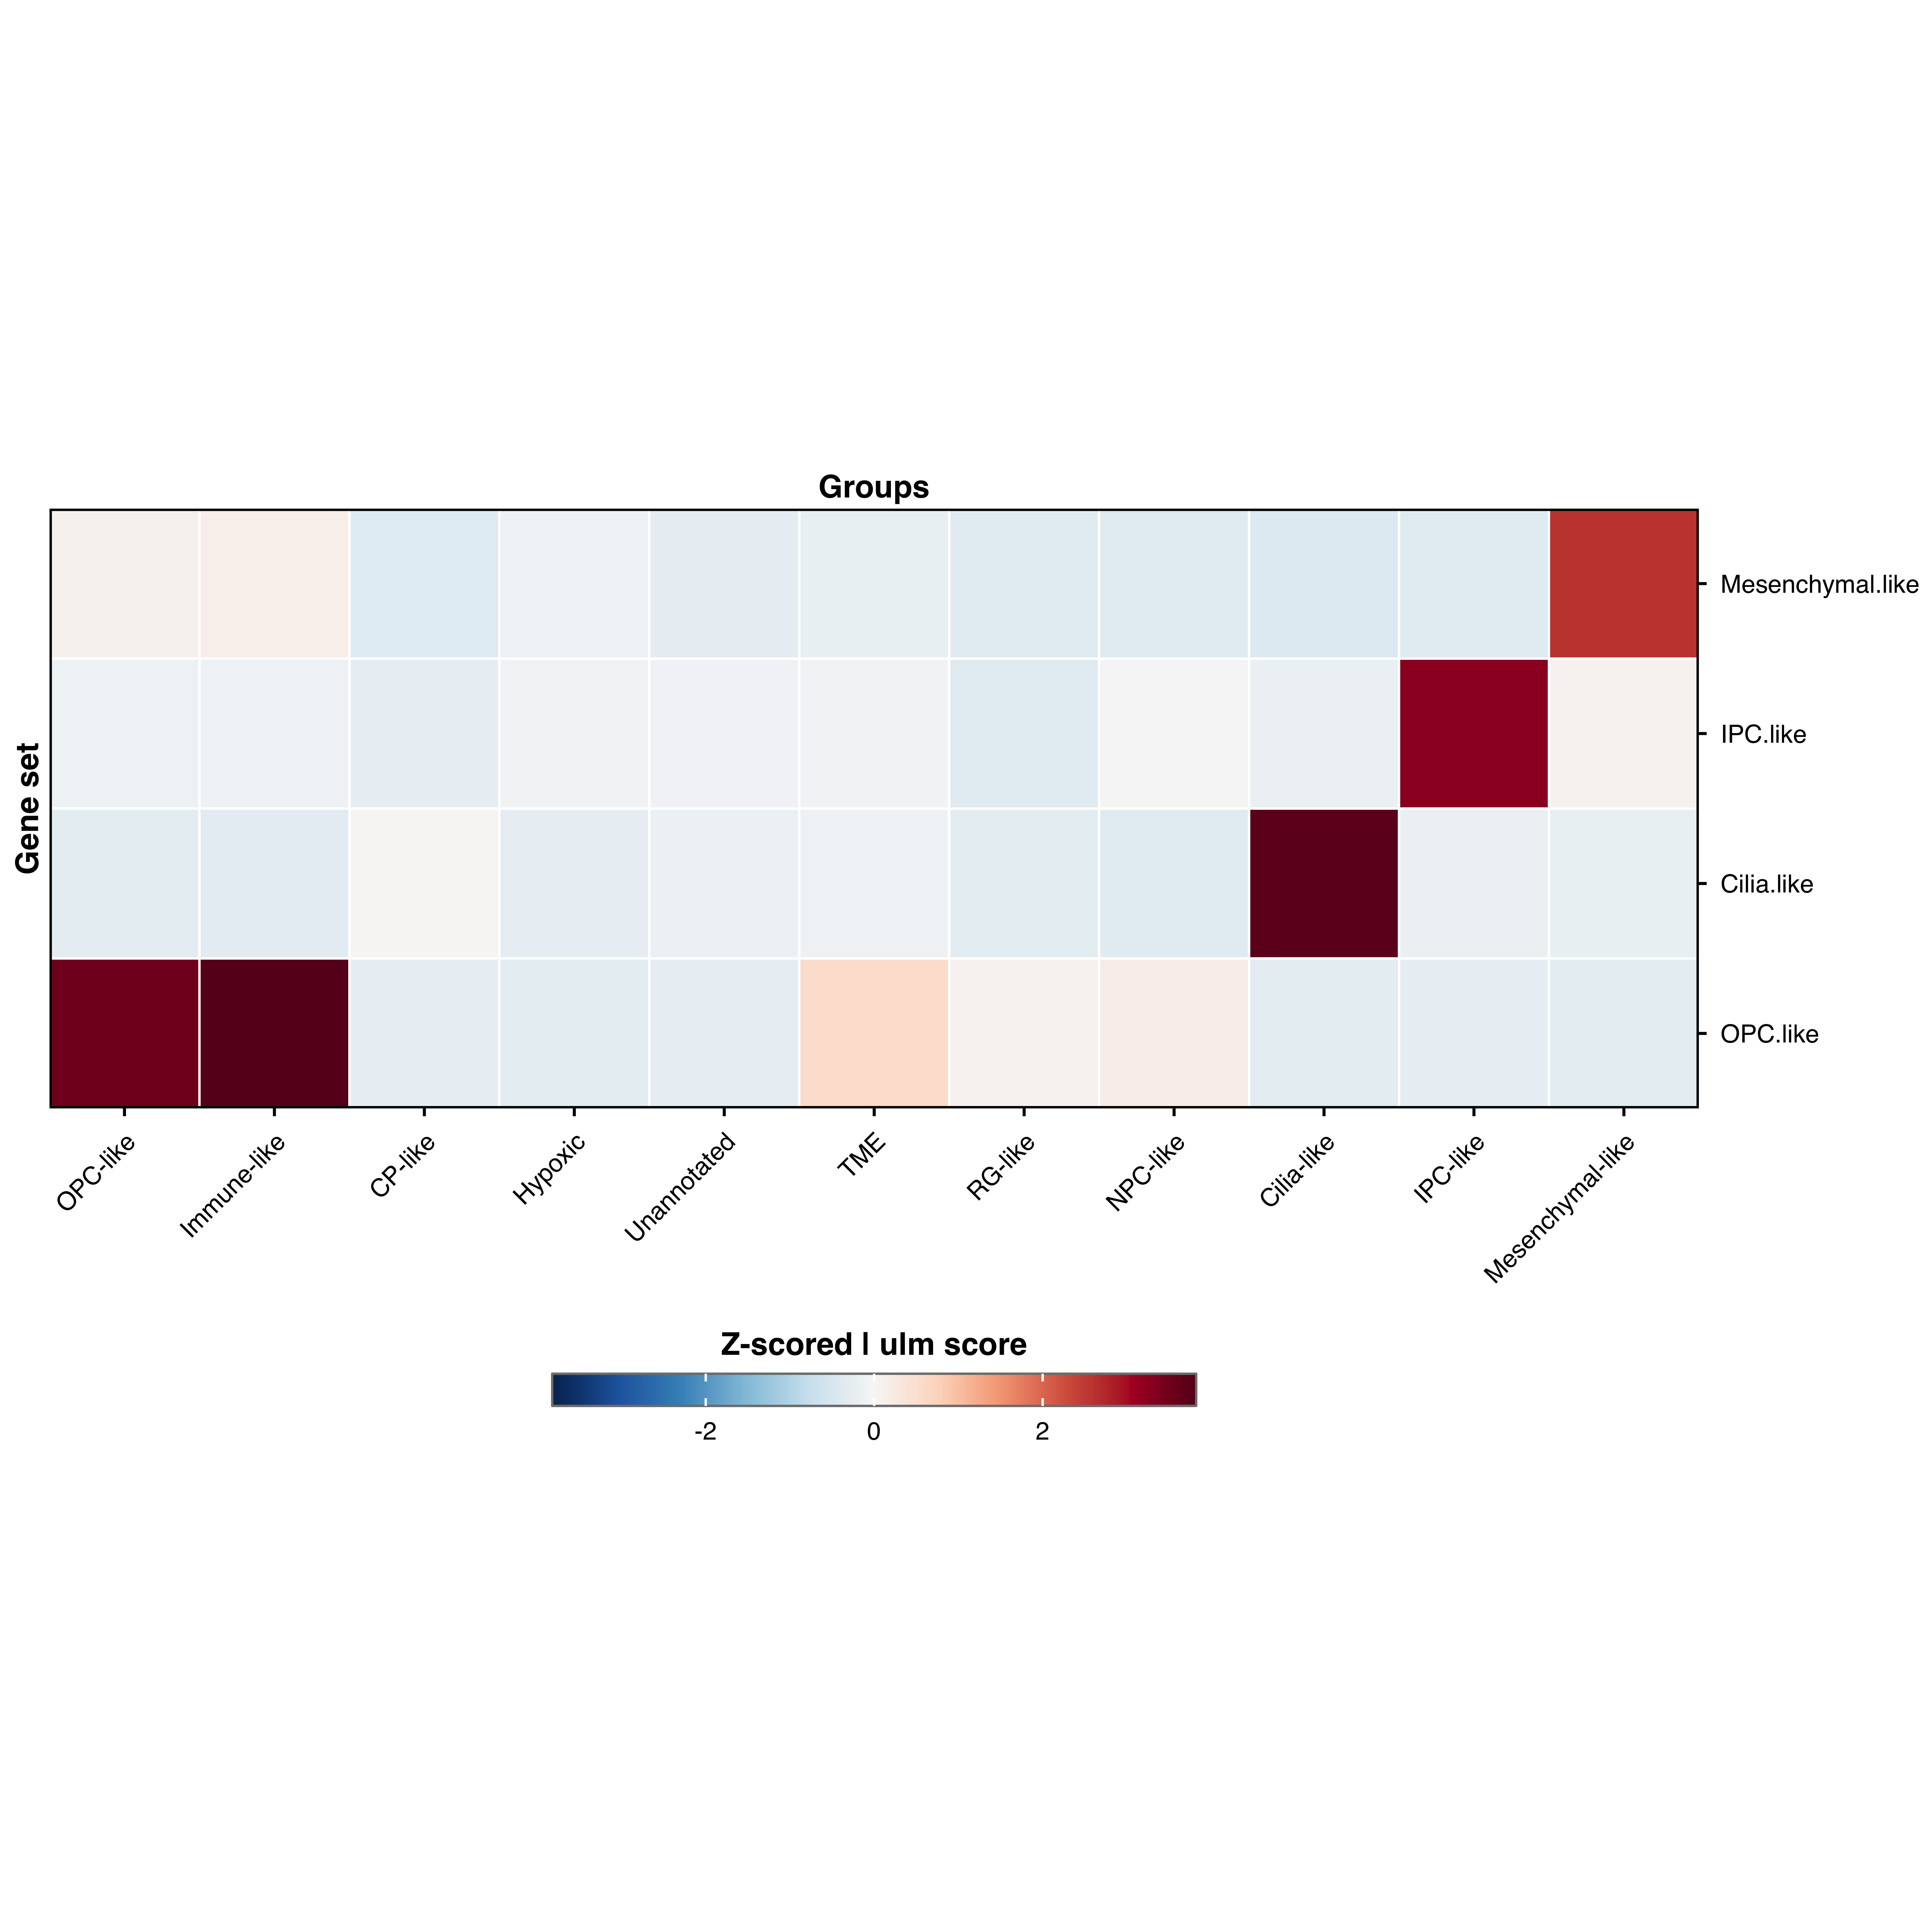
Activity heatmaps display gene set activity scores computed using decoupleR. Input a named list of gene sets and the function computes activity scores per cell, then aggregates them by group for visualization.
Basic usage
# Define gene sets gene_sets <- list ( "IPC.like" = c ( "CDC25C" , "KIF18B" , "KIF14" , "CENPE" , "POLQ" ) ,
"Cilia.like" = c ( "DNAAF1" , "ADGB" , "CFAP61" , "CFAP157" , "CFAP46" ) ,
"OPC.like" = c ( "KCNQ5" , "MEOX2" , "MBP" , "SNTG1" , "KCNIP1" ) ,
"Mesenchymal.like" = c ( "S100A1" , "MGP" , "TNNT1" , "H2AFJ" , "KCNIP1" )
) p <- SCpubr :: do_ActivityHeatmap ( sample = sample , input_gene_list = gene_sets )
p
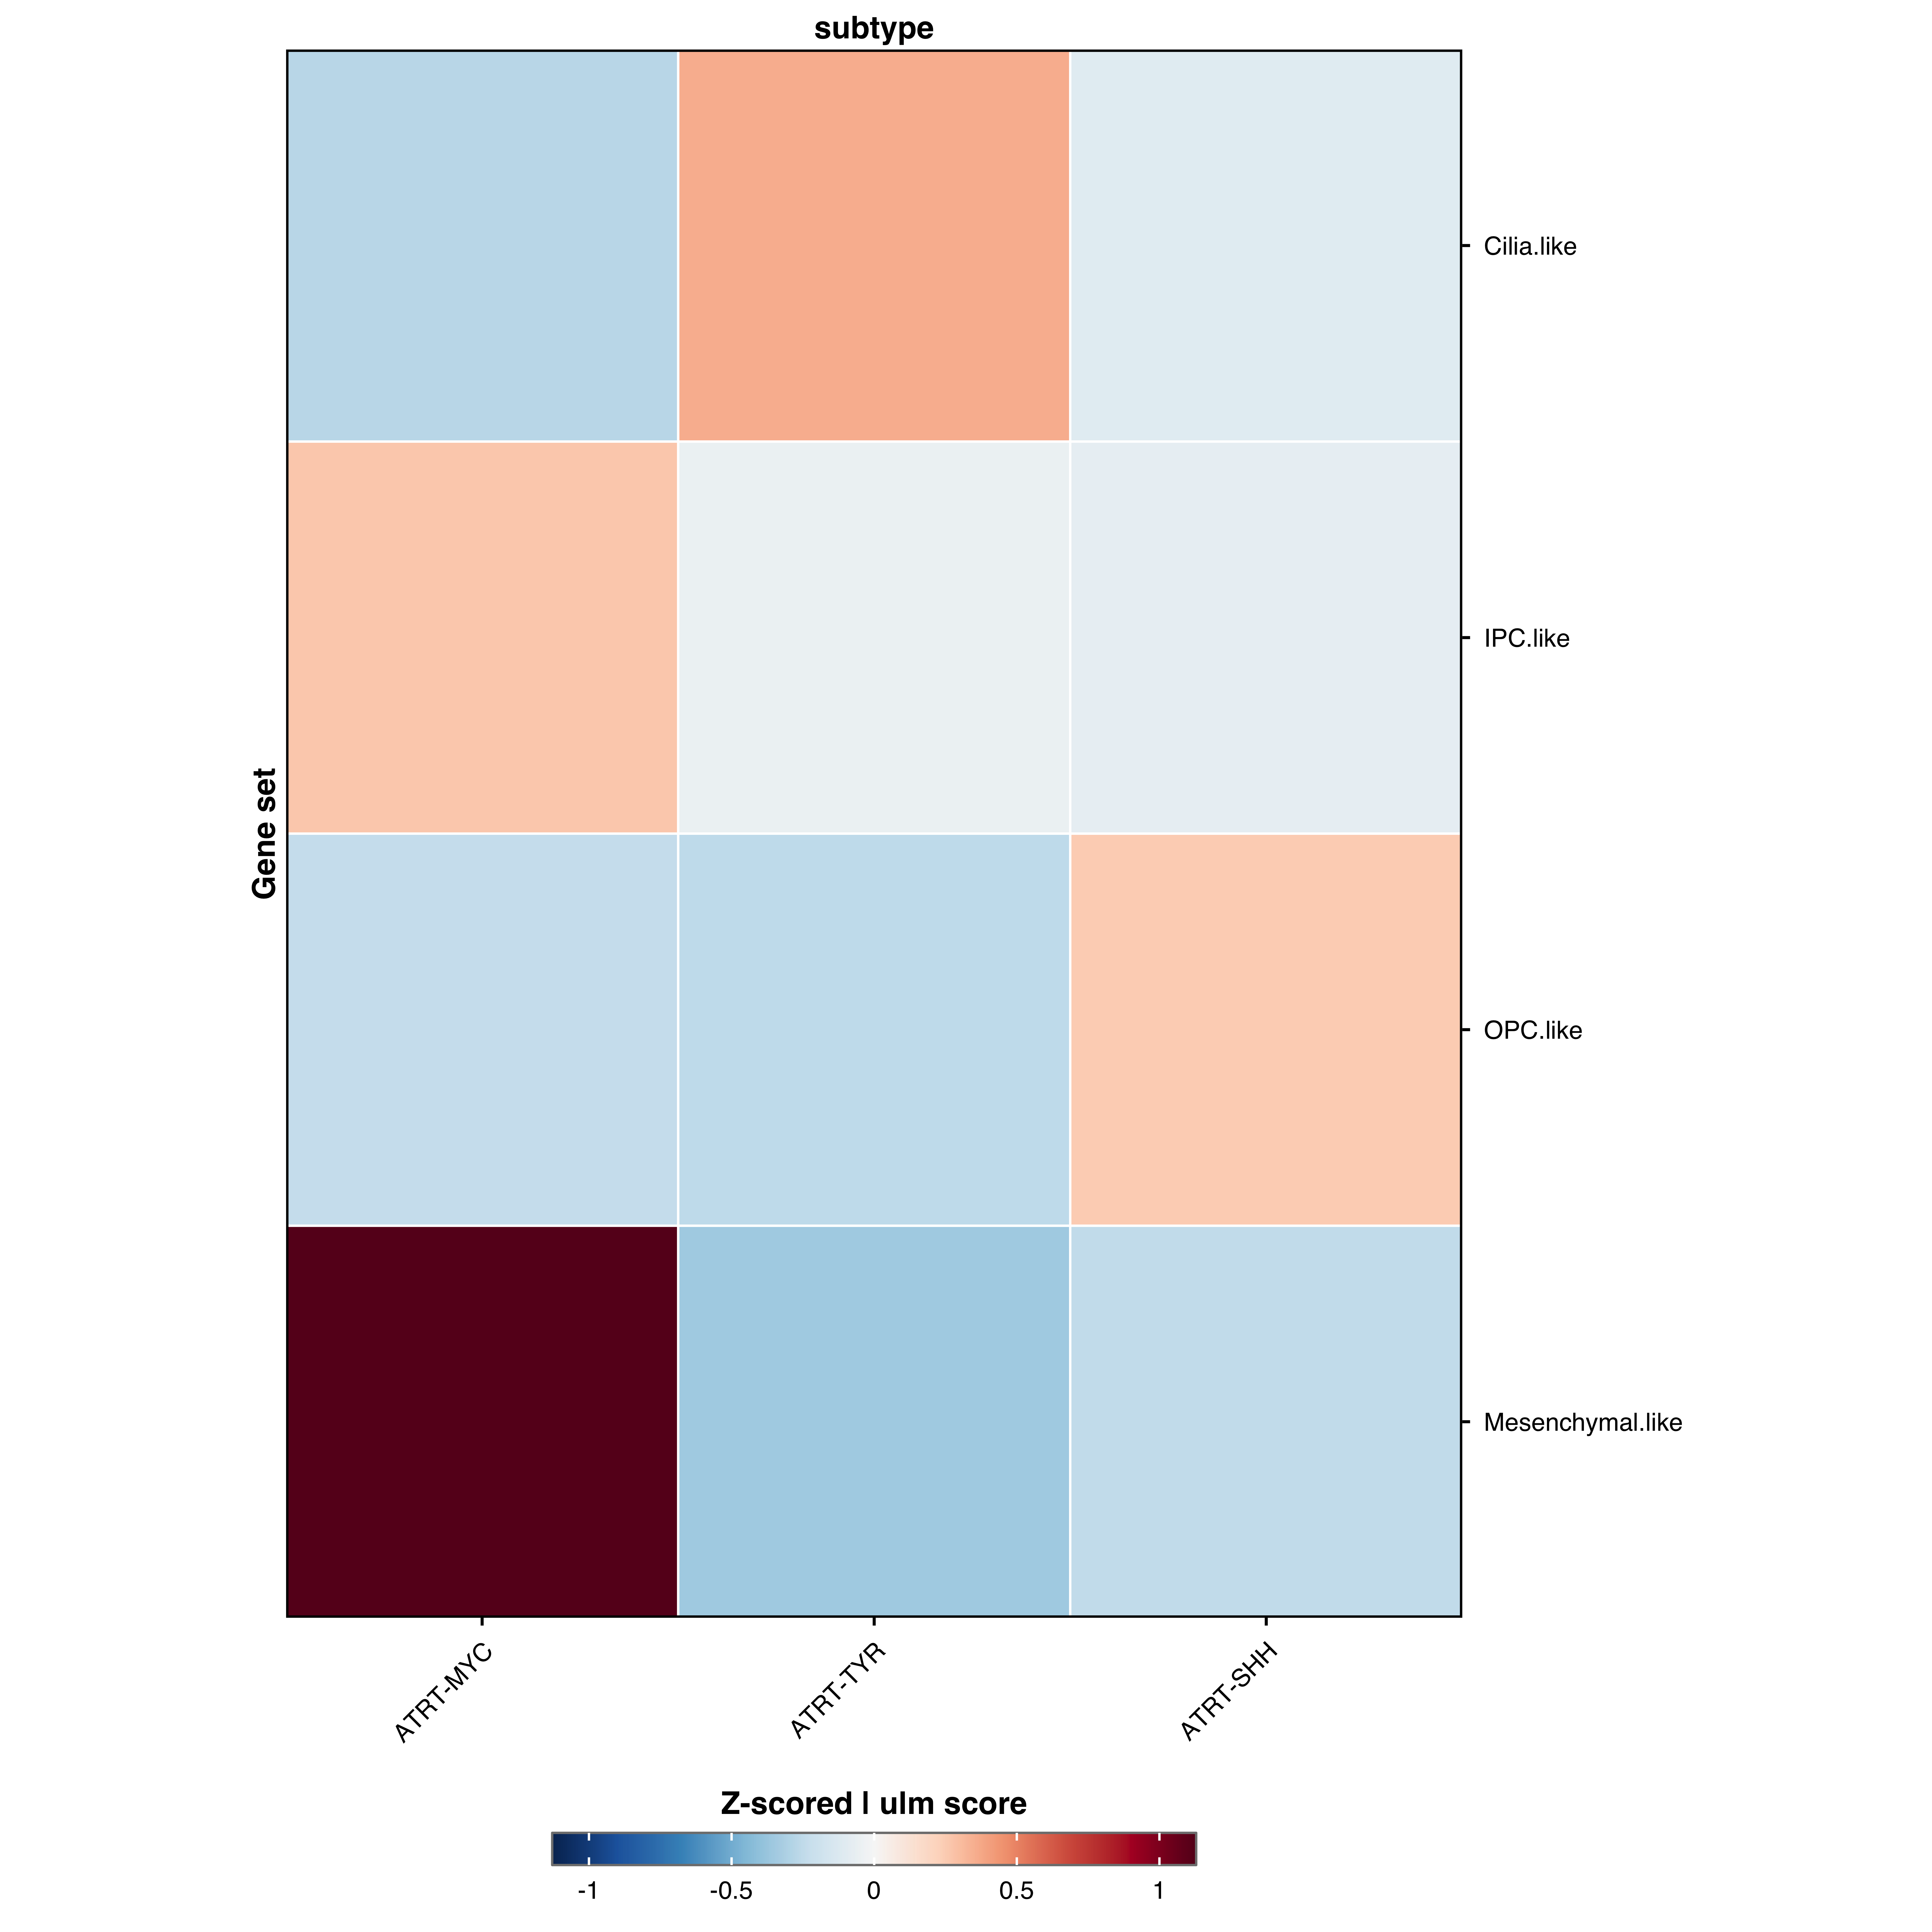
Group by custom variable
p <- SCpubr :: do_ActivityHeatmap ( sample = sample , input_gene_list = gene_sets ,
group.by = "subtype" )
p
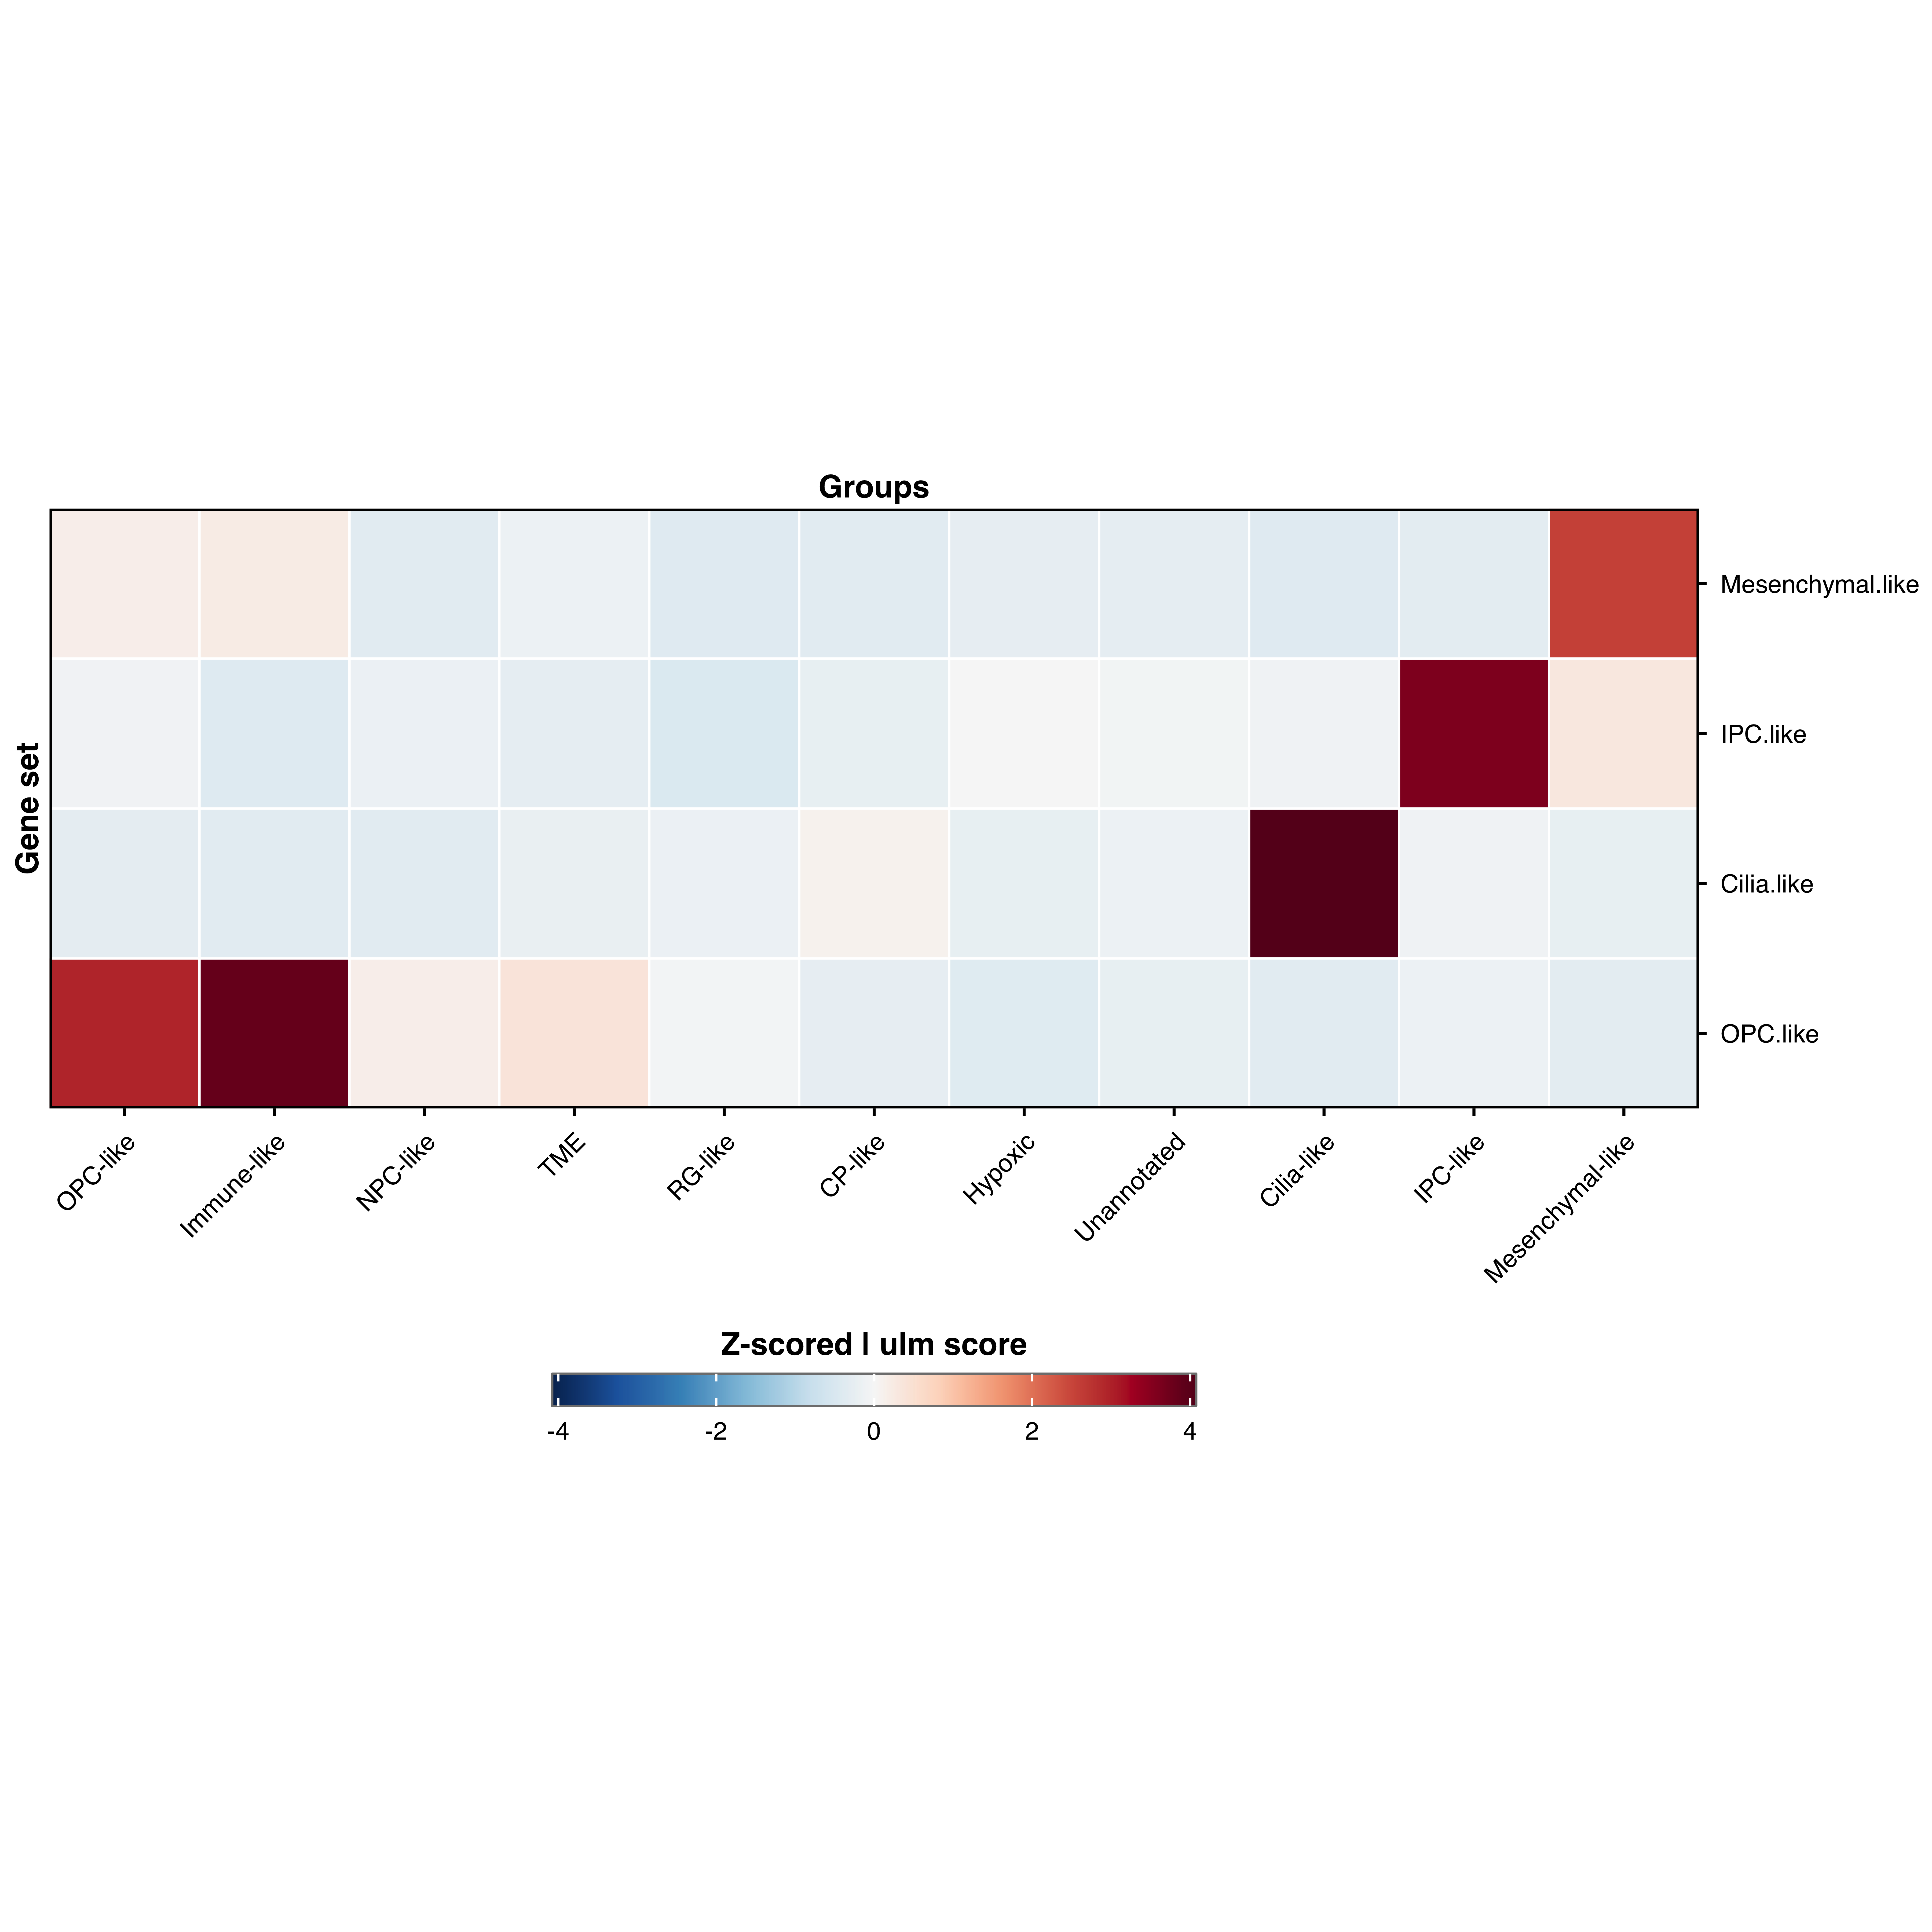
Subsample cells
p <- SCpubr :: do_ActivityHeatmap ( sample = sample , input_gene_list = gene_sets ,
subsample = 1000 )
p
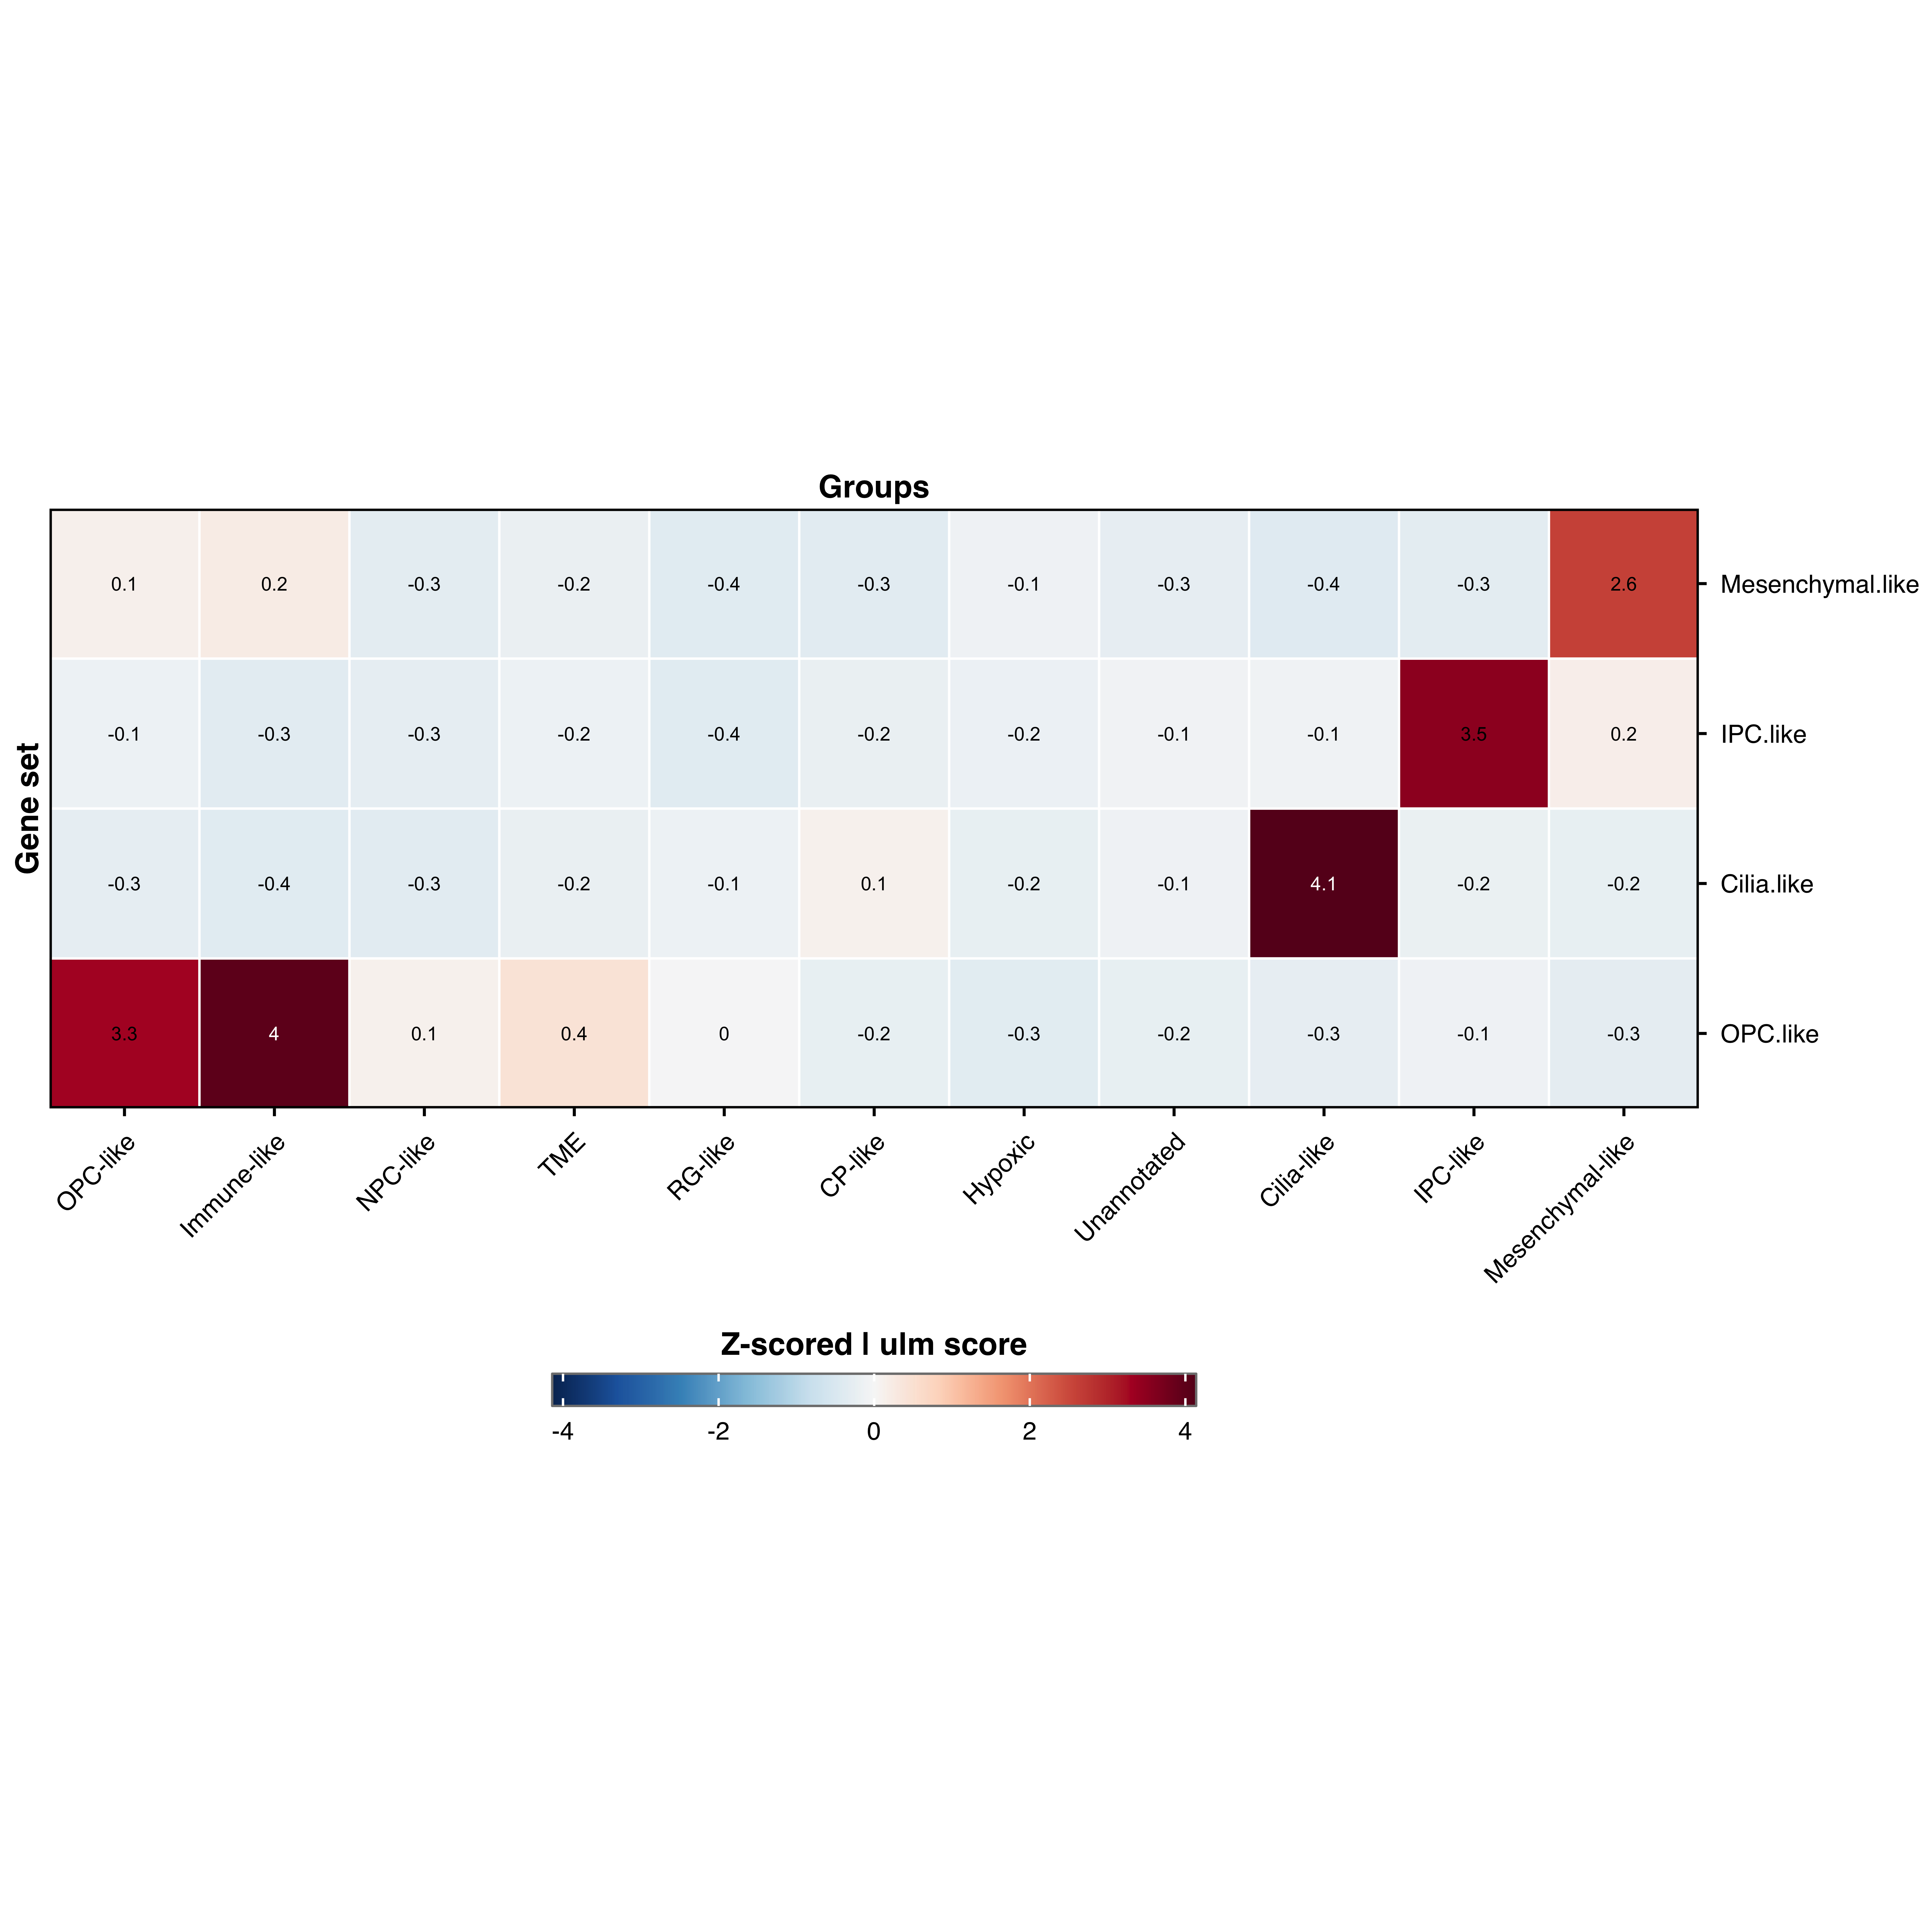
Show values
p <- SCpubr :: do_ActivityHeatmap ( sample = sample , input_gene_list = gene_sets ,
values.show = TRUE ,
values.threshold = 4 )
p
Return data object
result <- SCpubr :: do_ActivityHeatmap ( sample = sample , input_gene_list = gene_sets ,
return_object = TRUE )
# Access the plot result $ plot # Access activity data result $ activities
Parameter reference
For parameters shared across many functions (color palettes, typography, legend styling, grid), see Shared features .
Core parameters
input_gene_listNamed list of gene sets
—
statisticDecoupleR statistic
"ulm"
flavorScoring method: "Seurat" or "UCell"
"Seurat"
return_objectReturn data along with plot
FALSE
Subsampling
subsampleNumber of cells to sample
2500
nbinNumber of bins for scoring
24
ctrlControl genes per bin
100
Values display
values.showShow numeric values
FALSE
values.thresholdThreshold on which the text changes color
NULL
values.roundDecimal places
1