do_PathwayActivityHeatmap() | Pathway activity scores

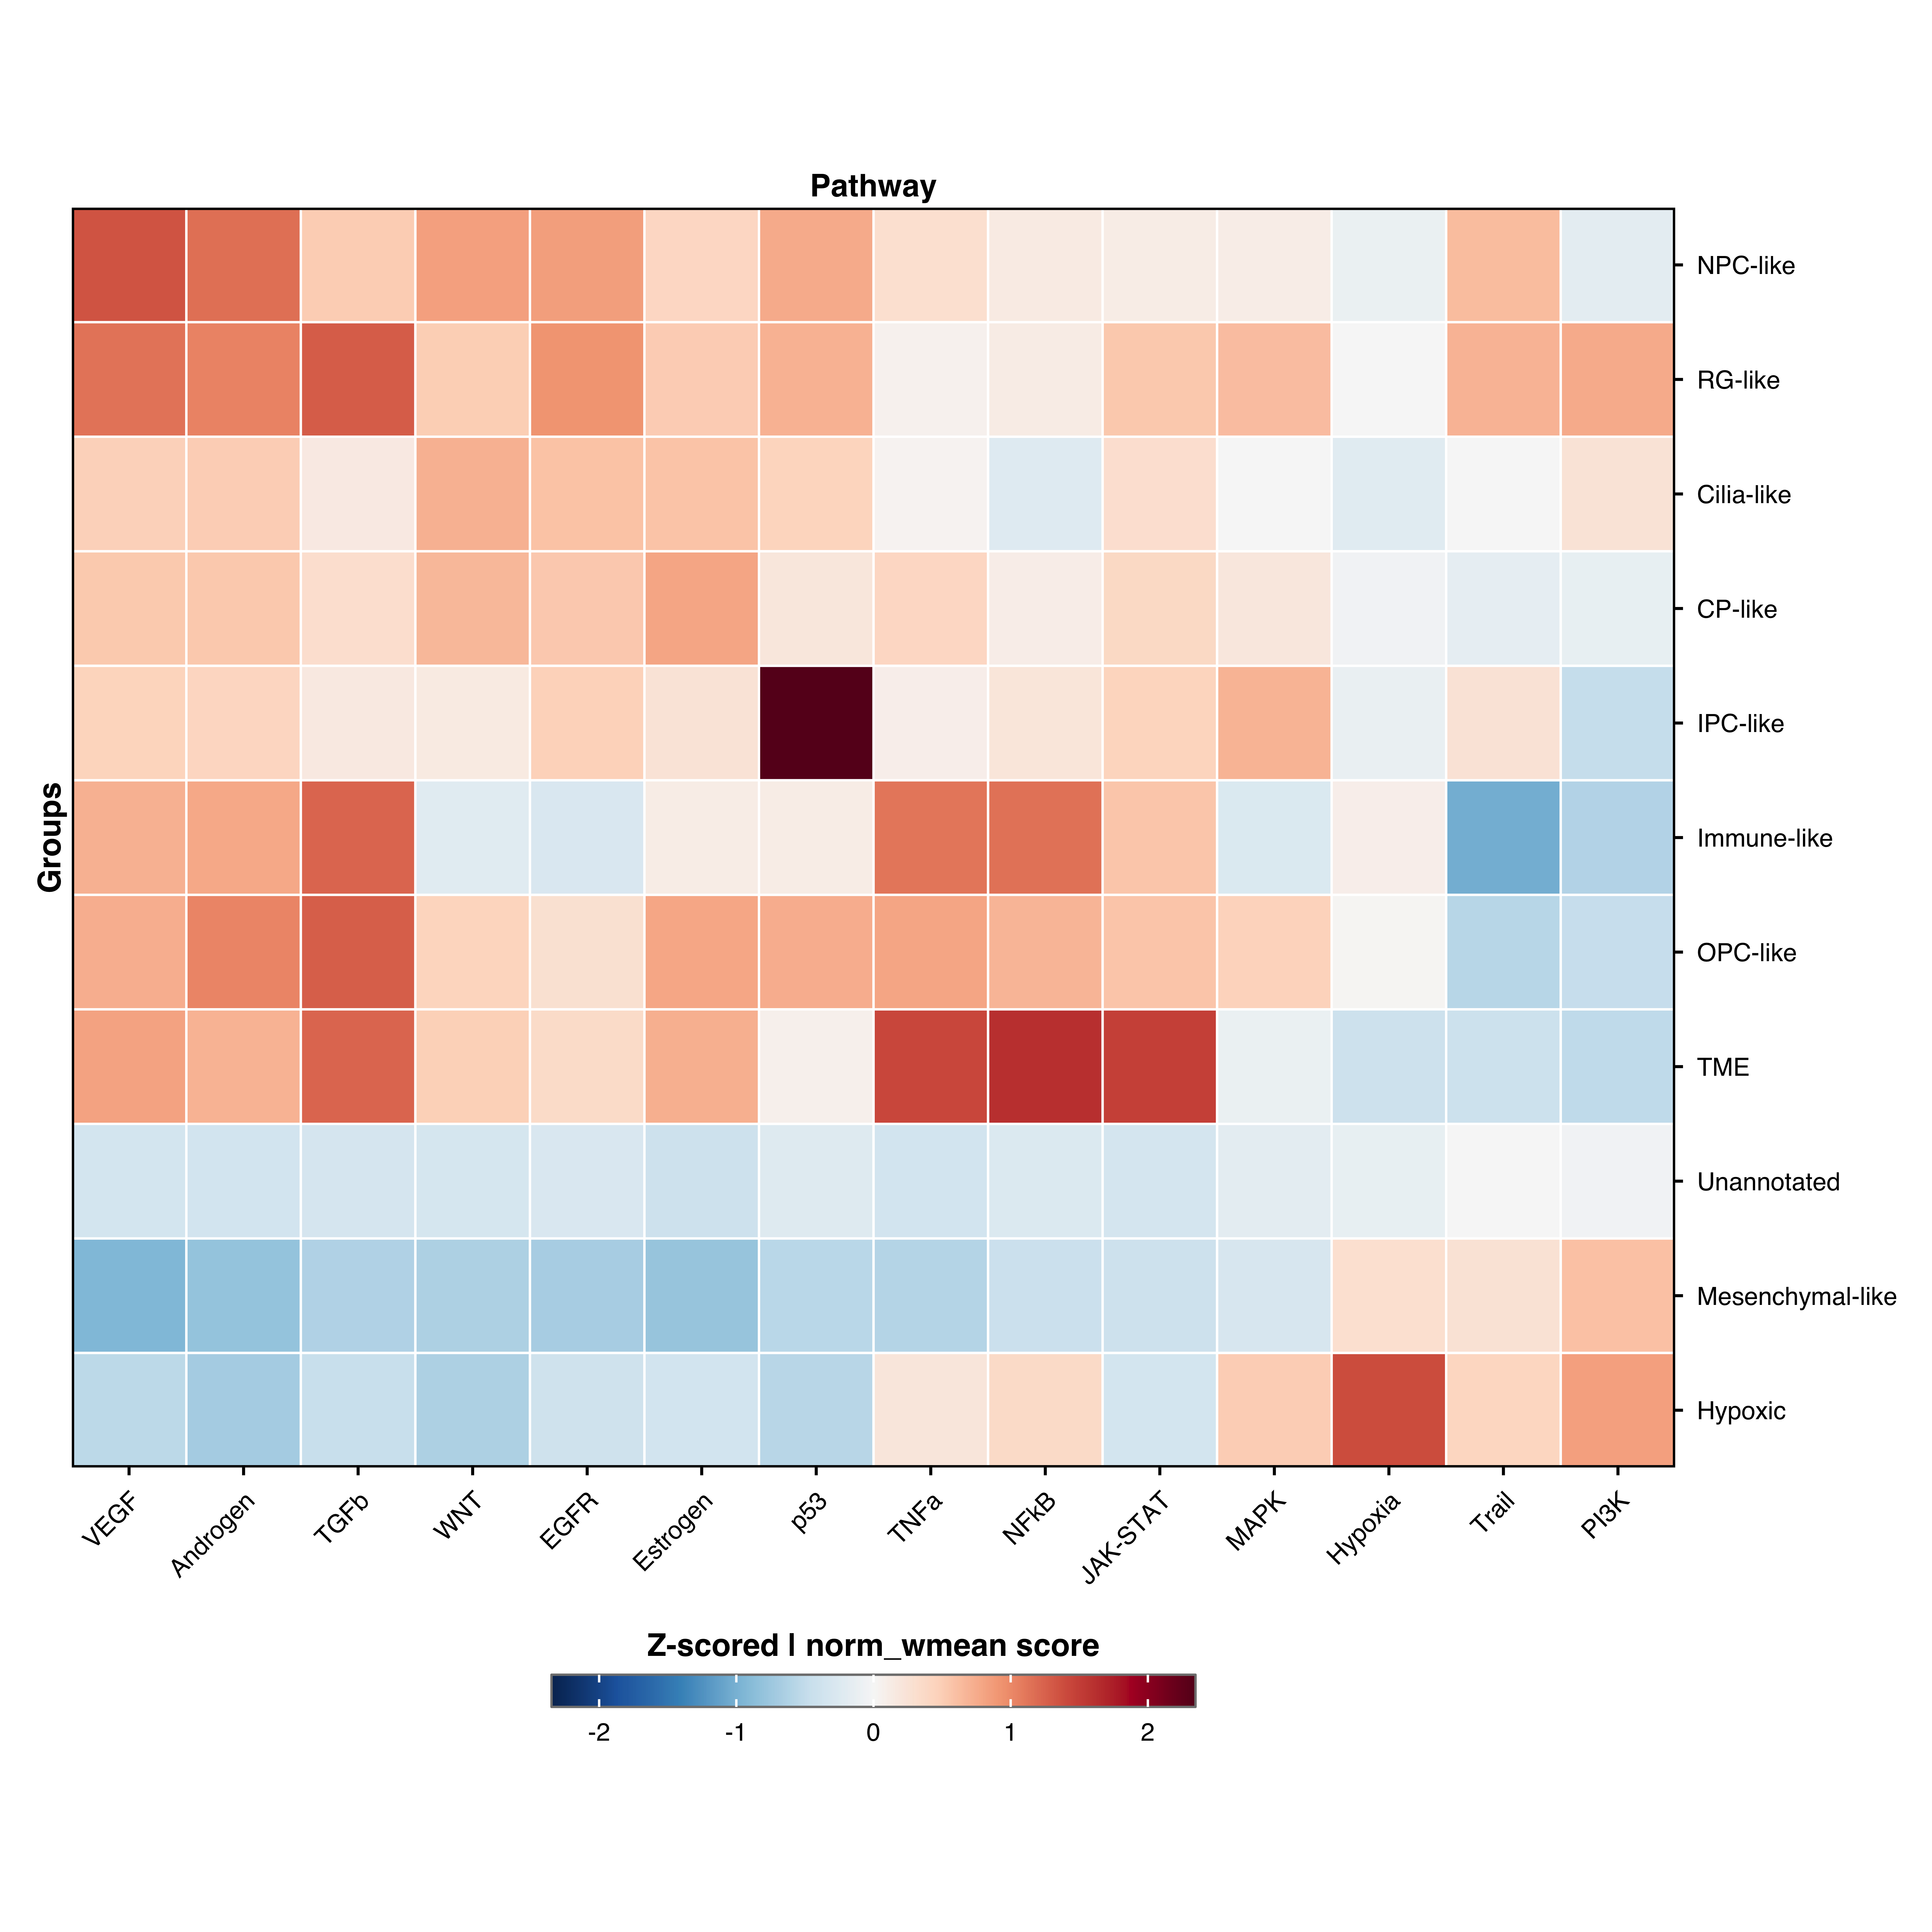
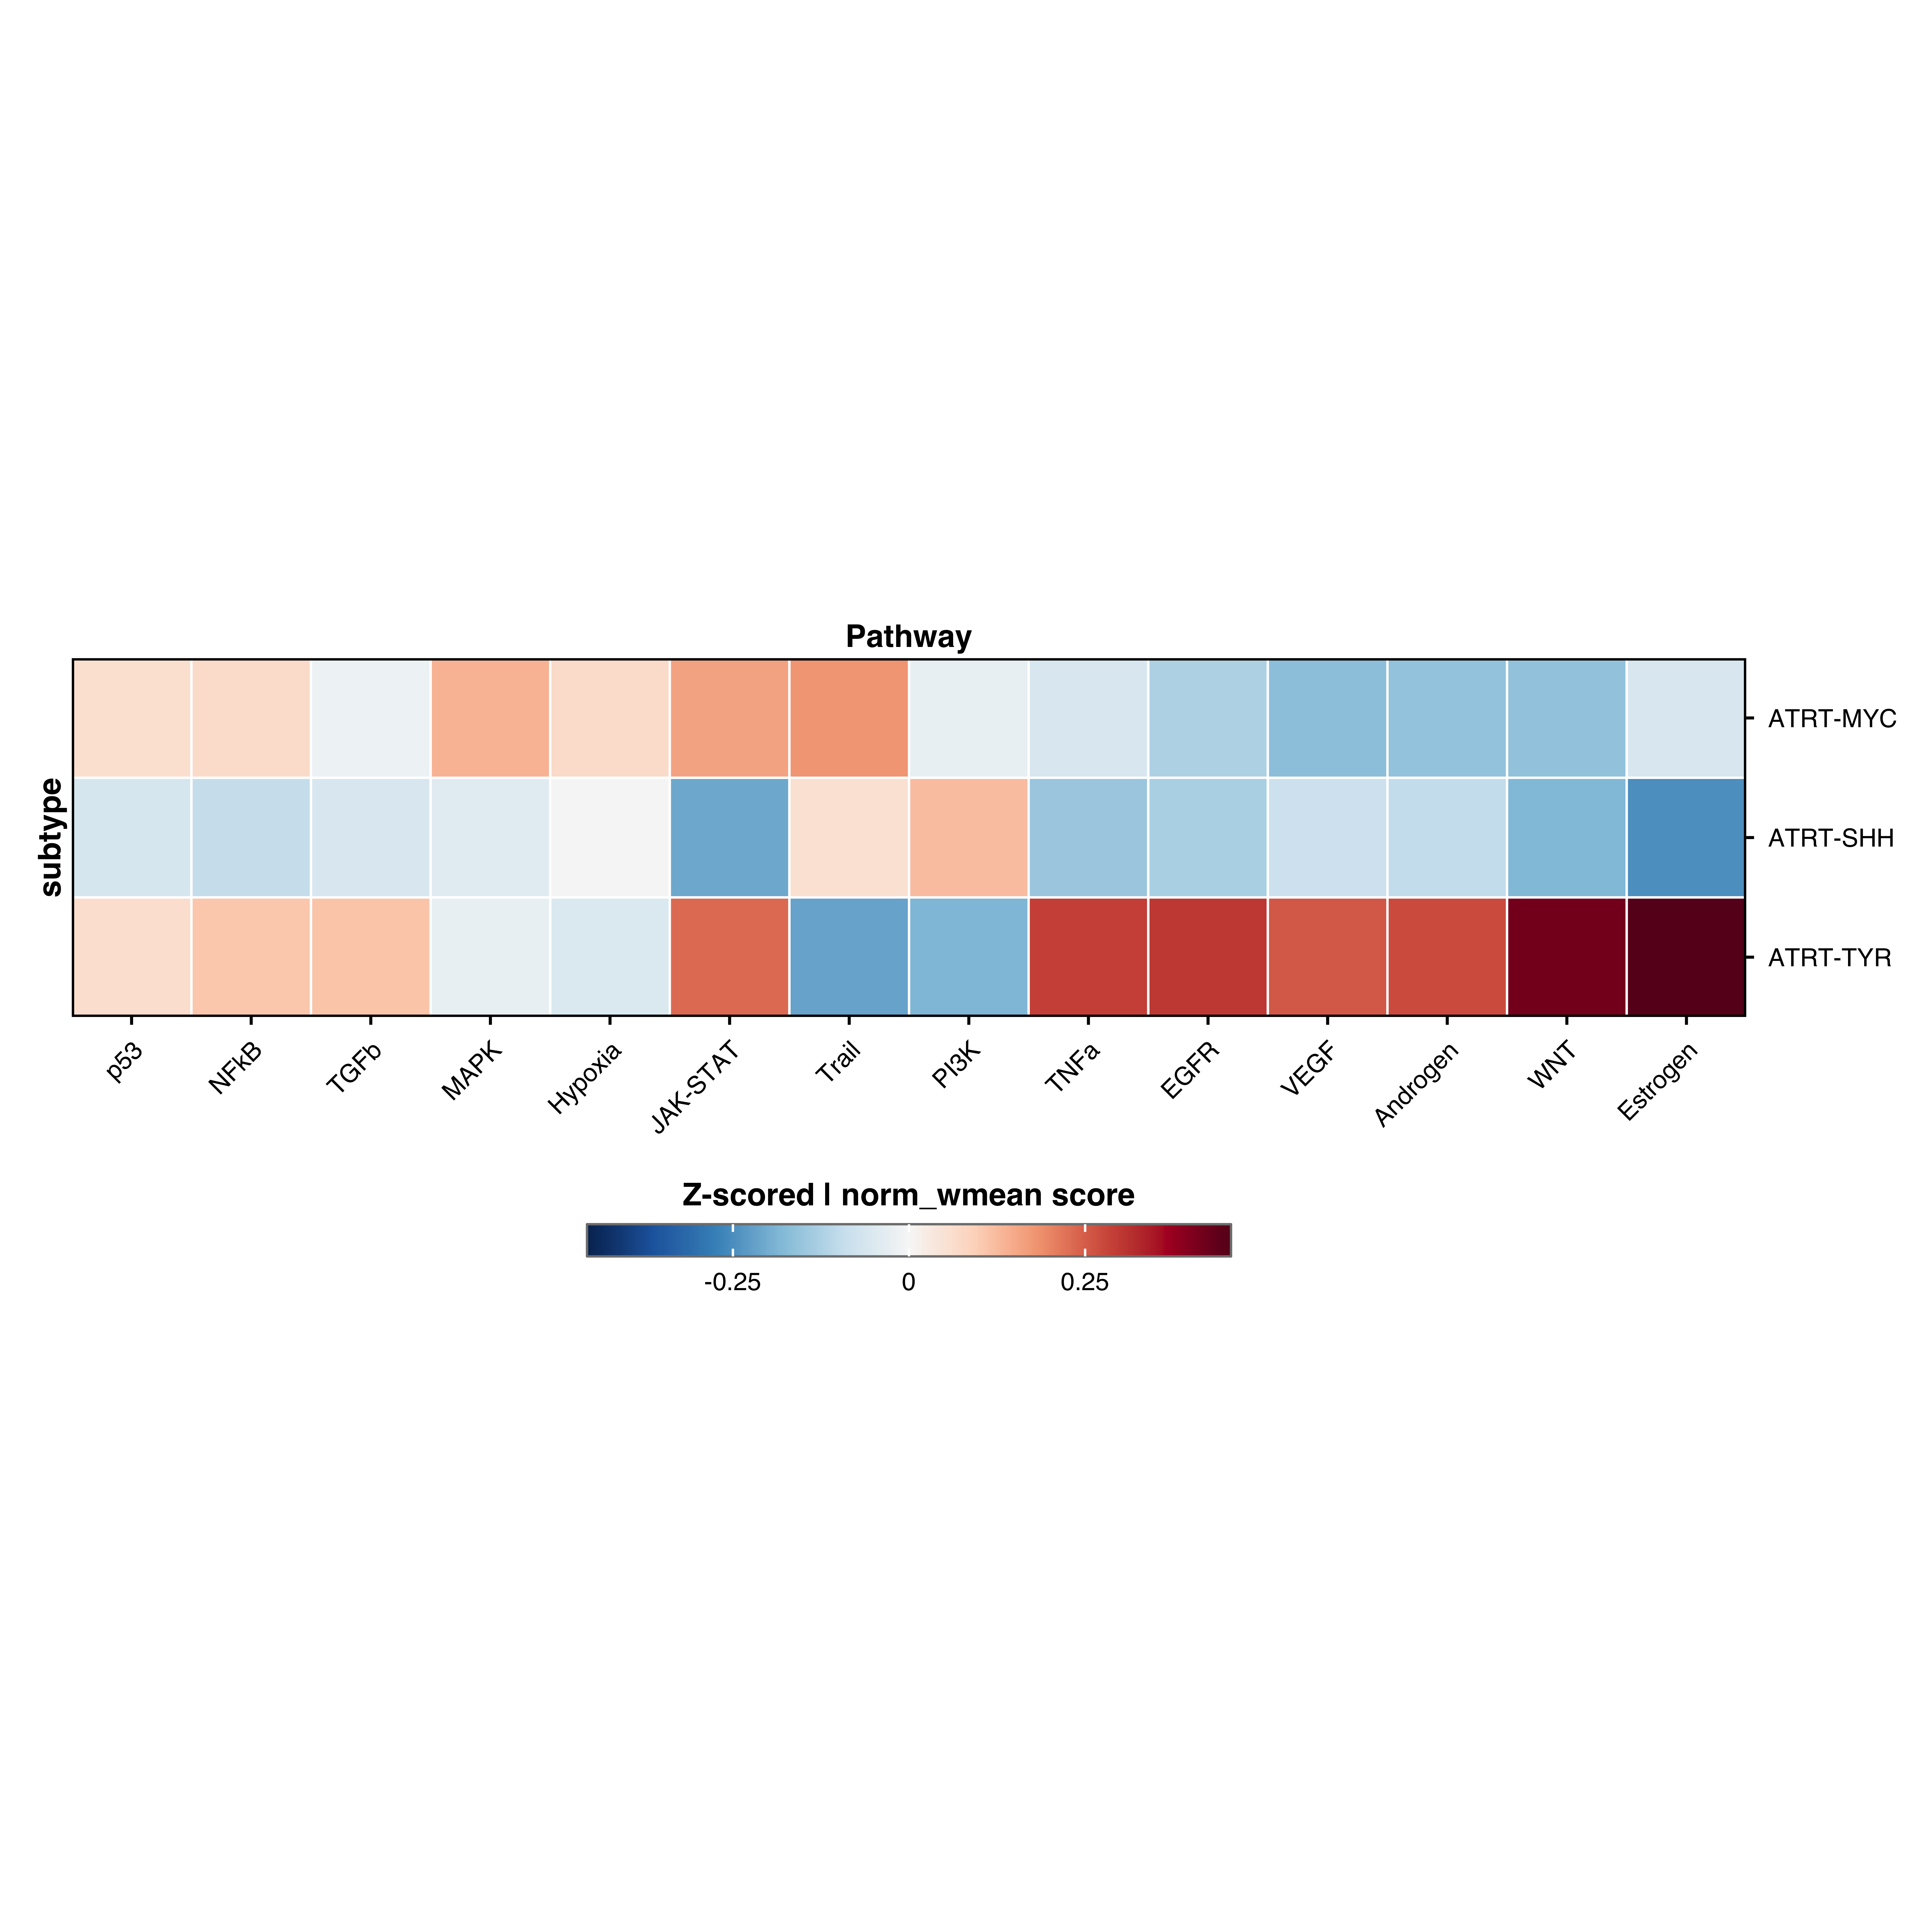
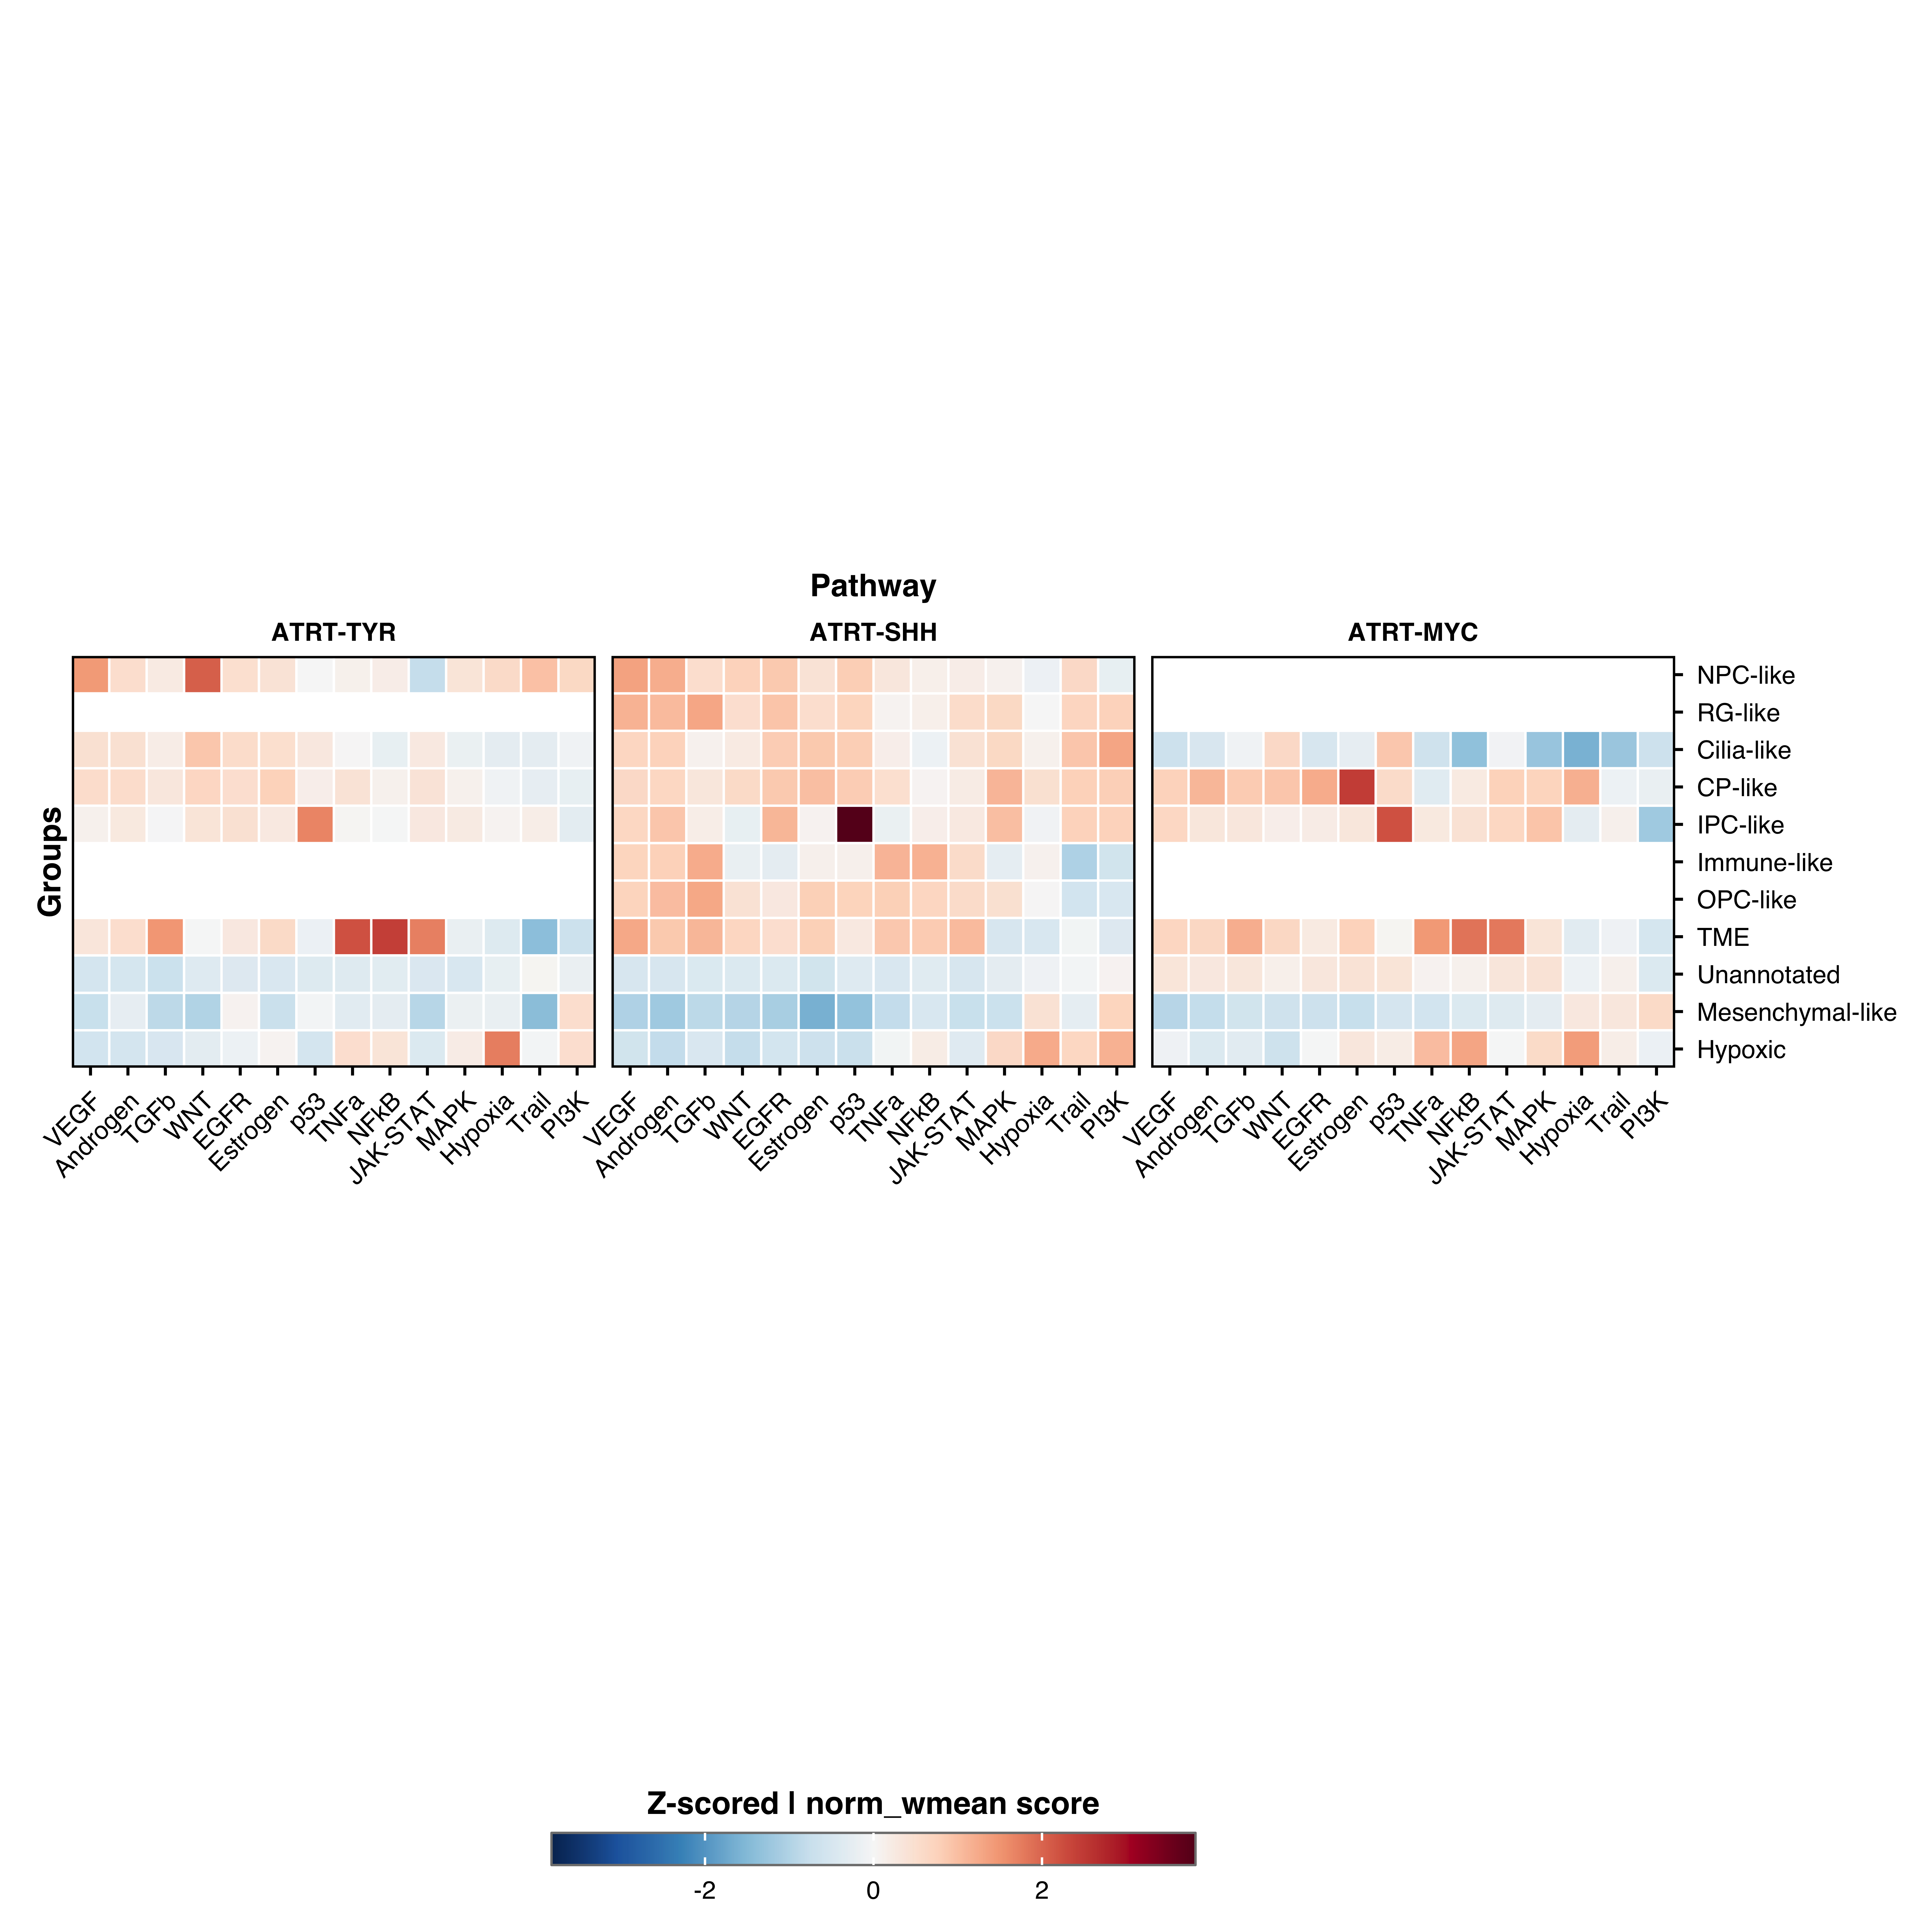
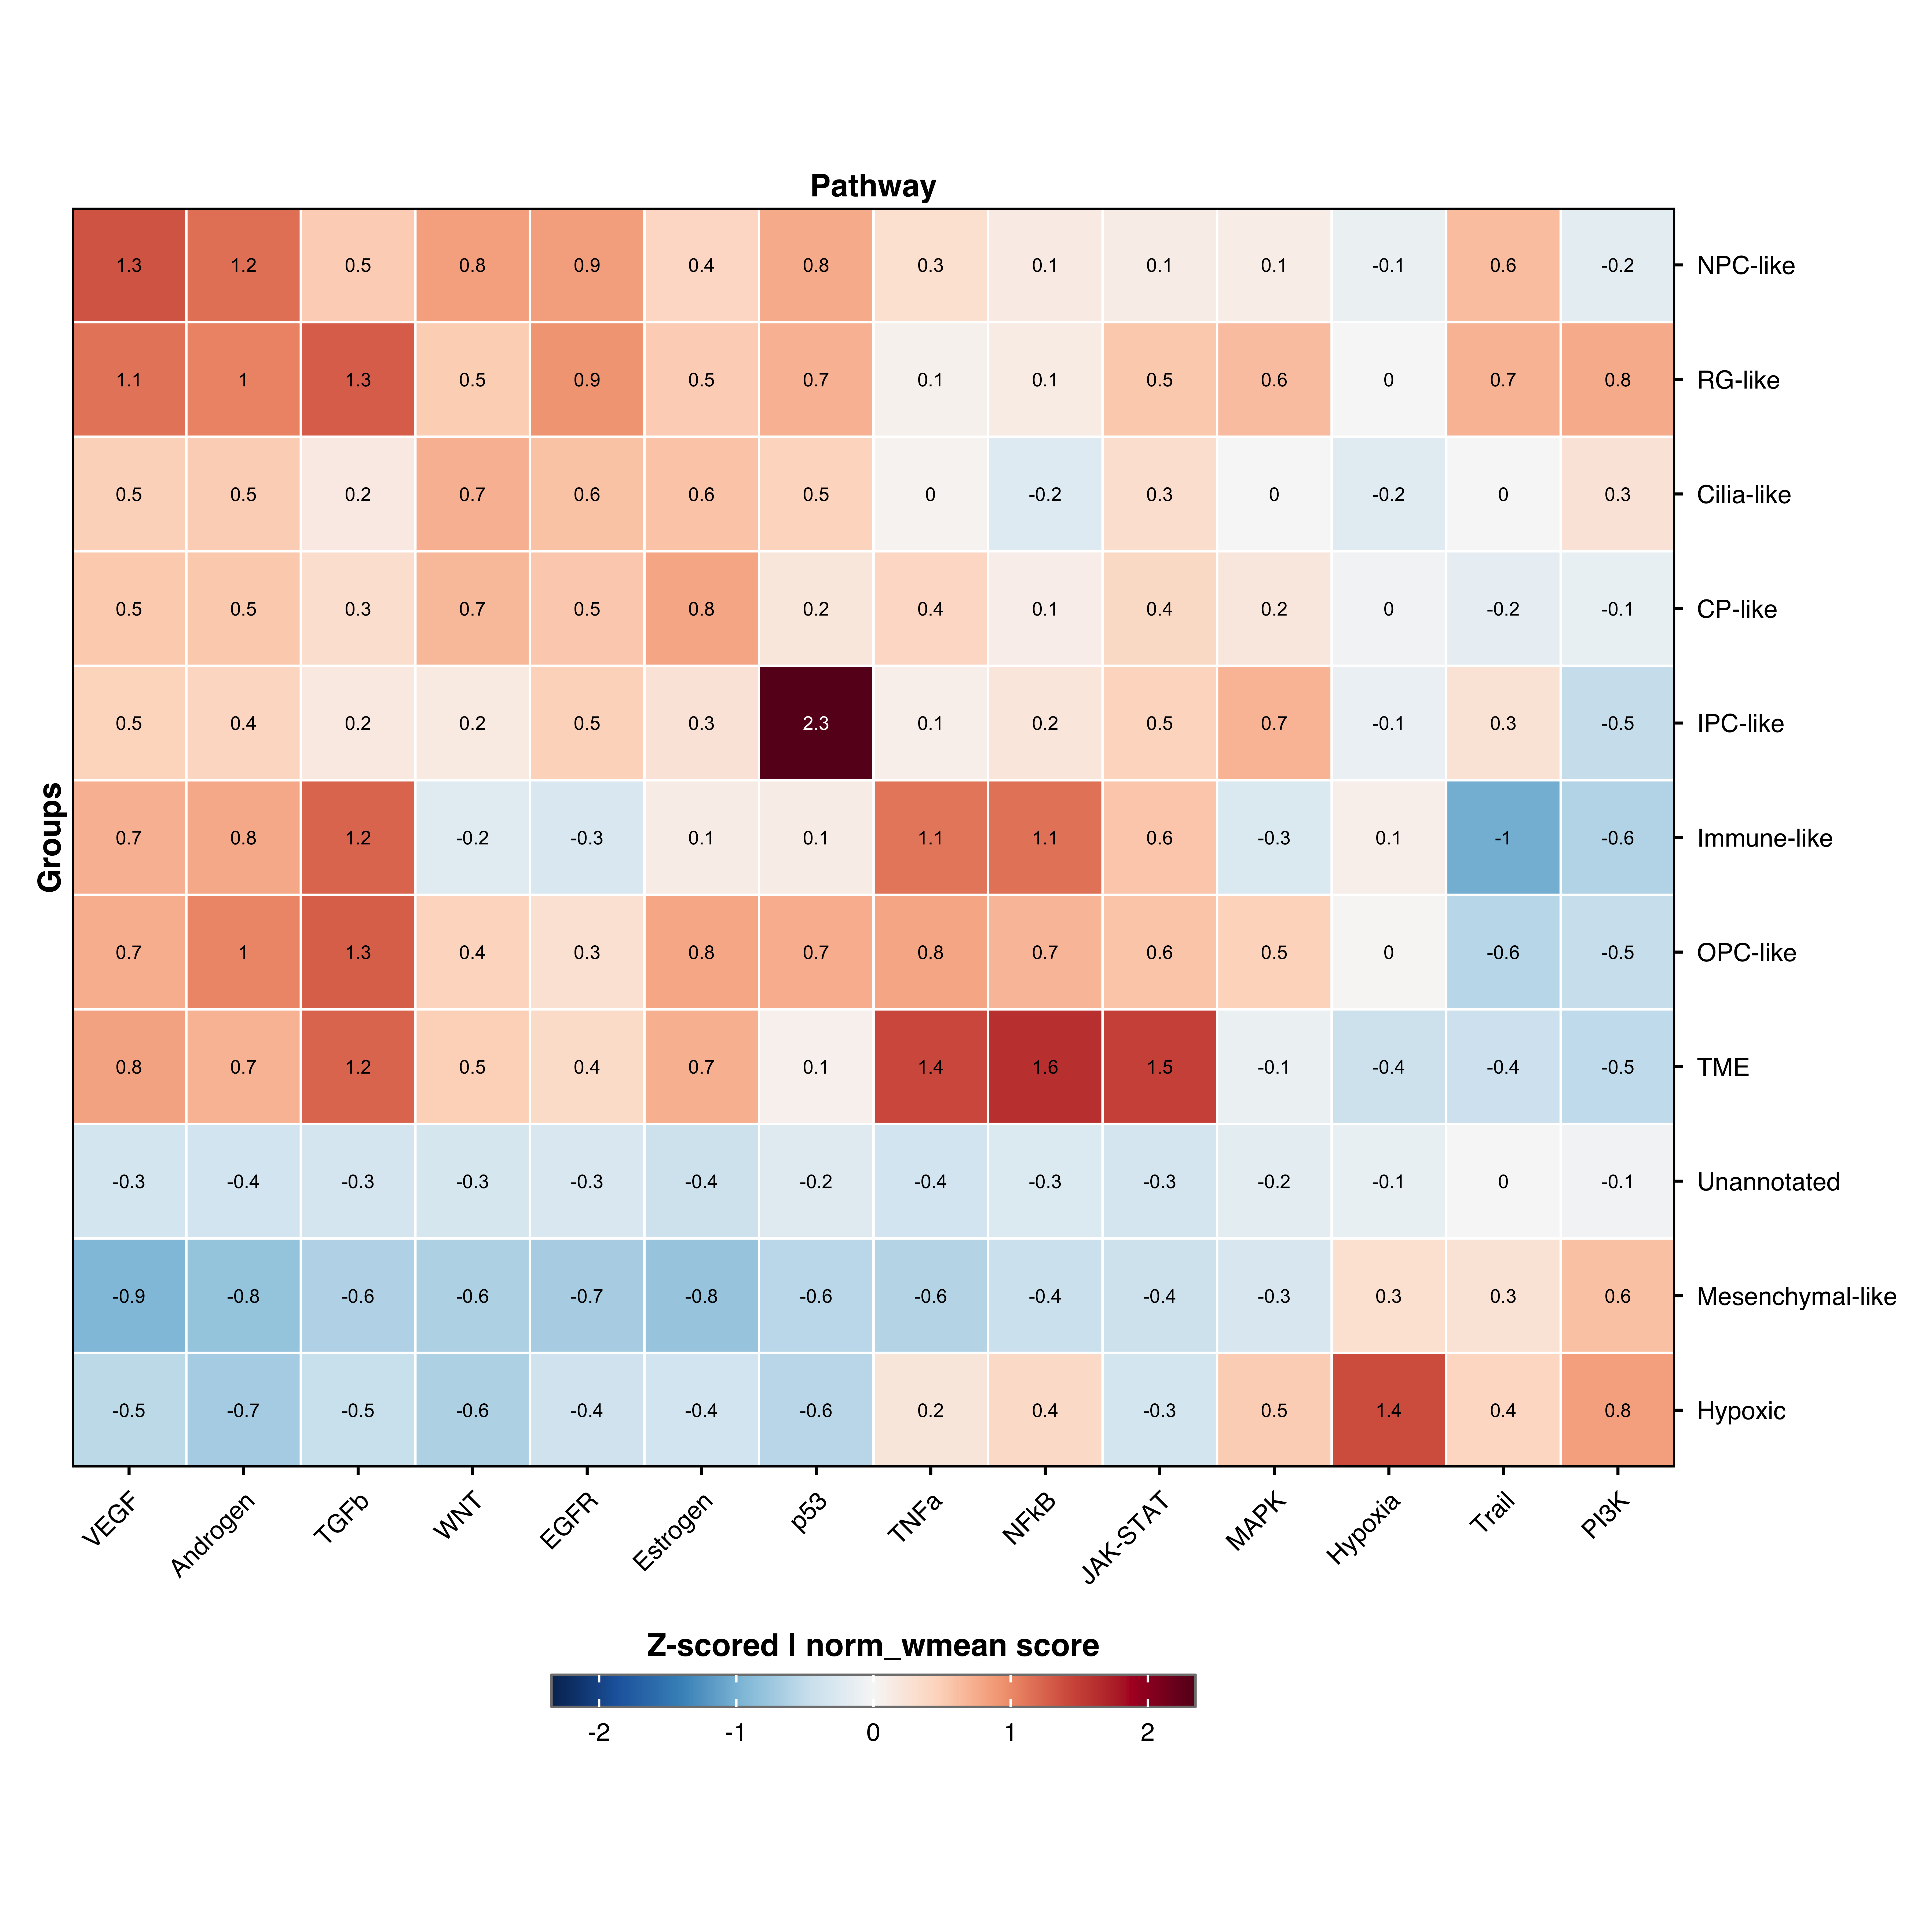
Pathway activity heatmaps visualize PROGENy pathway activity scores from decoupleR. Shows how different signaling pathways are activated across cell populations.


Basic usage

First compute pathway activities using decoupleR:

# Run decoupleR with PROGENy prior knowledge
net <- decoupleR::get_progeny(organism = "human", top = 500)
activities <- decoupleR::run_wmean(mat = as.matrix(sample[["RNA"]]$data), 
                                   net = net)

p <- SCpubr::do_PathwayActivityHeatmap(sample = sample,
                                       activities = activities)
p


Group by custom variable

p <- SCpubr::do_PathwayActivityHeatmap(sample = sample,
                                       activities = activities,
                                       group.by = "subtype")
p


Split by condition

p <- SCpubr::do_PathwayActivityHeatmap(sample = sample,
                                       activities = activities,
                                       split.by = "subtype")
p


Show values

p <- SCpubr::do_PathwayActivityHeatmap(sample = sample,
                                       activities = activities,
                                       values.show = TRUE,
                                       values.threshold = 2)
p


Parameter reference

Note

For parameters shared across many functions (color palettes, typography, legend styling, grid), see Shared features.

Core parameters

Parameter Description Default
activities DecoupleR output with PROGENy
statistic Activity statistic "norm_wmean"
return_object Return data along with plot FALSE

Values display

Parameter Description Default
values.show Show numeric values FALSE
values.size Value text size 3
values.threshold Threshold on which the text changes color NULL
values.round Decimal places 1

See also