p <- SCpubr::do_AlluvialPlot(sample = sample,
                             first_group = "Annotation",
                             last_group = "subtype")
p
Alluvial plots visualize how cells flow between categorical groups—for example, how cluster assignments change across conditions, time points, or annotation methods. Built on the ggalluvial package.
Visualize how cells in clusters map to cell types:
p <- SCpubr::do_AlluvialPlot(sample = sample,
first_group = "Annotation",
last_group = "subtype")
p
Add intermediate nodes between start and end:
p <- SCpubr::do_AlluvialPlot(
  sample        = sample,
  first_group   = "technology",
  middle_groups = c("Annotation"),
  last_group    = "subtype"
)
p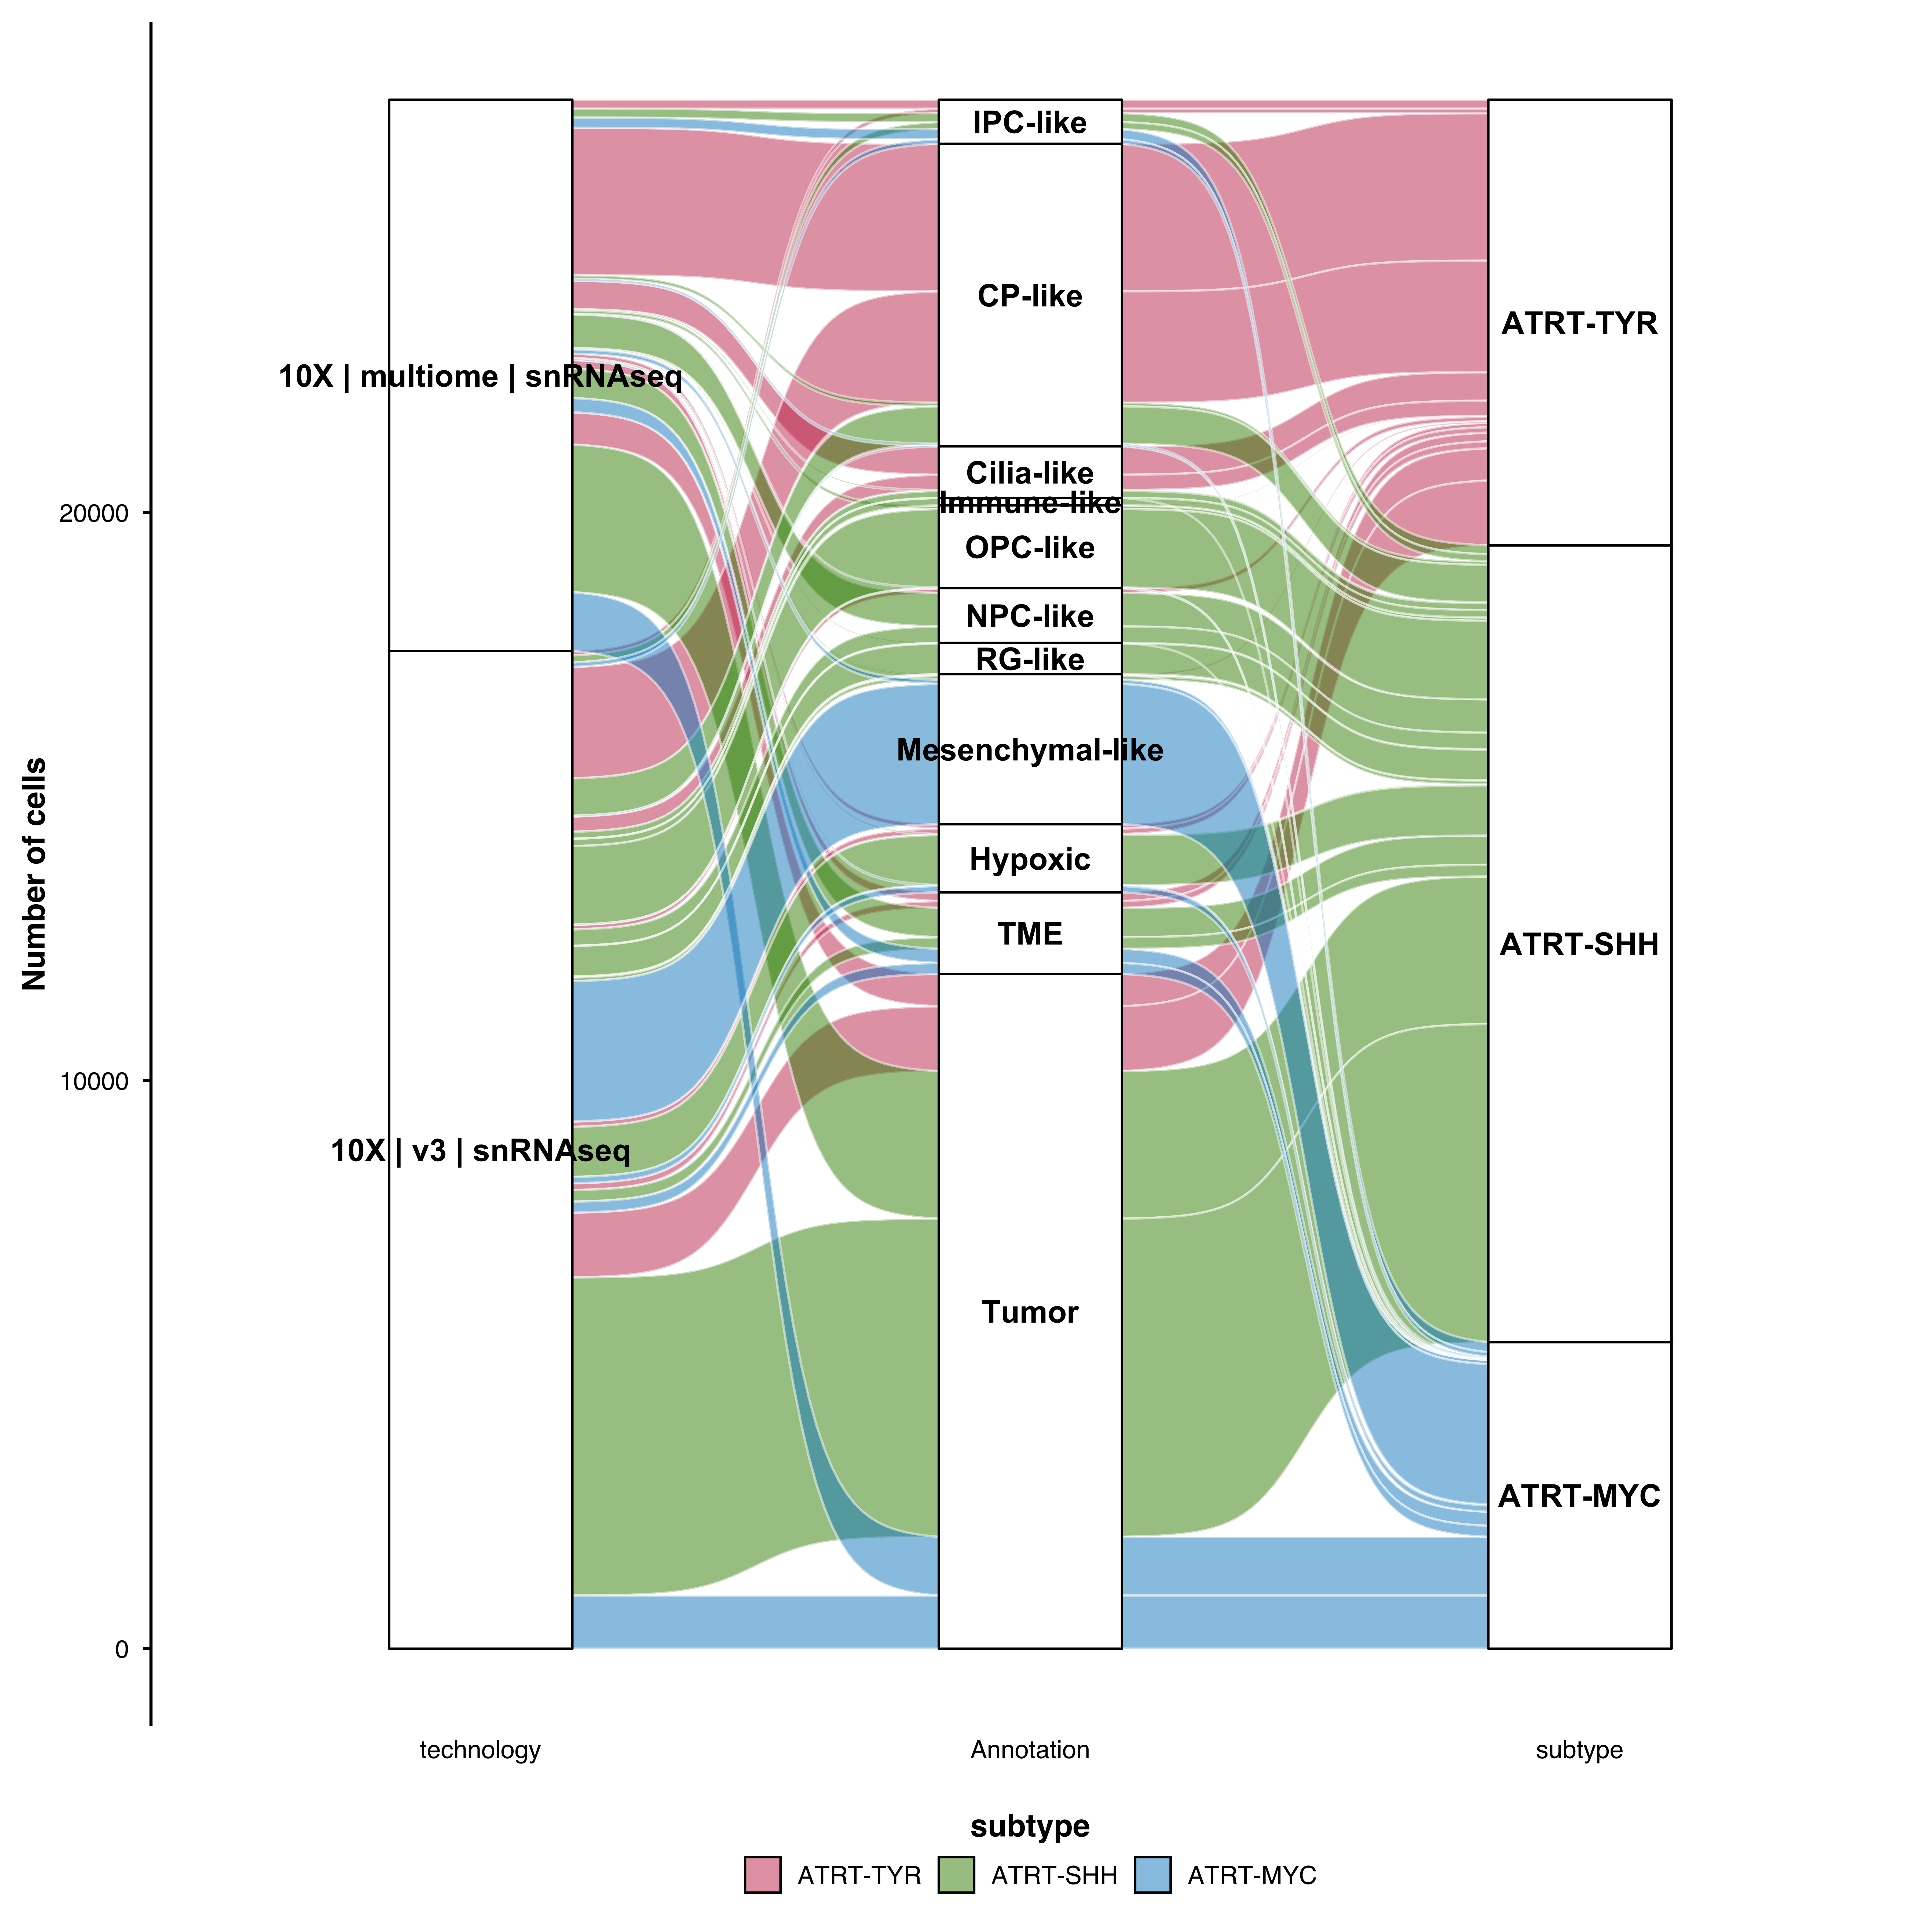
Control which group determines the flow colors:
# Color by last group (default)
p <- SCpubr::do_AlluvialPlot(sample = sample,
                             first_group = "Annotation",
                             last_group = "subtype",
                             fill.by = "subtype")

p
# Color by first group
p <- SCpubr::do_AlluvialPlot(sample = sample,
                             first_group = "Annotation",
                             last_group = "subtype",
                             fill.by = "Annotation")

p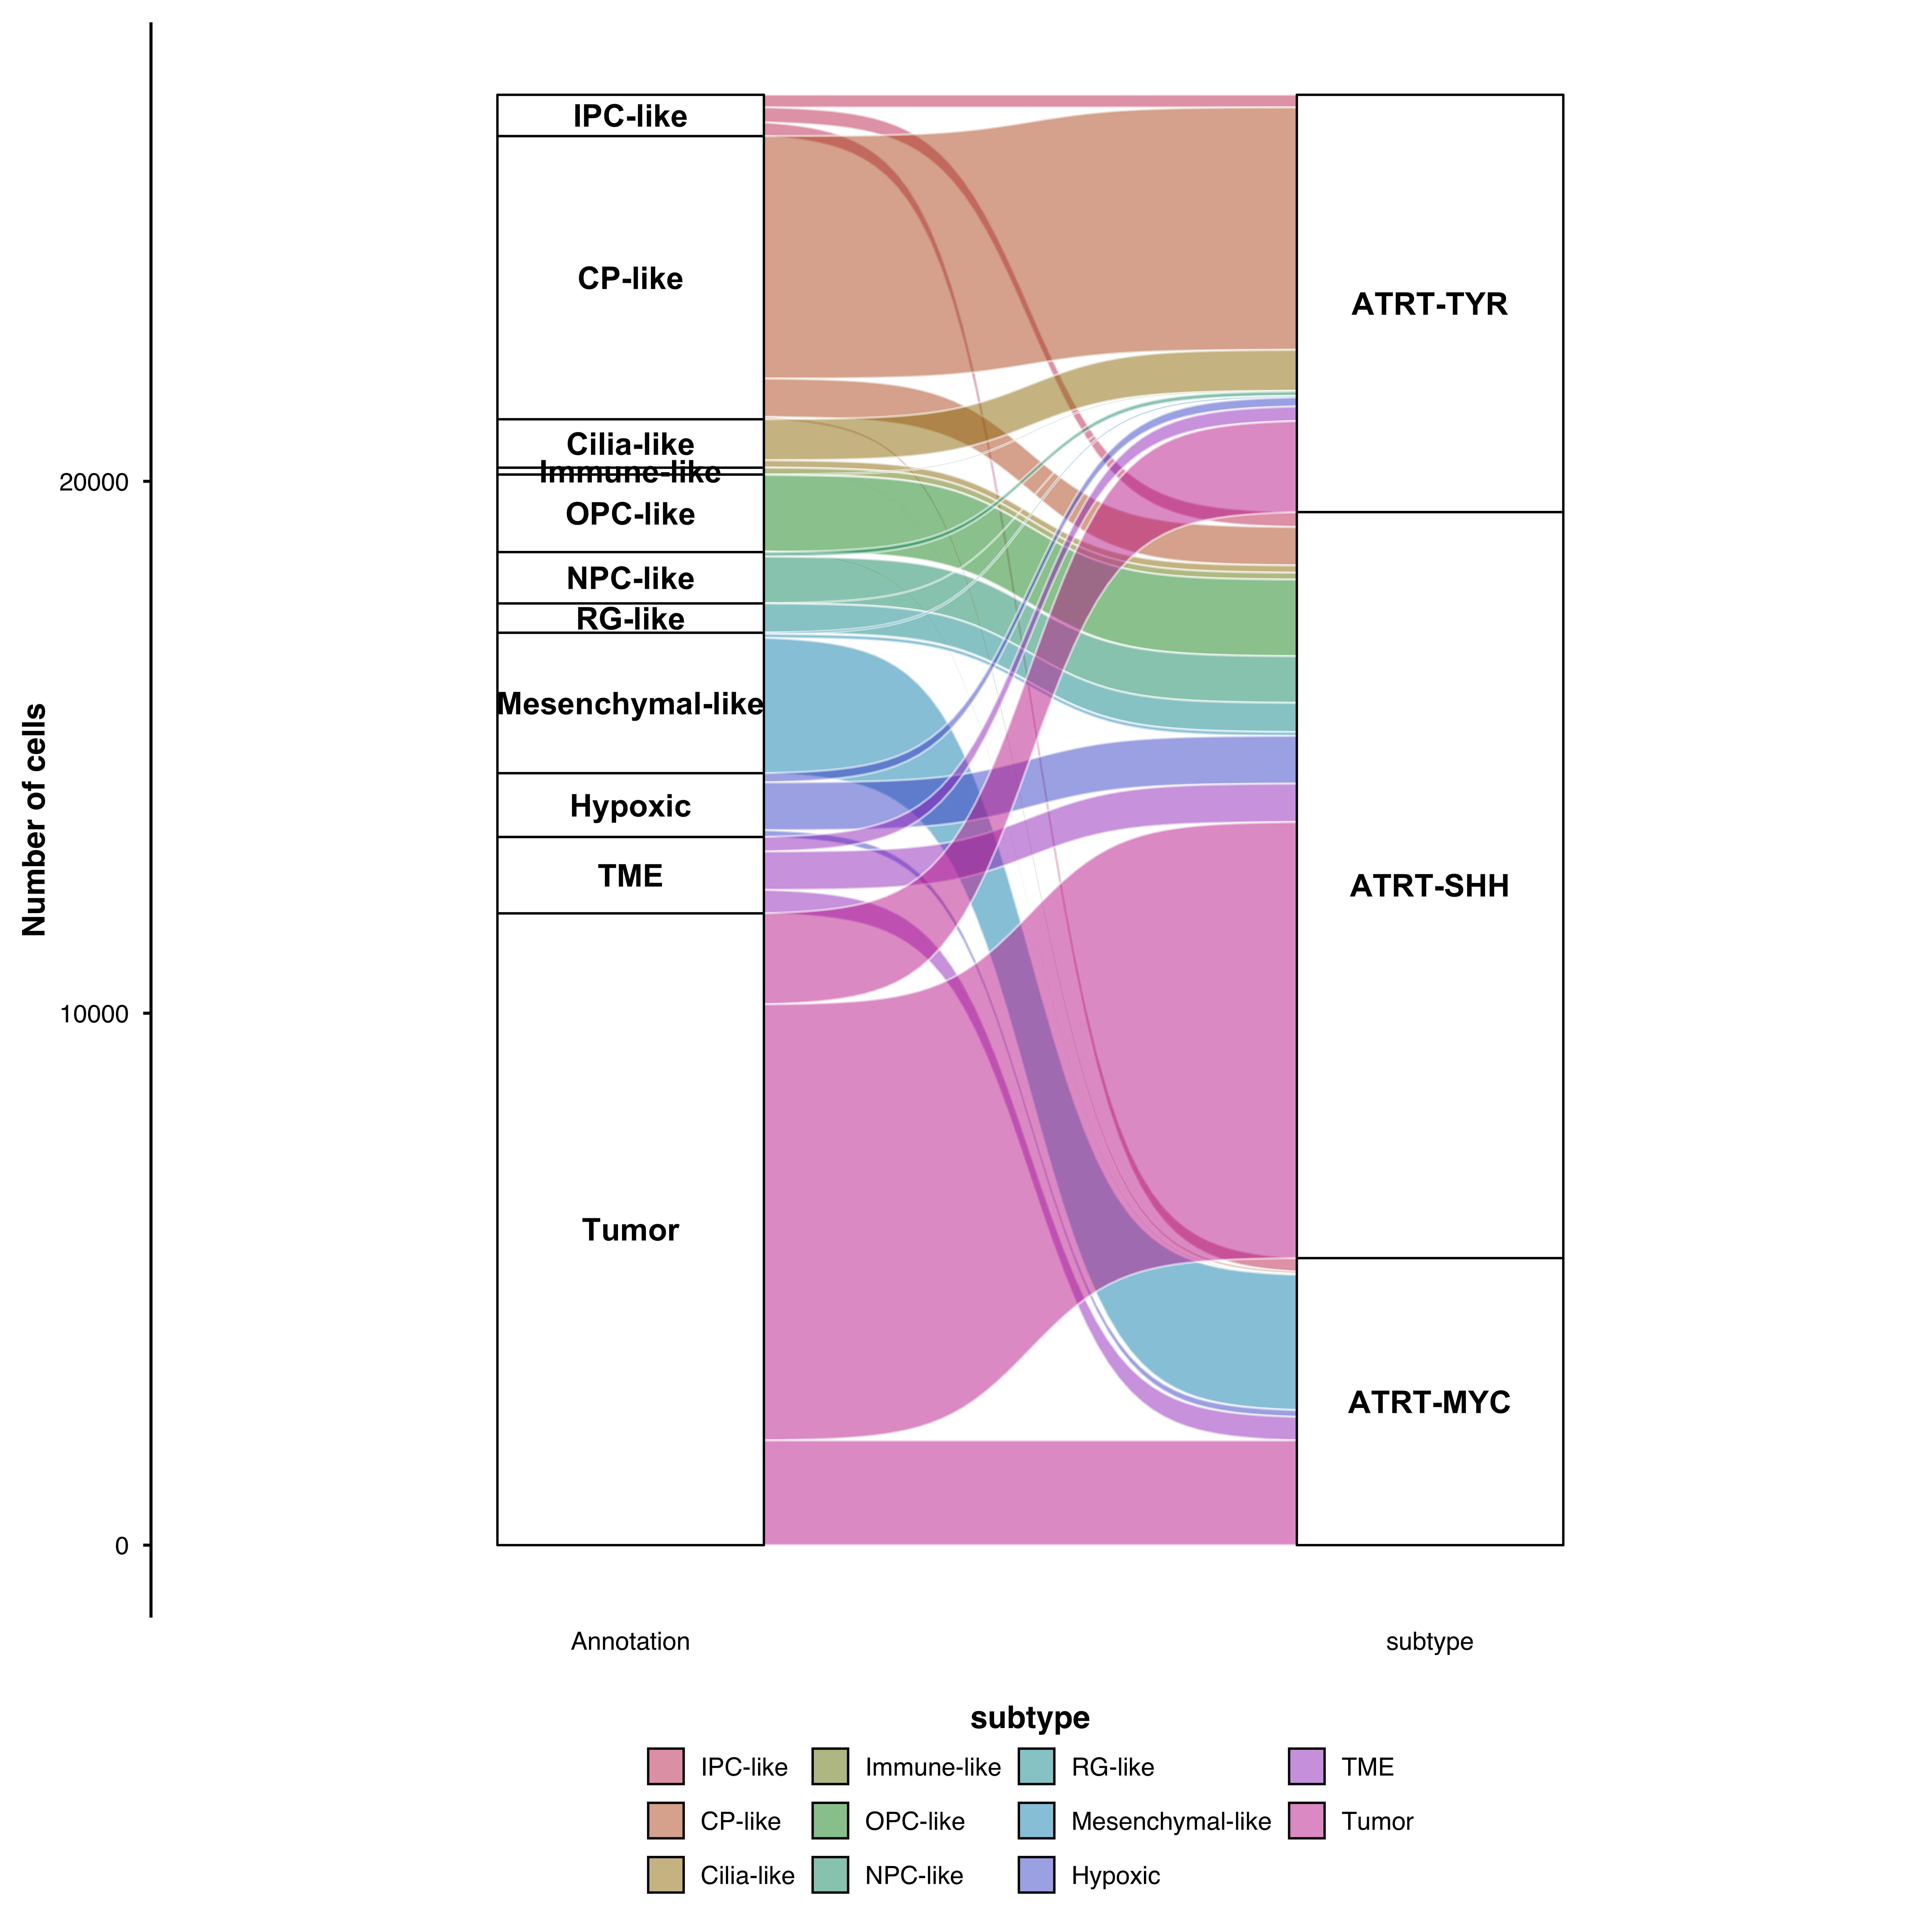
p <- SCpubr::do_AlluvialPlot(sample = sample,
                             first_group = "Annotation",
                             last_group = "subtype",
                             stratum.fill.conditional = TRUE)
p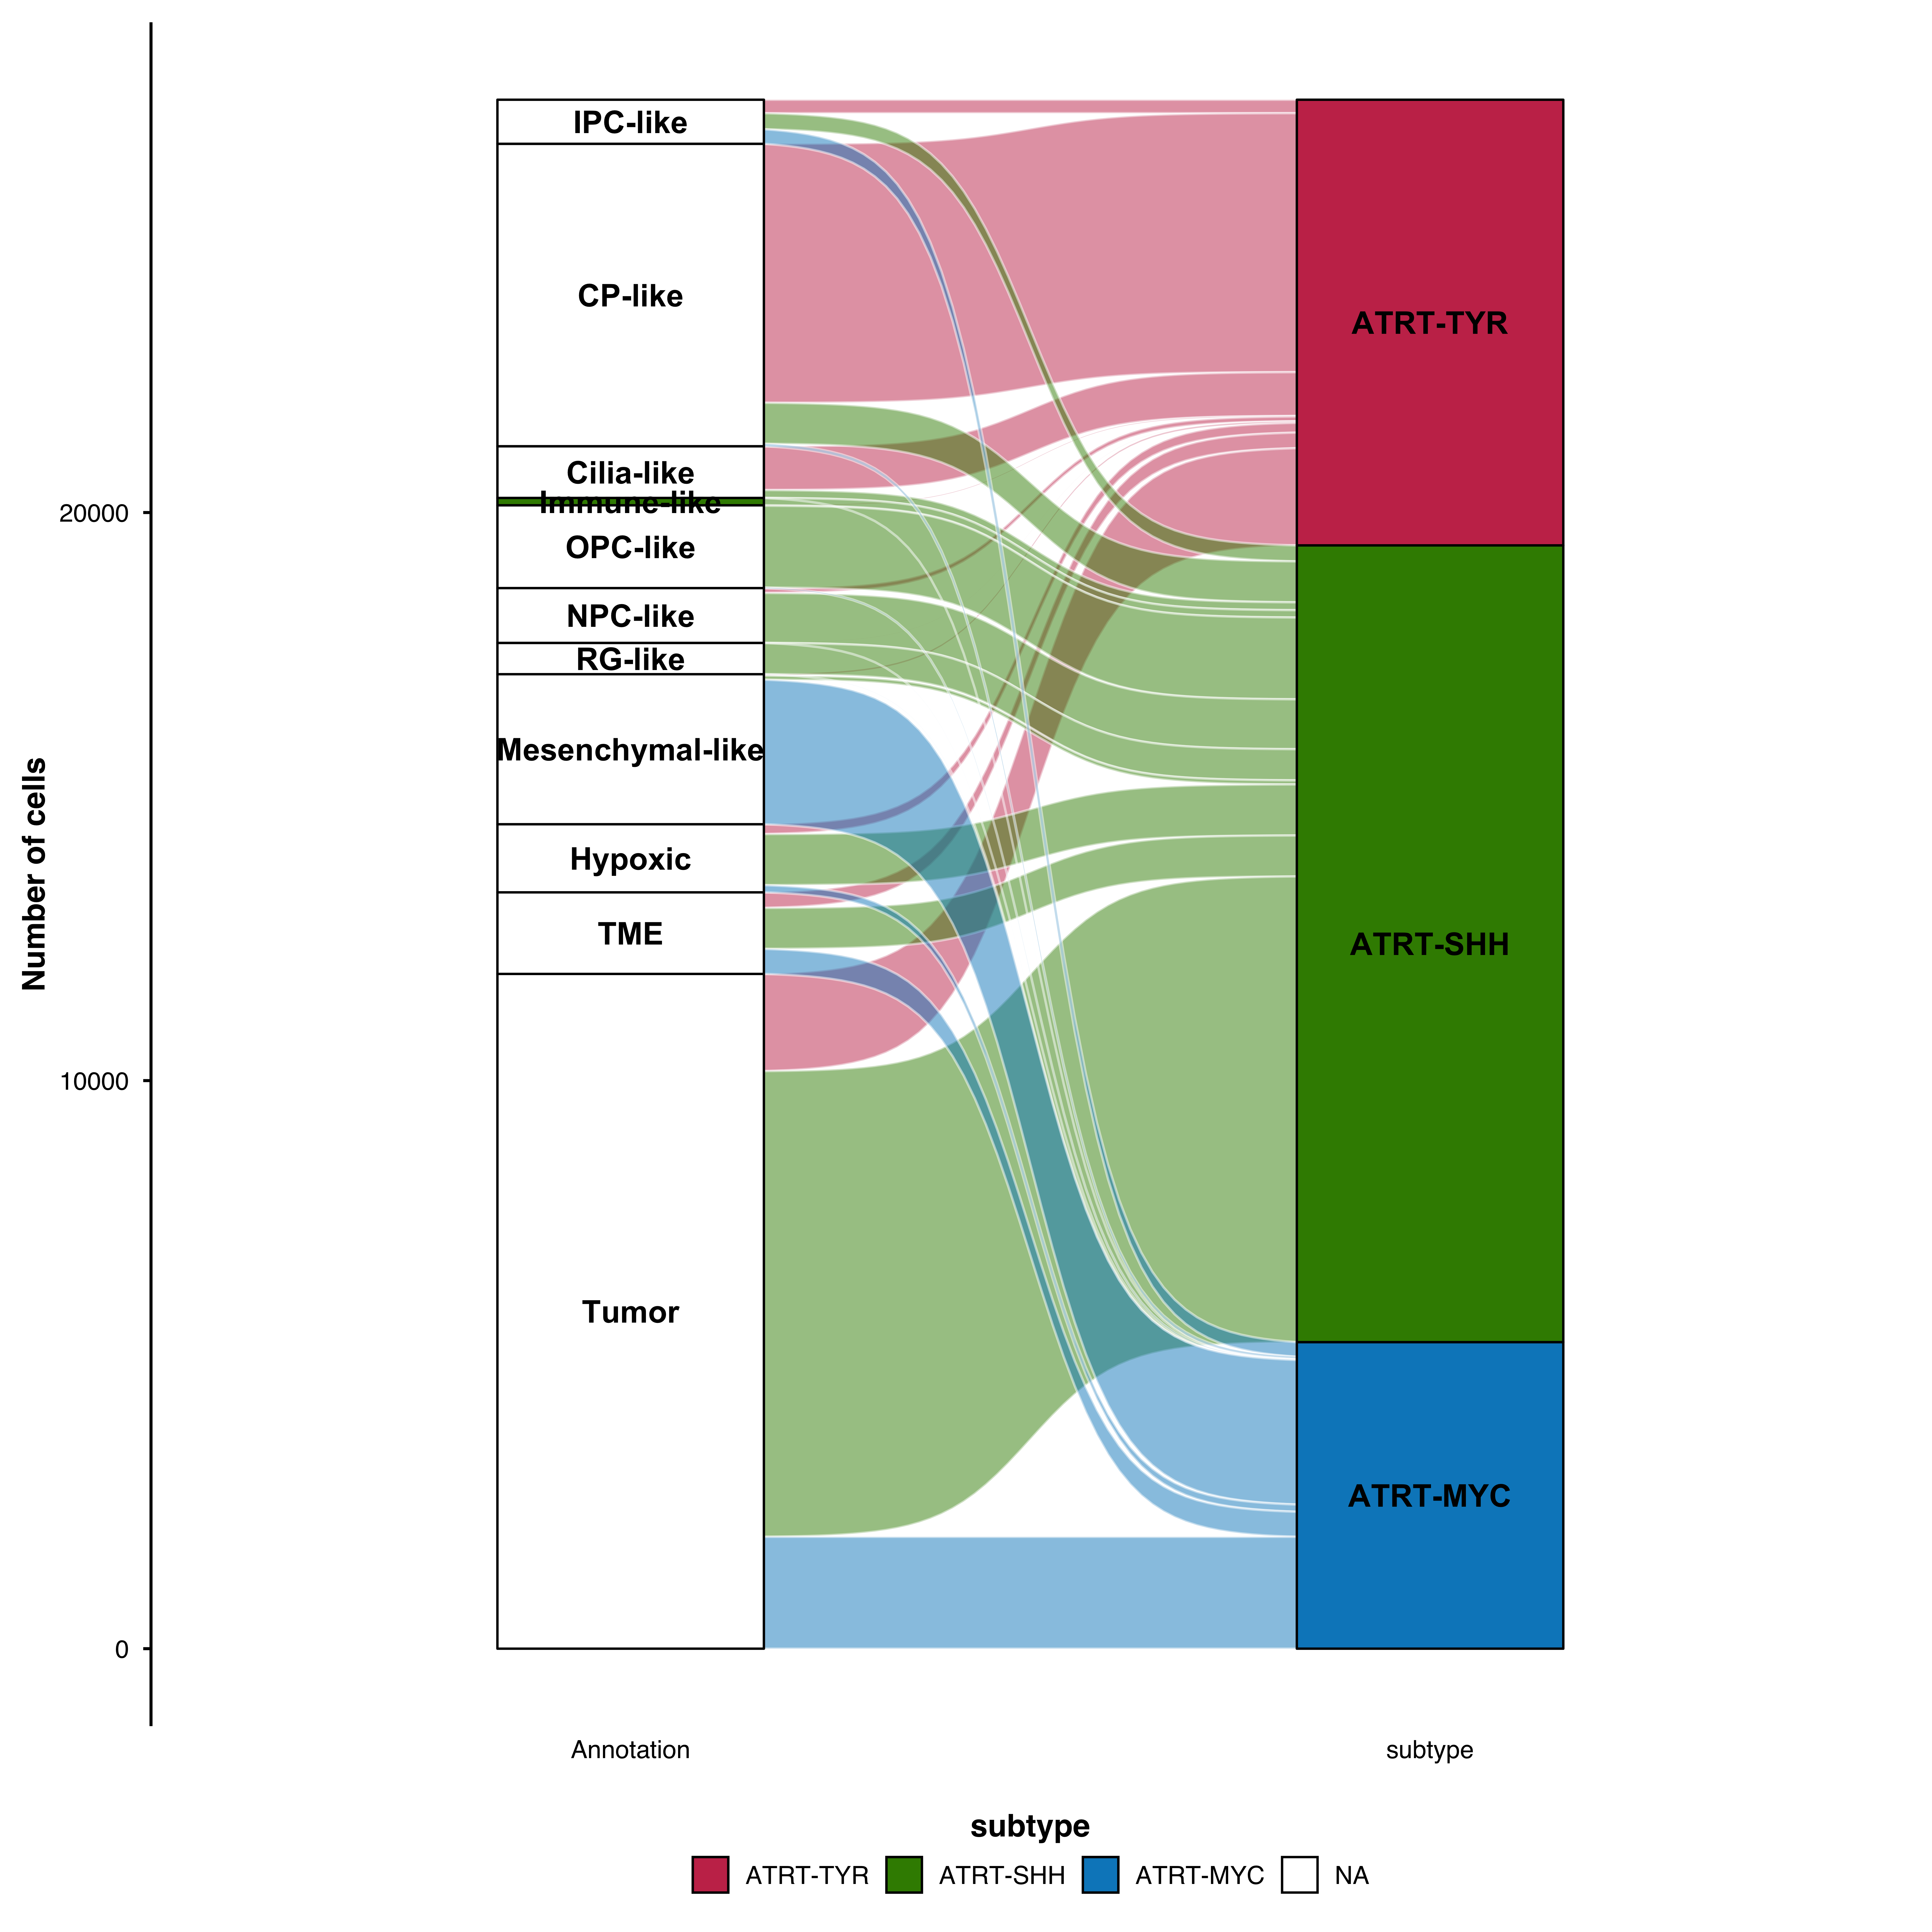
p <- SCpubr::do_AlluvialPlot(sample = sample,
                             first_group = "Annotation",
                             last_group = "subtype",
                             stratum.fill = "grey90",
                             stratum.color = "black",
                             stratum.width = 1/4)
p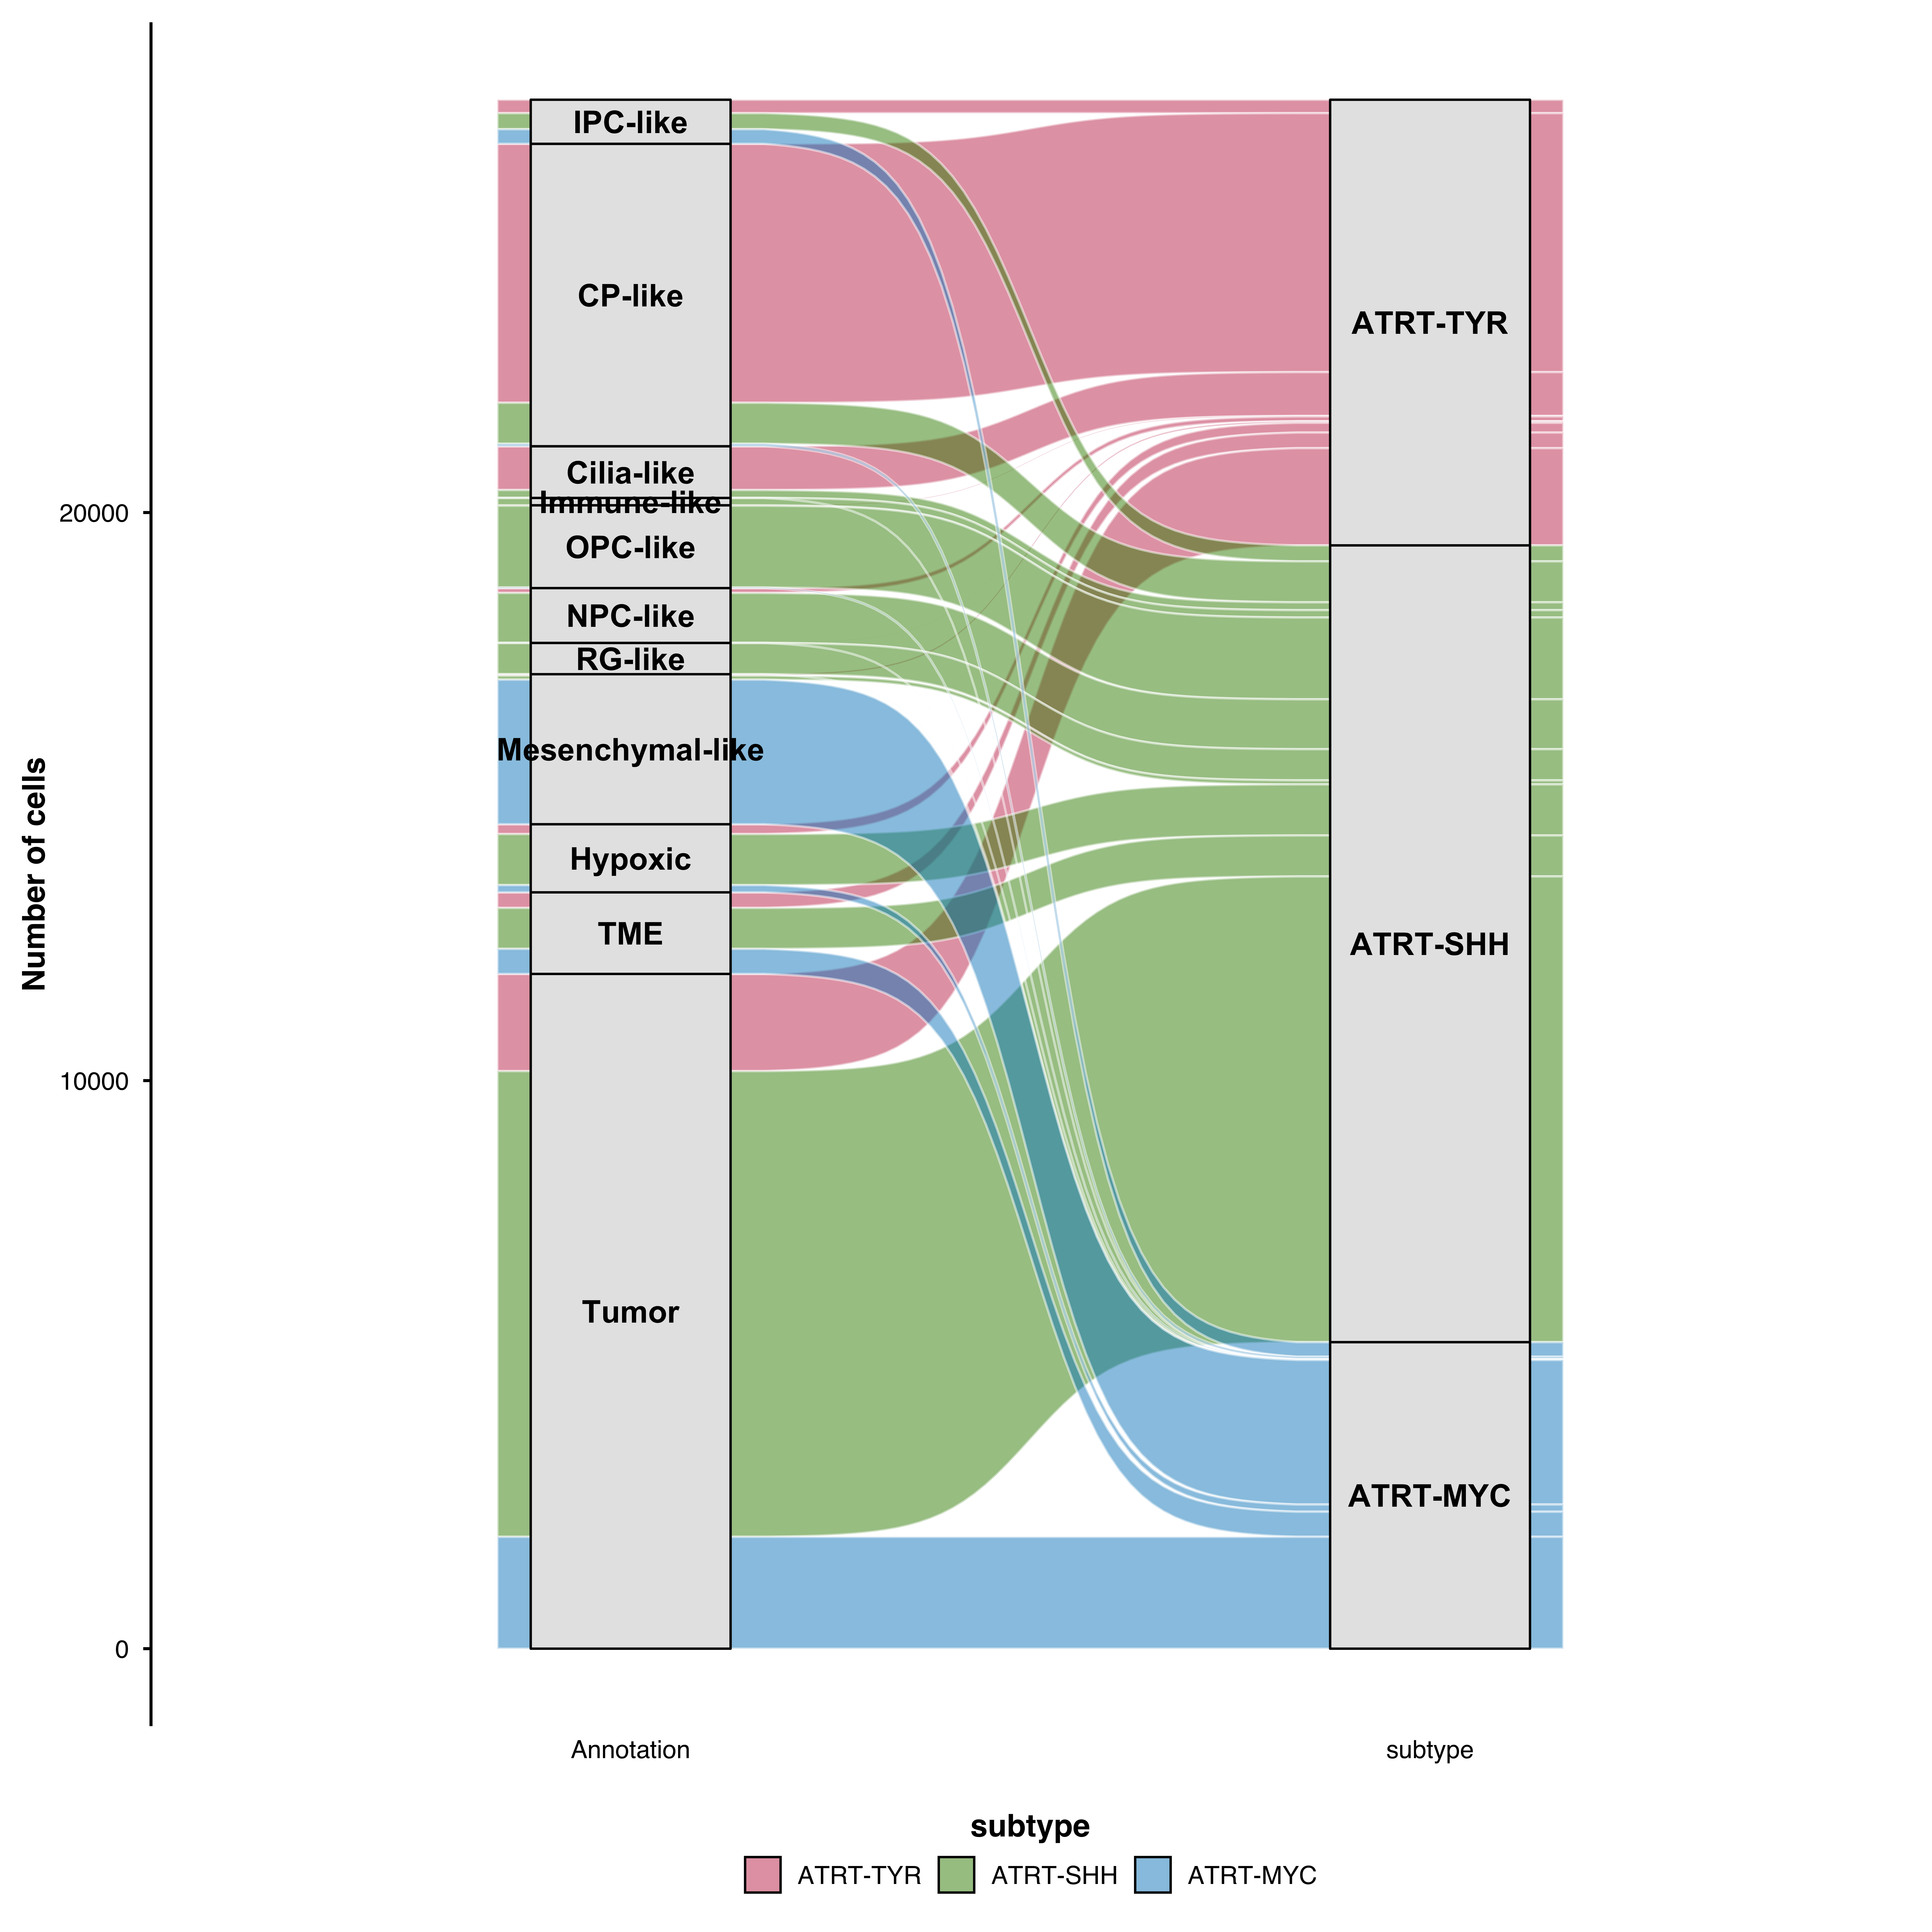
p <- SCpubr::do_AlluvialPlot(sample = sample,
                             first_group = "Annotation",
                             last_group = "subtype",
                             use_geom_flow = TRUE)
p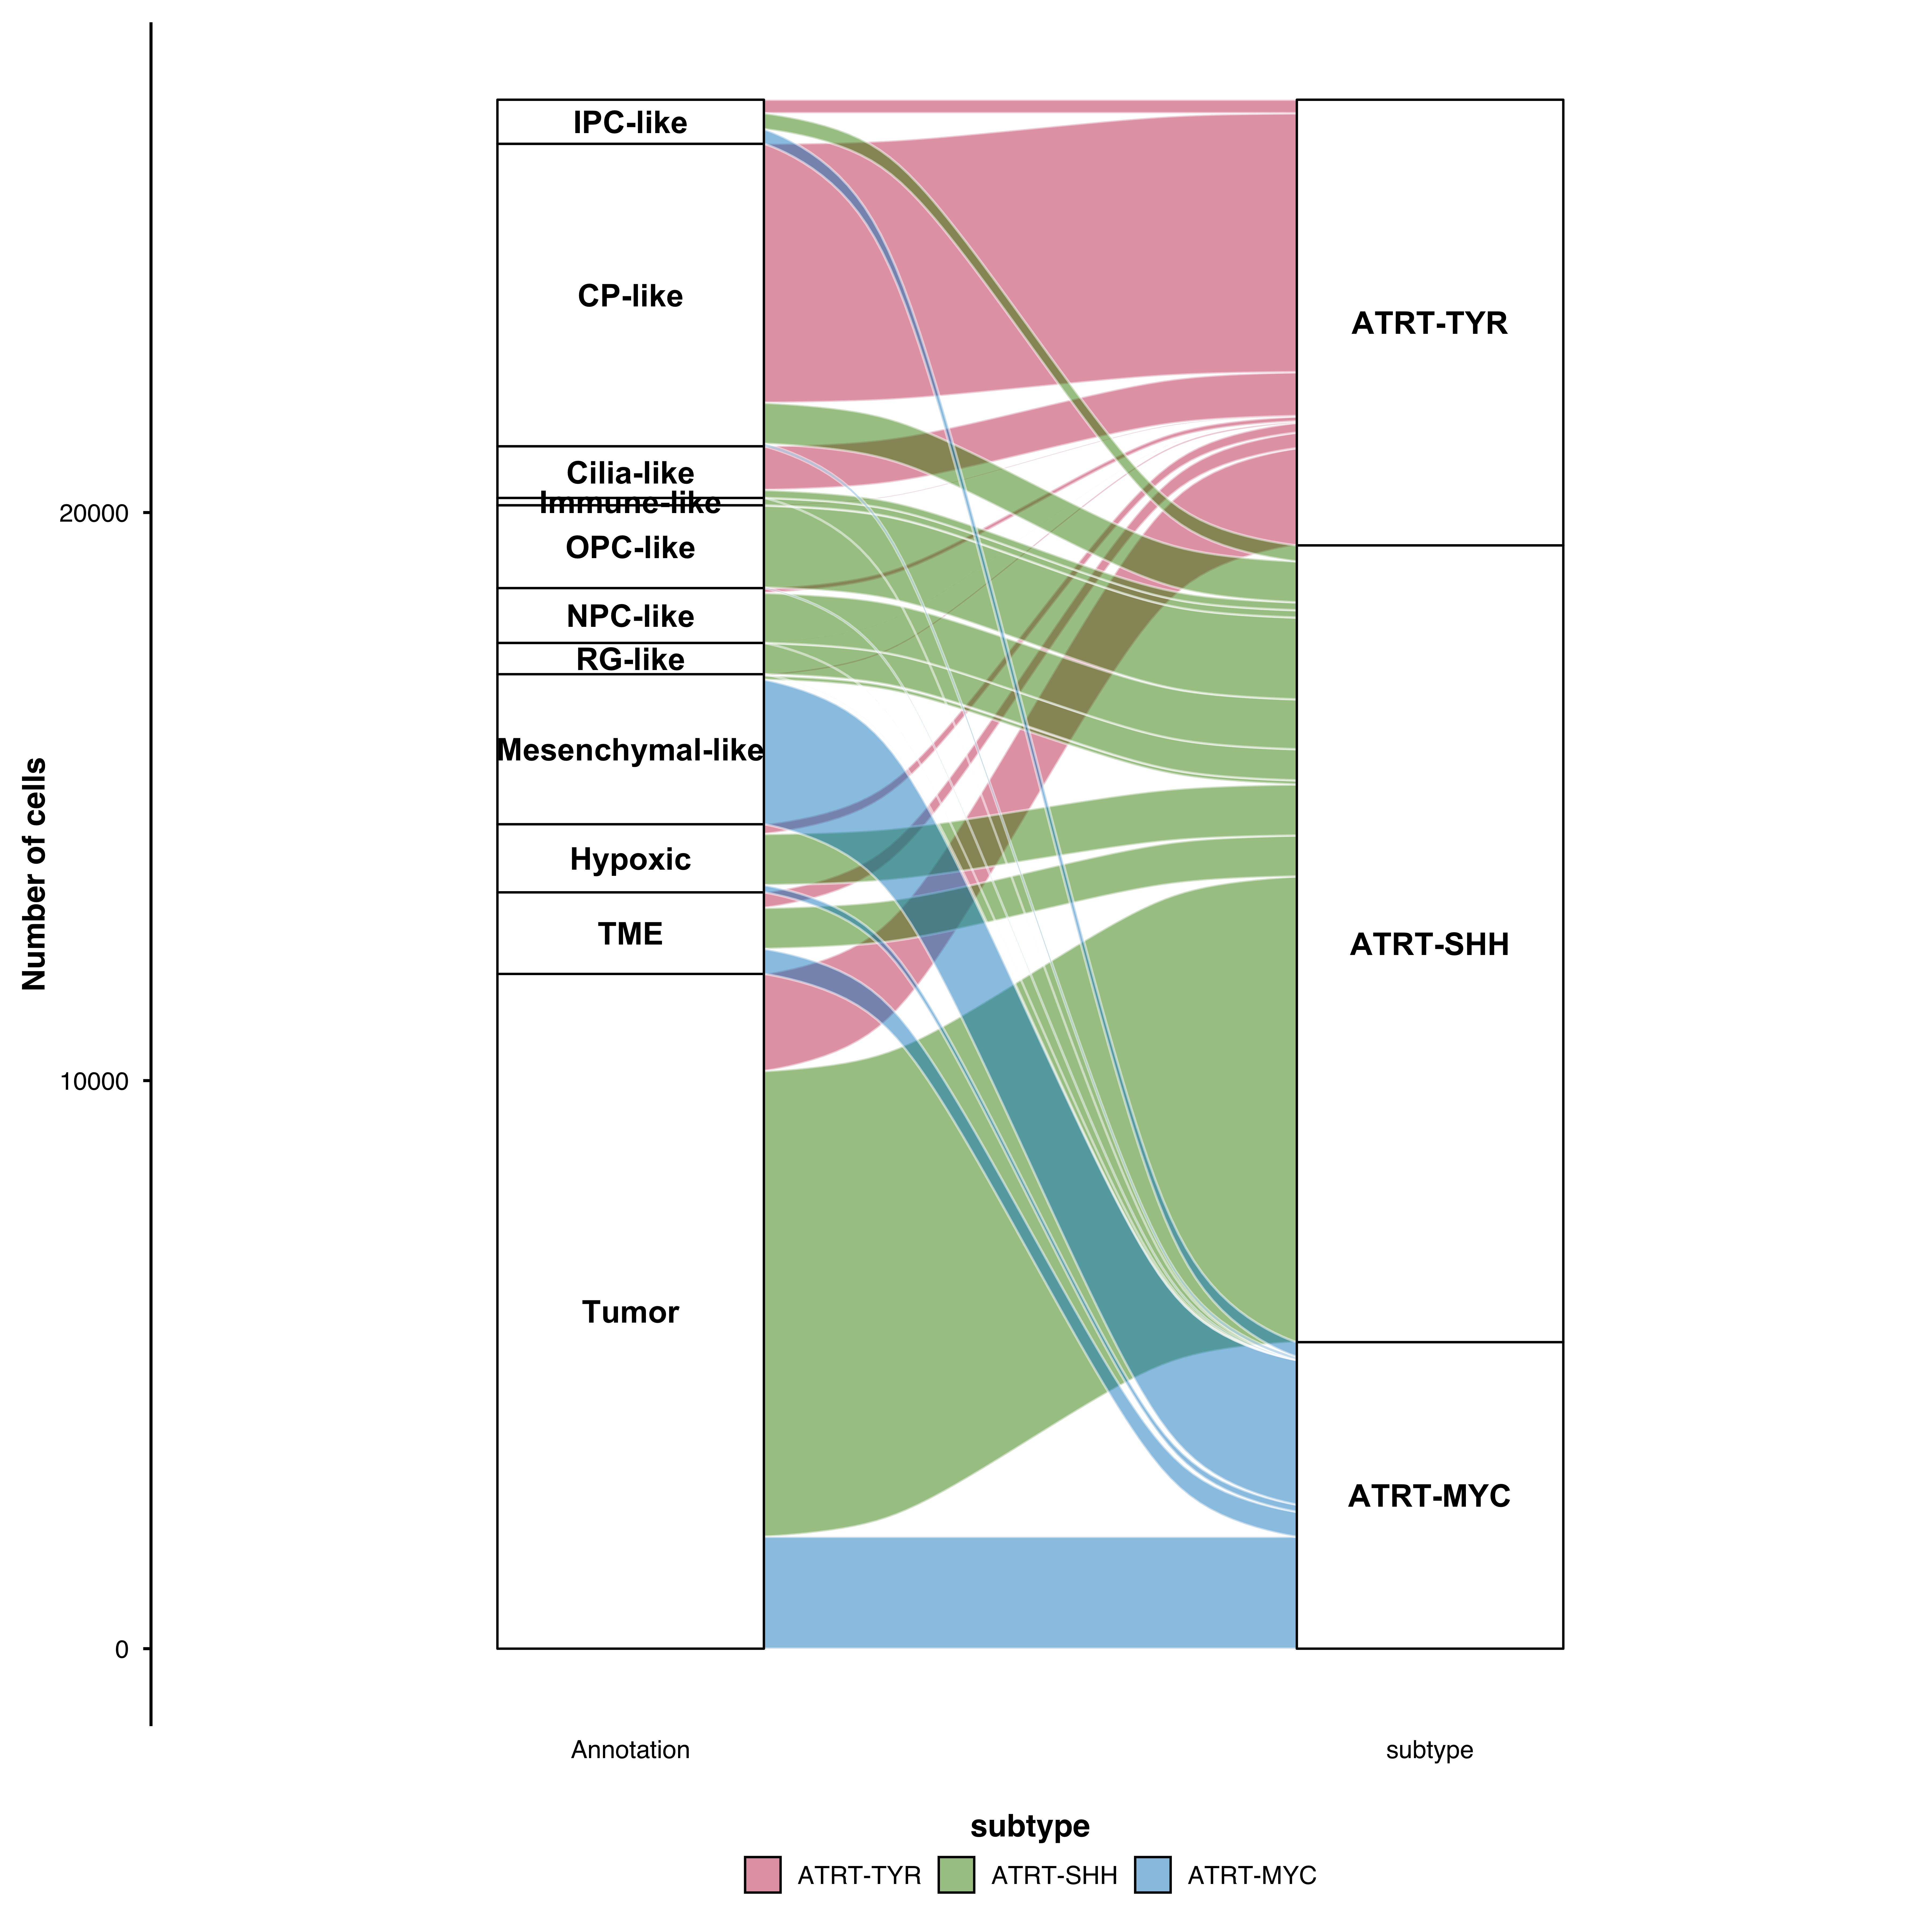
# Available: linear, cubic, quintic, sine, arctangent, sigmoid, xspline
p <- SCpubr::do_AlluvialPlot(sample = sample,
                             first_group = "Annotation",
                             last_group = "subtype",
                             curve_type = "xspline")
p
Replace stratum boxes with text labels:
p <- SCpubr::do_AlluvialPlot(sample = sample,
                             first_group = "Annotation",
                             last_group = "subtype",
                             use_labels = TRUE,
                             repel = TRUE)
p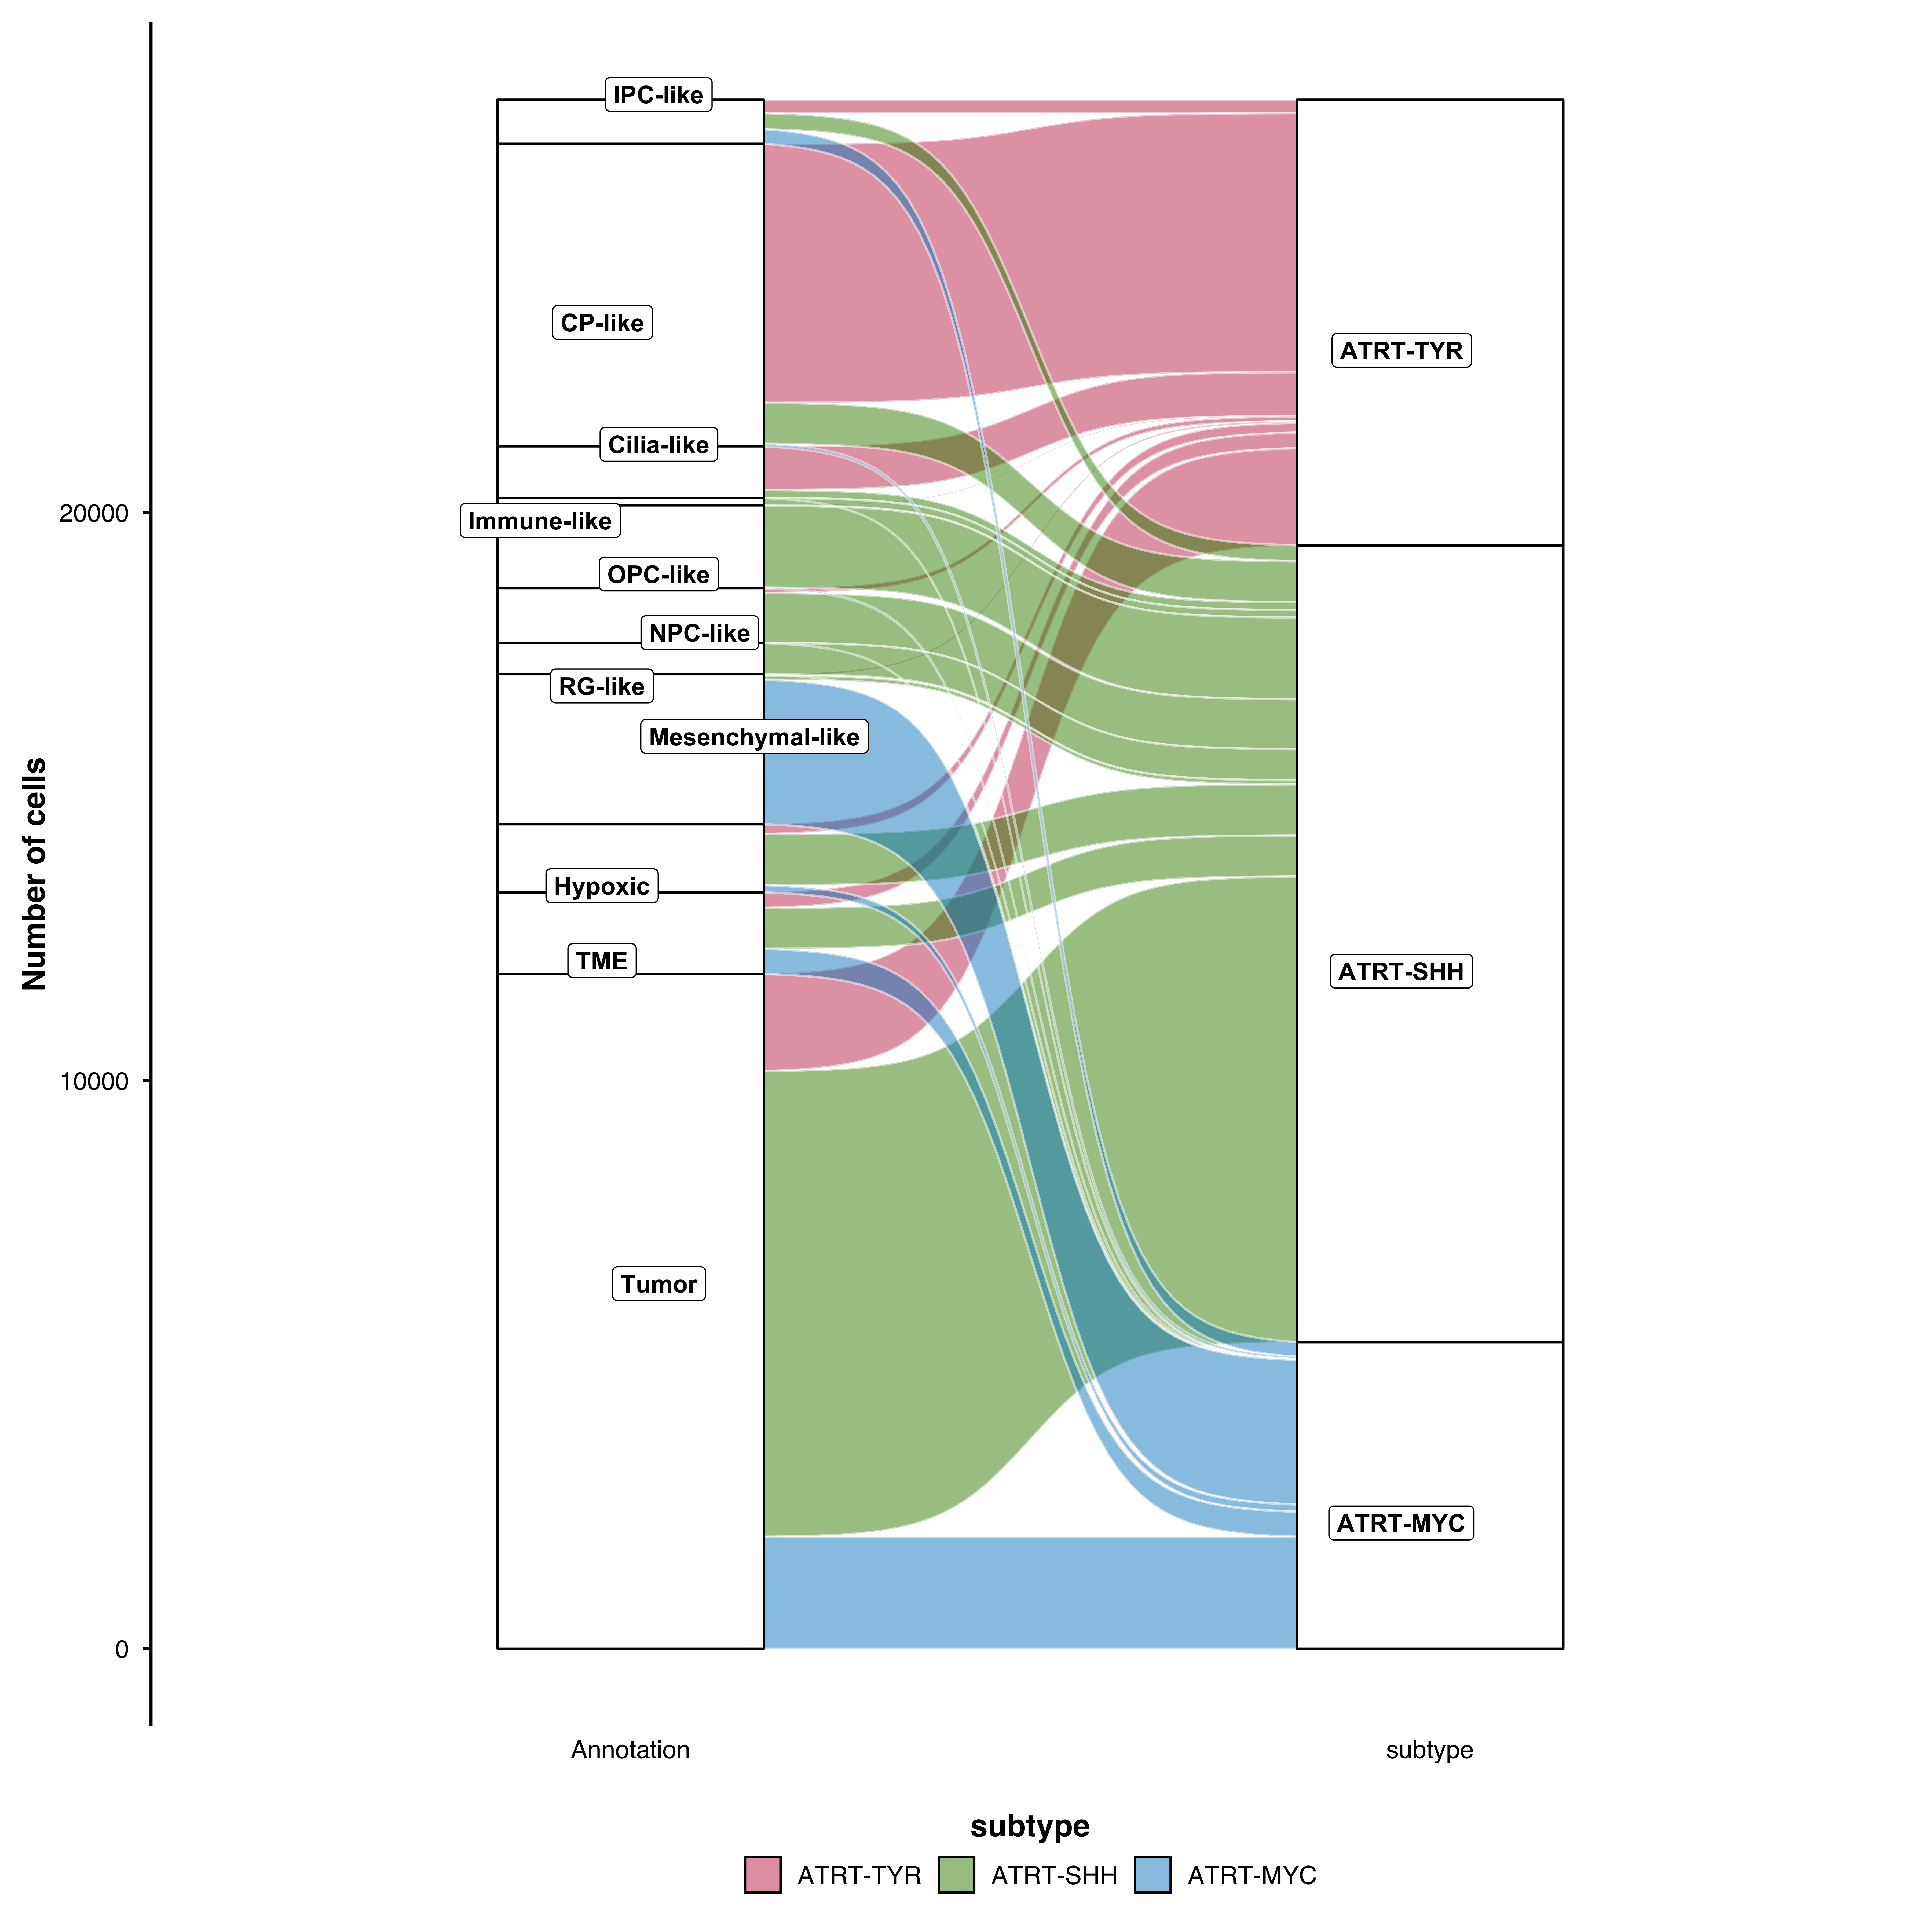
For parameters shared across many functions (color palettes, typography, legend styling), see Shared features.
| Parameter | Description | Default |
|---|---|---|
first_group |
Starting categorical variable | — |
last_group |
Ending categorical variable | — |
middle_groups |
Intermediate variables | NULL |
fill.by |
Variable to color flows by | last_group |
| Parameter | Description | Default |
|---|---|---|
stratum.fill |
Stratum fill color | "white" |
stratum.color |
Stratum border color | "black" |
stratum.width |
Stratum width | 1/3 |
stratum.fill.conditional |
Match stratum to flow color | FALSE |
| Parameter | Description | Default |
|---|---|---|
use_geom_flow |
Use alternative flow rendering | FALSE |
alluvium.color |
Flow border color | "white" |
curve_type |
Curve shape | "sigmoid" |
| Parameter | Description | Default |
|---|---|---|
use_labels |
Show text labels instead of boxes | FALSE |
repel |
Repel overlapping labels | FALSE |
label.color |
Label text color | "black" |