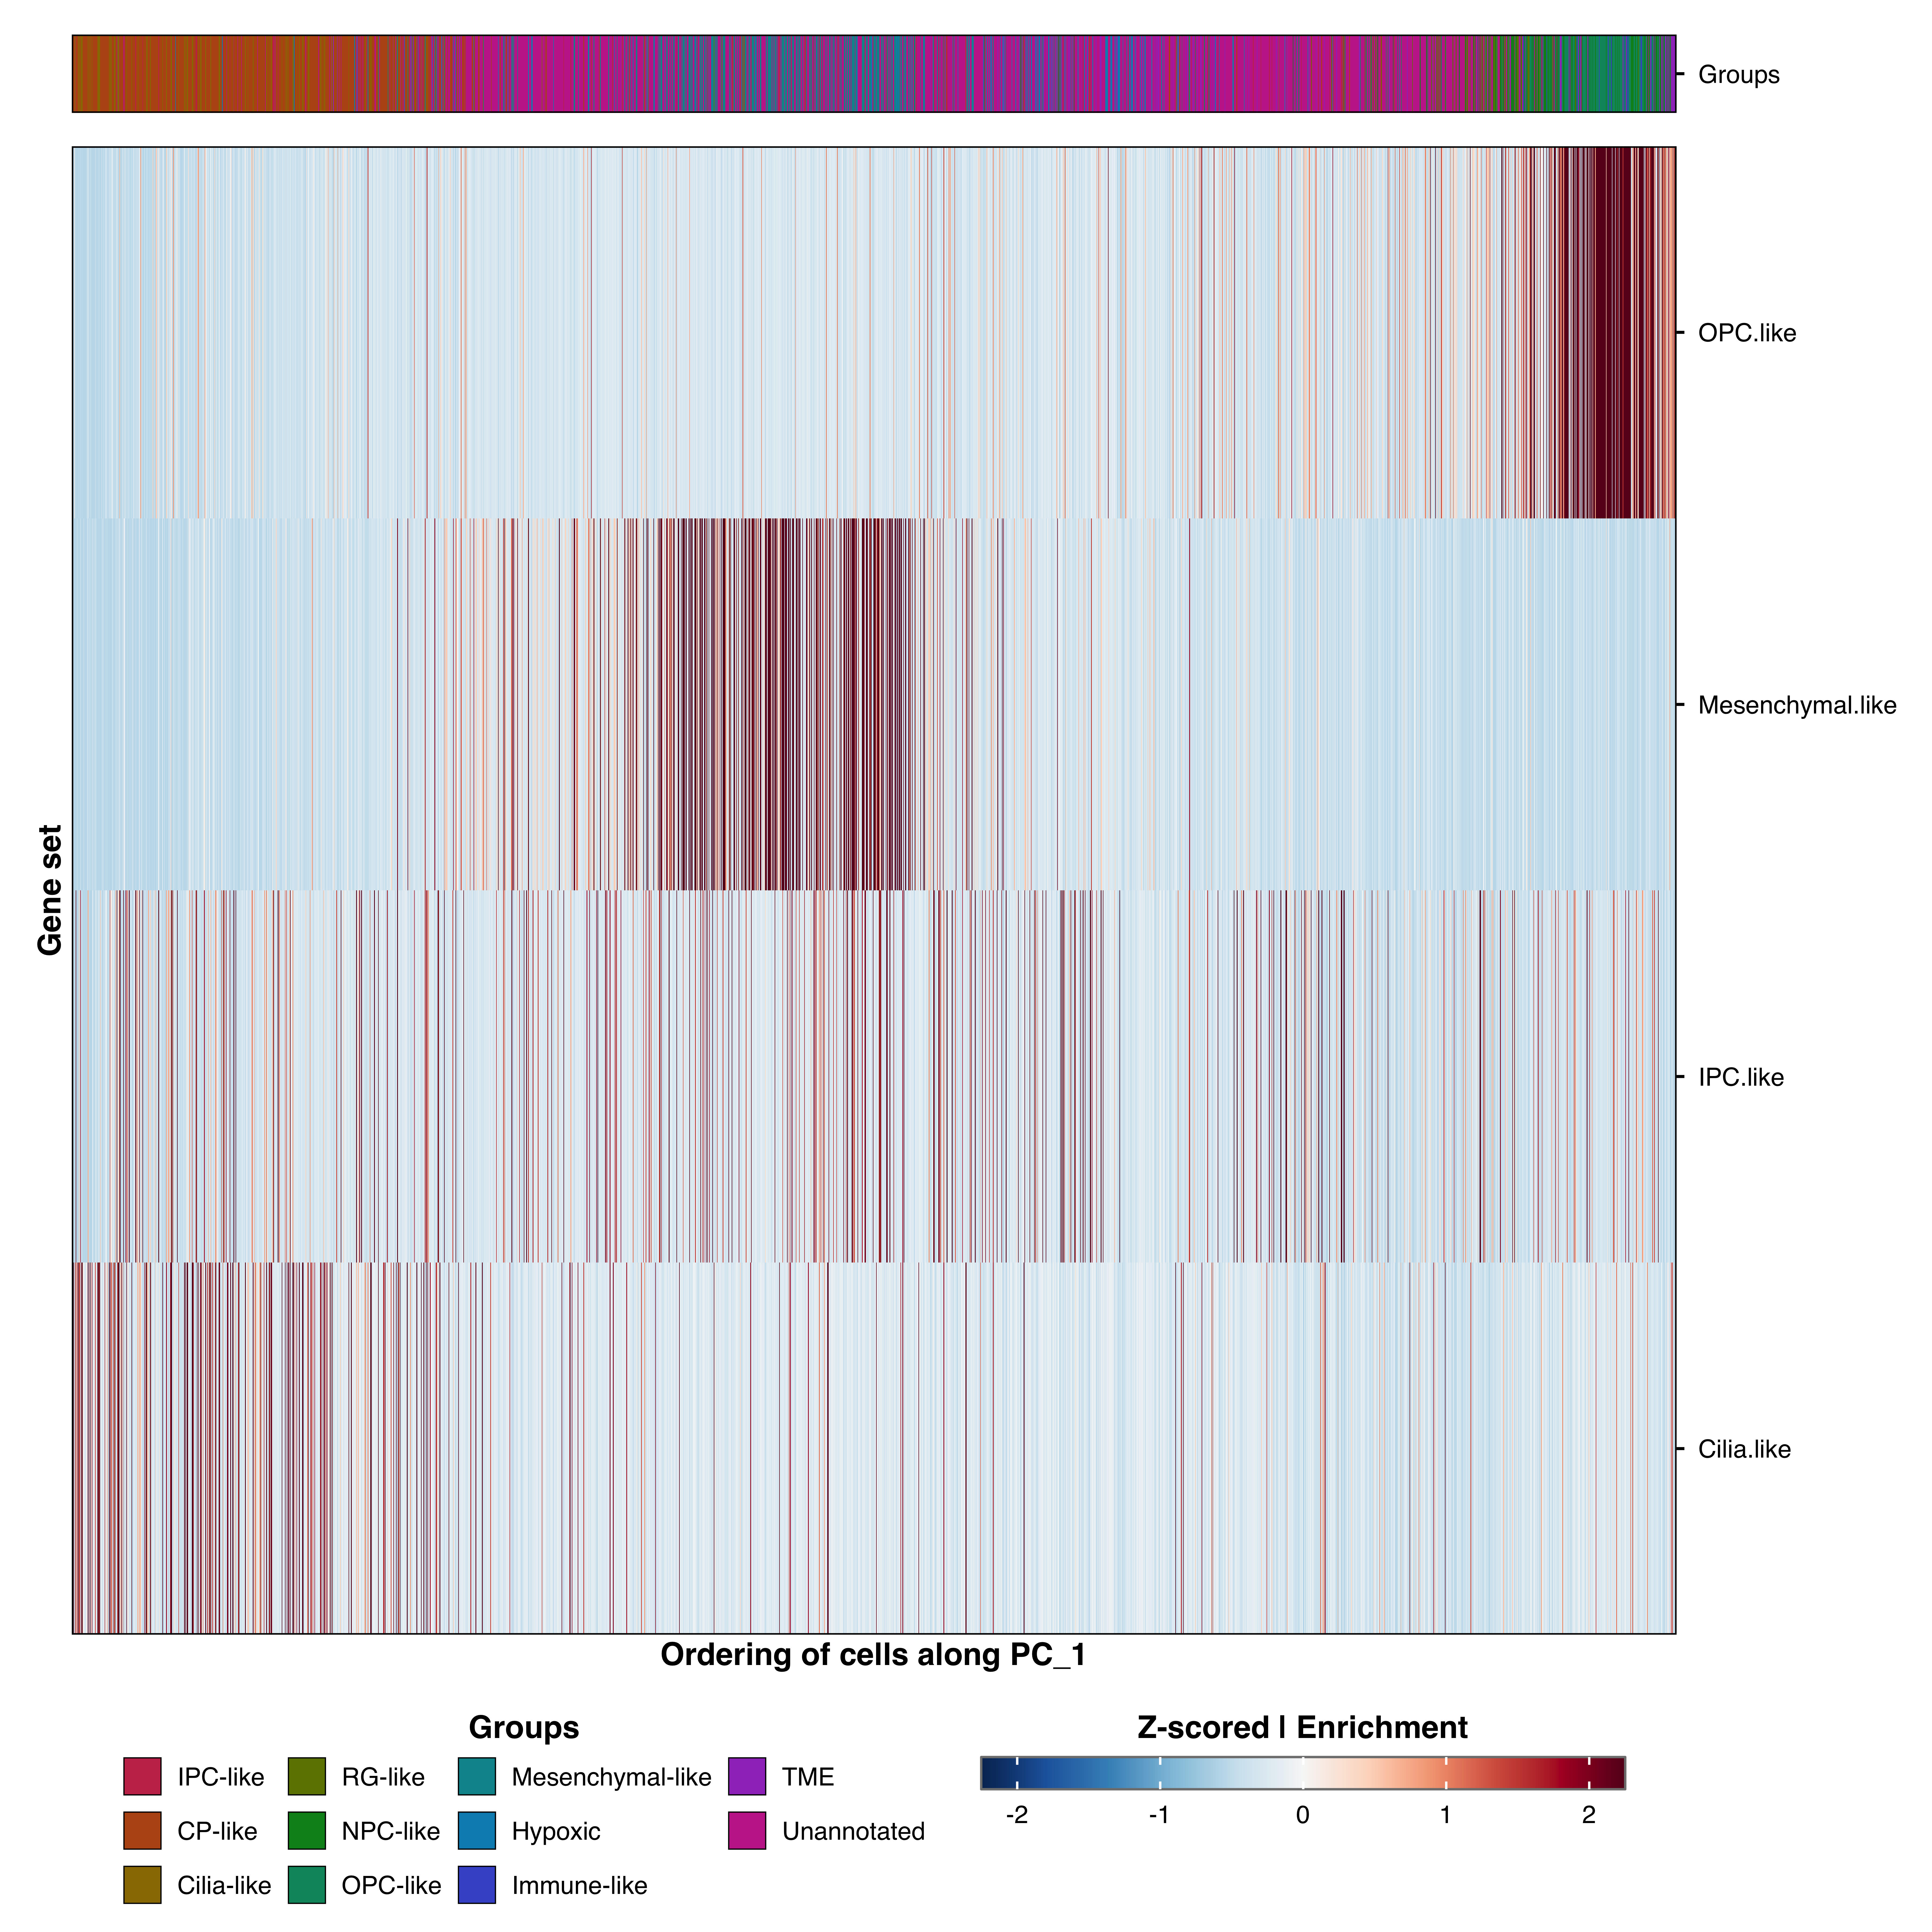
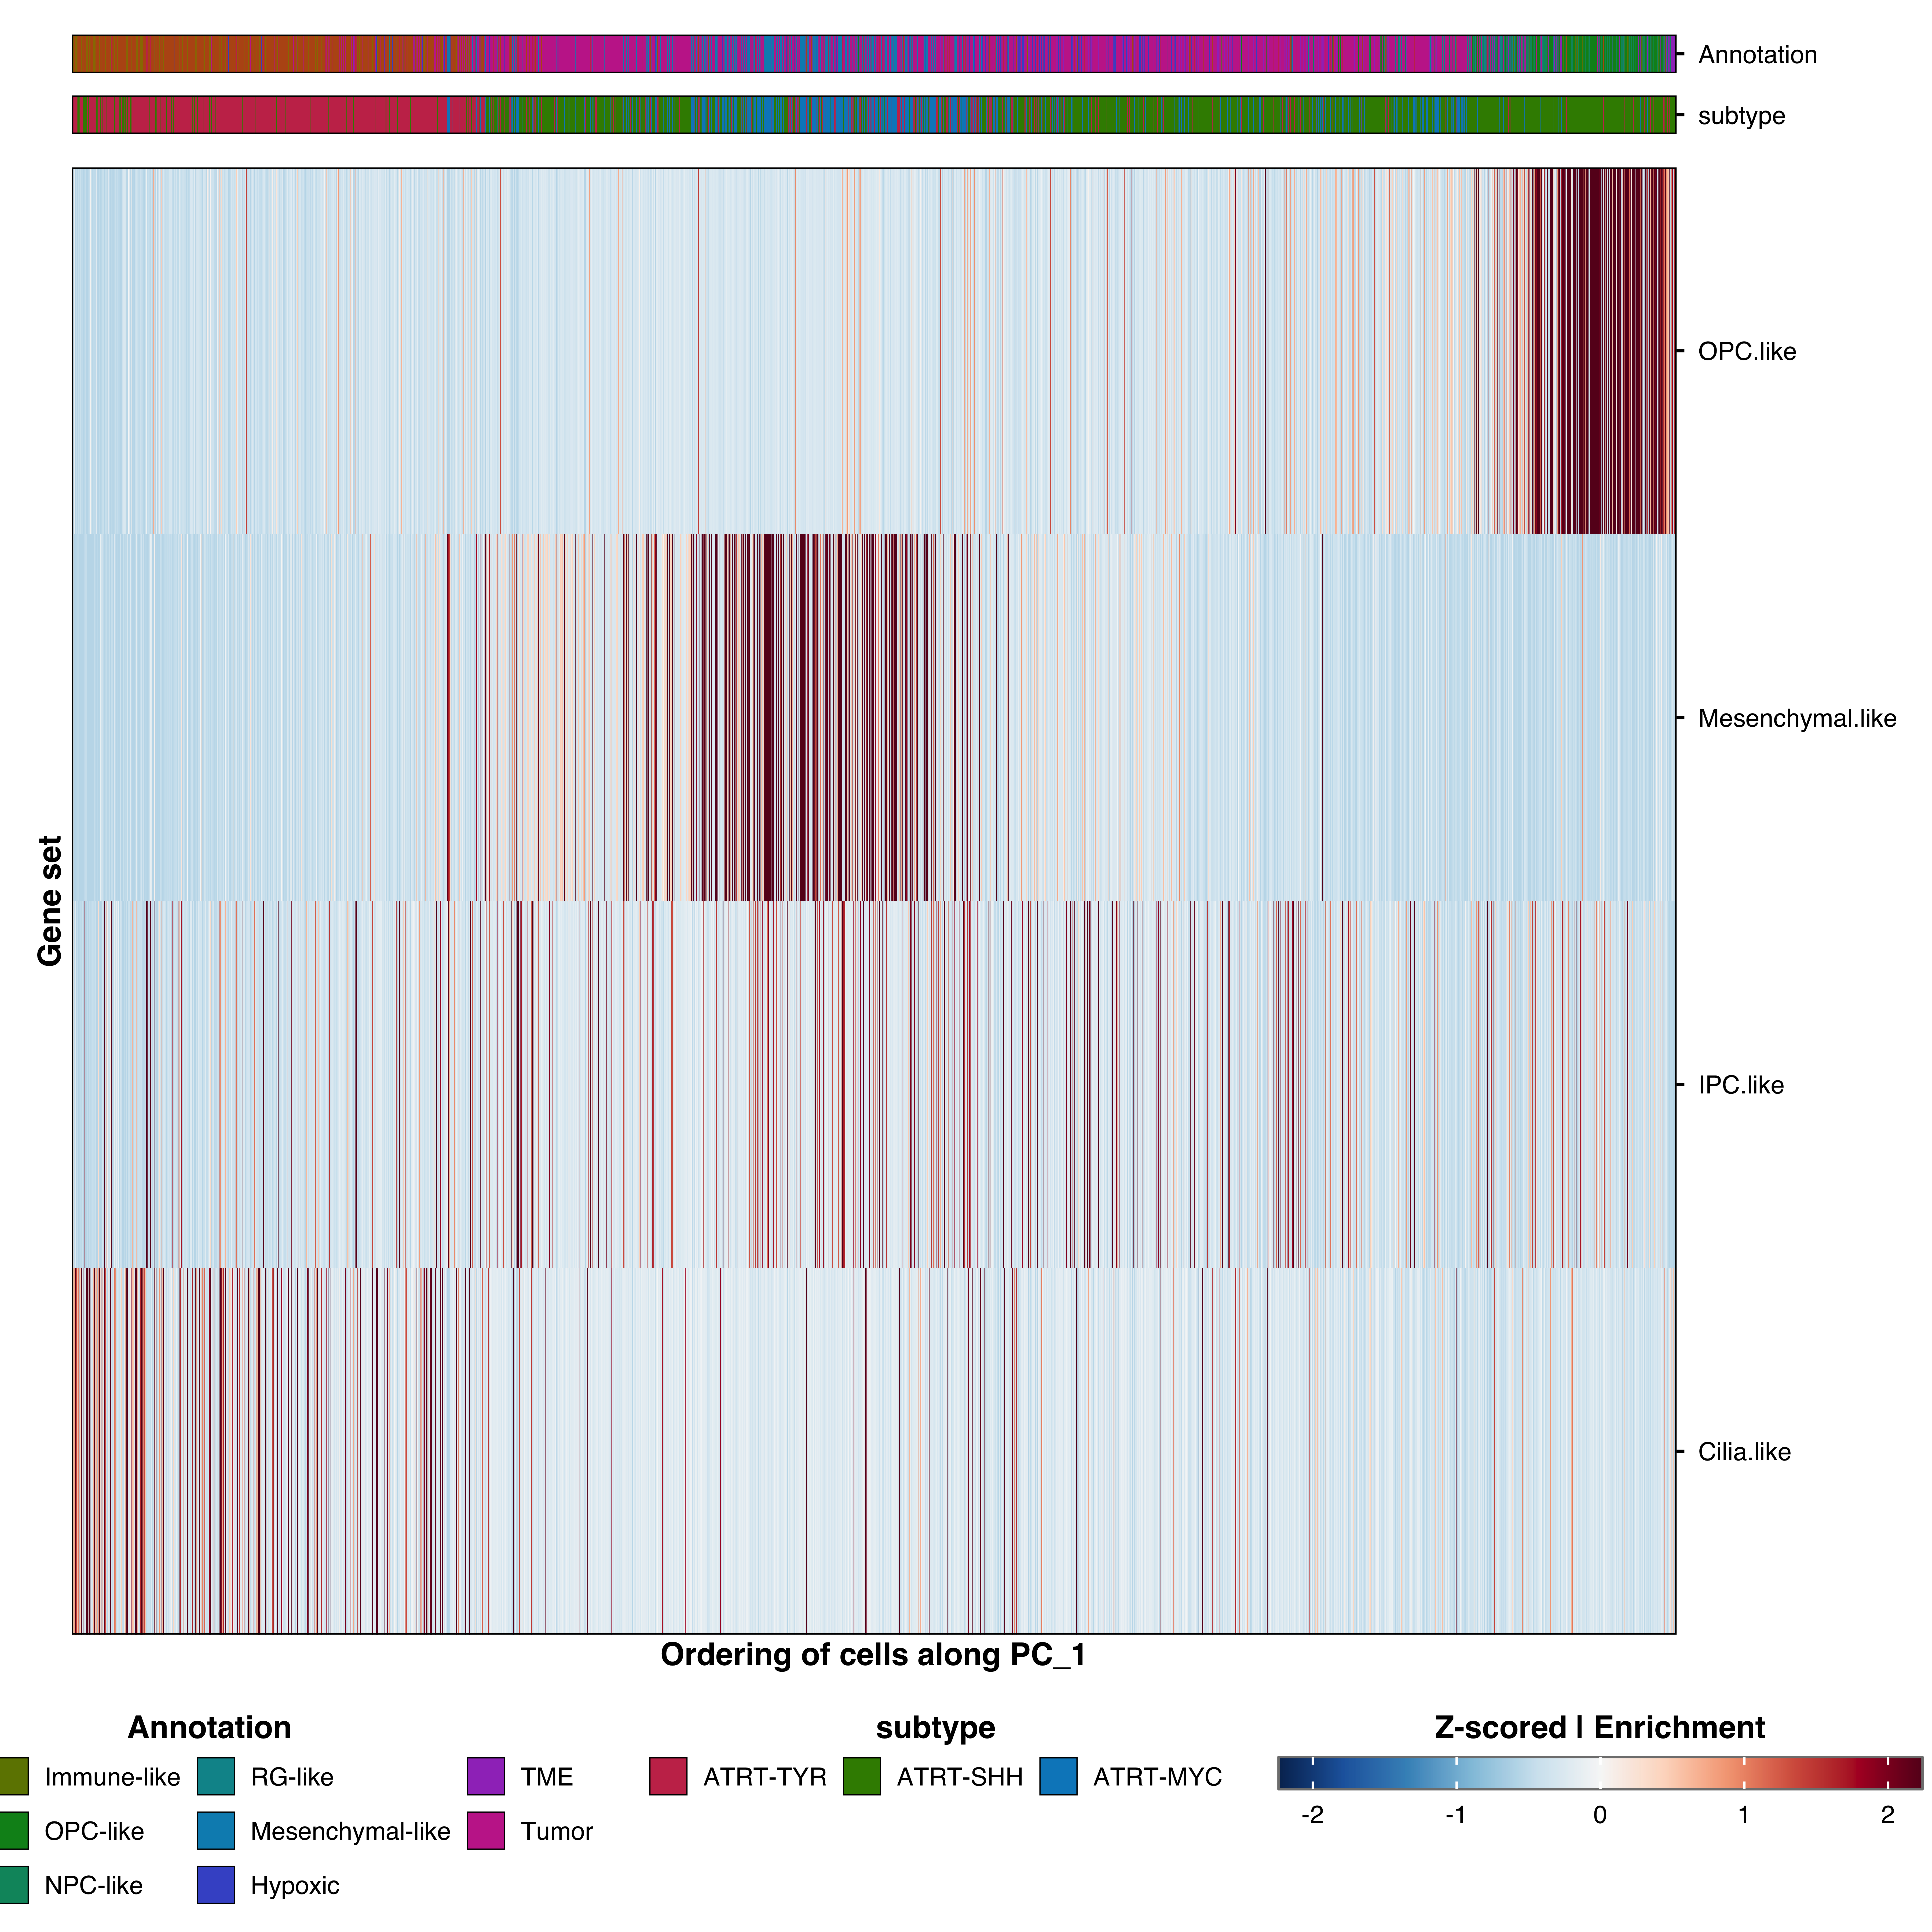
Ranked enrichment heatmaps display gene set enrichment scores ordered by a dimensional reduction component . Cells are ranked along a PC or trajectory, revealing how enrichment scores vary along continuous gradients.
Basic usage
gene_lists <- list ( "IPC.like" = c ( "CDC25C" , "KIF18B" , "KIF14" , "CENPE" ) ,
"Cilia.like" = c ( "DNAAF1" , "ADGB" , "CFAP61" , "CFAP157" ) ,
"OPC.like" = c ( "KCNQ5" , "MEOX2" , "MBP" , "SNTG1" ) ,
"Mesenchymal.like" = c ( "S100A1" , "MGP" , "TNNT1" , "H2AFJ" )
) p <- SCpubr :: do_RankedEnrichmentHeatmap ( sample = sample , input_gene_list = gene_lists ,
reduction = "pca" ,
dims = 1 )
p #> $PC_1
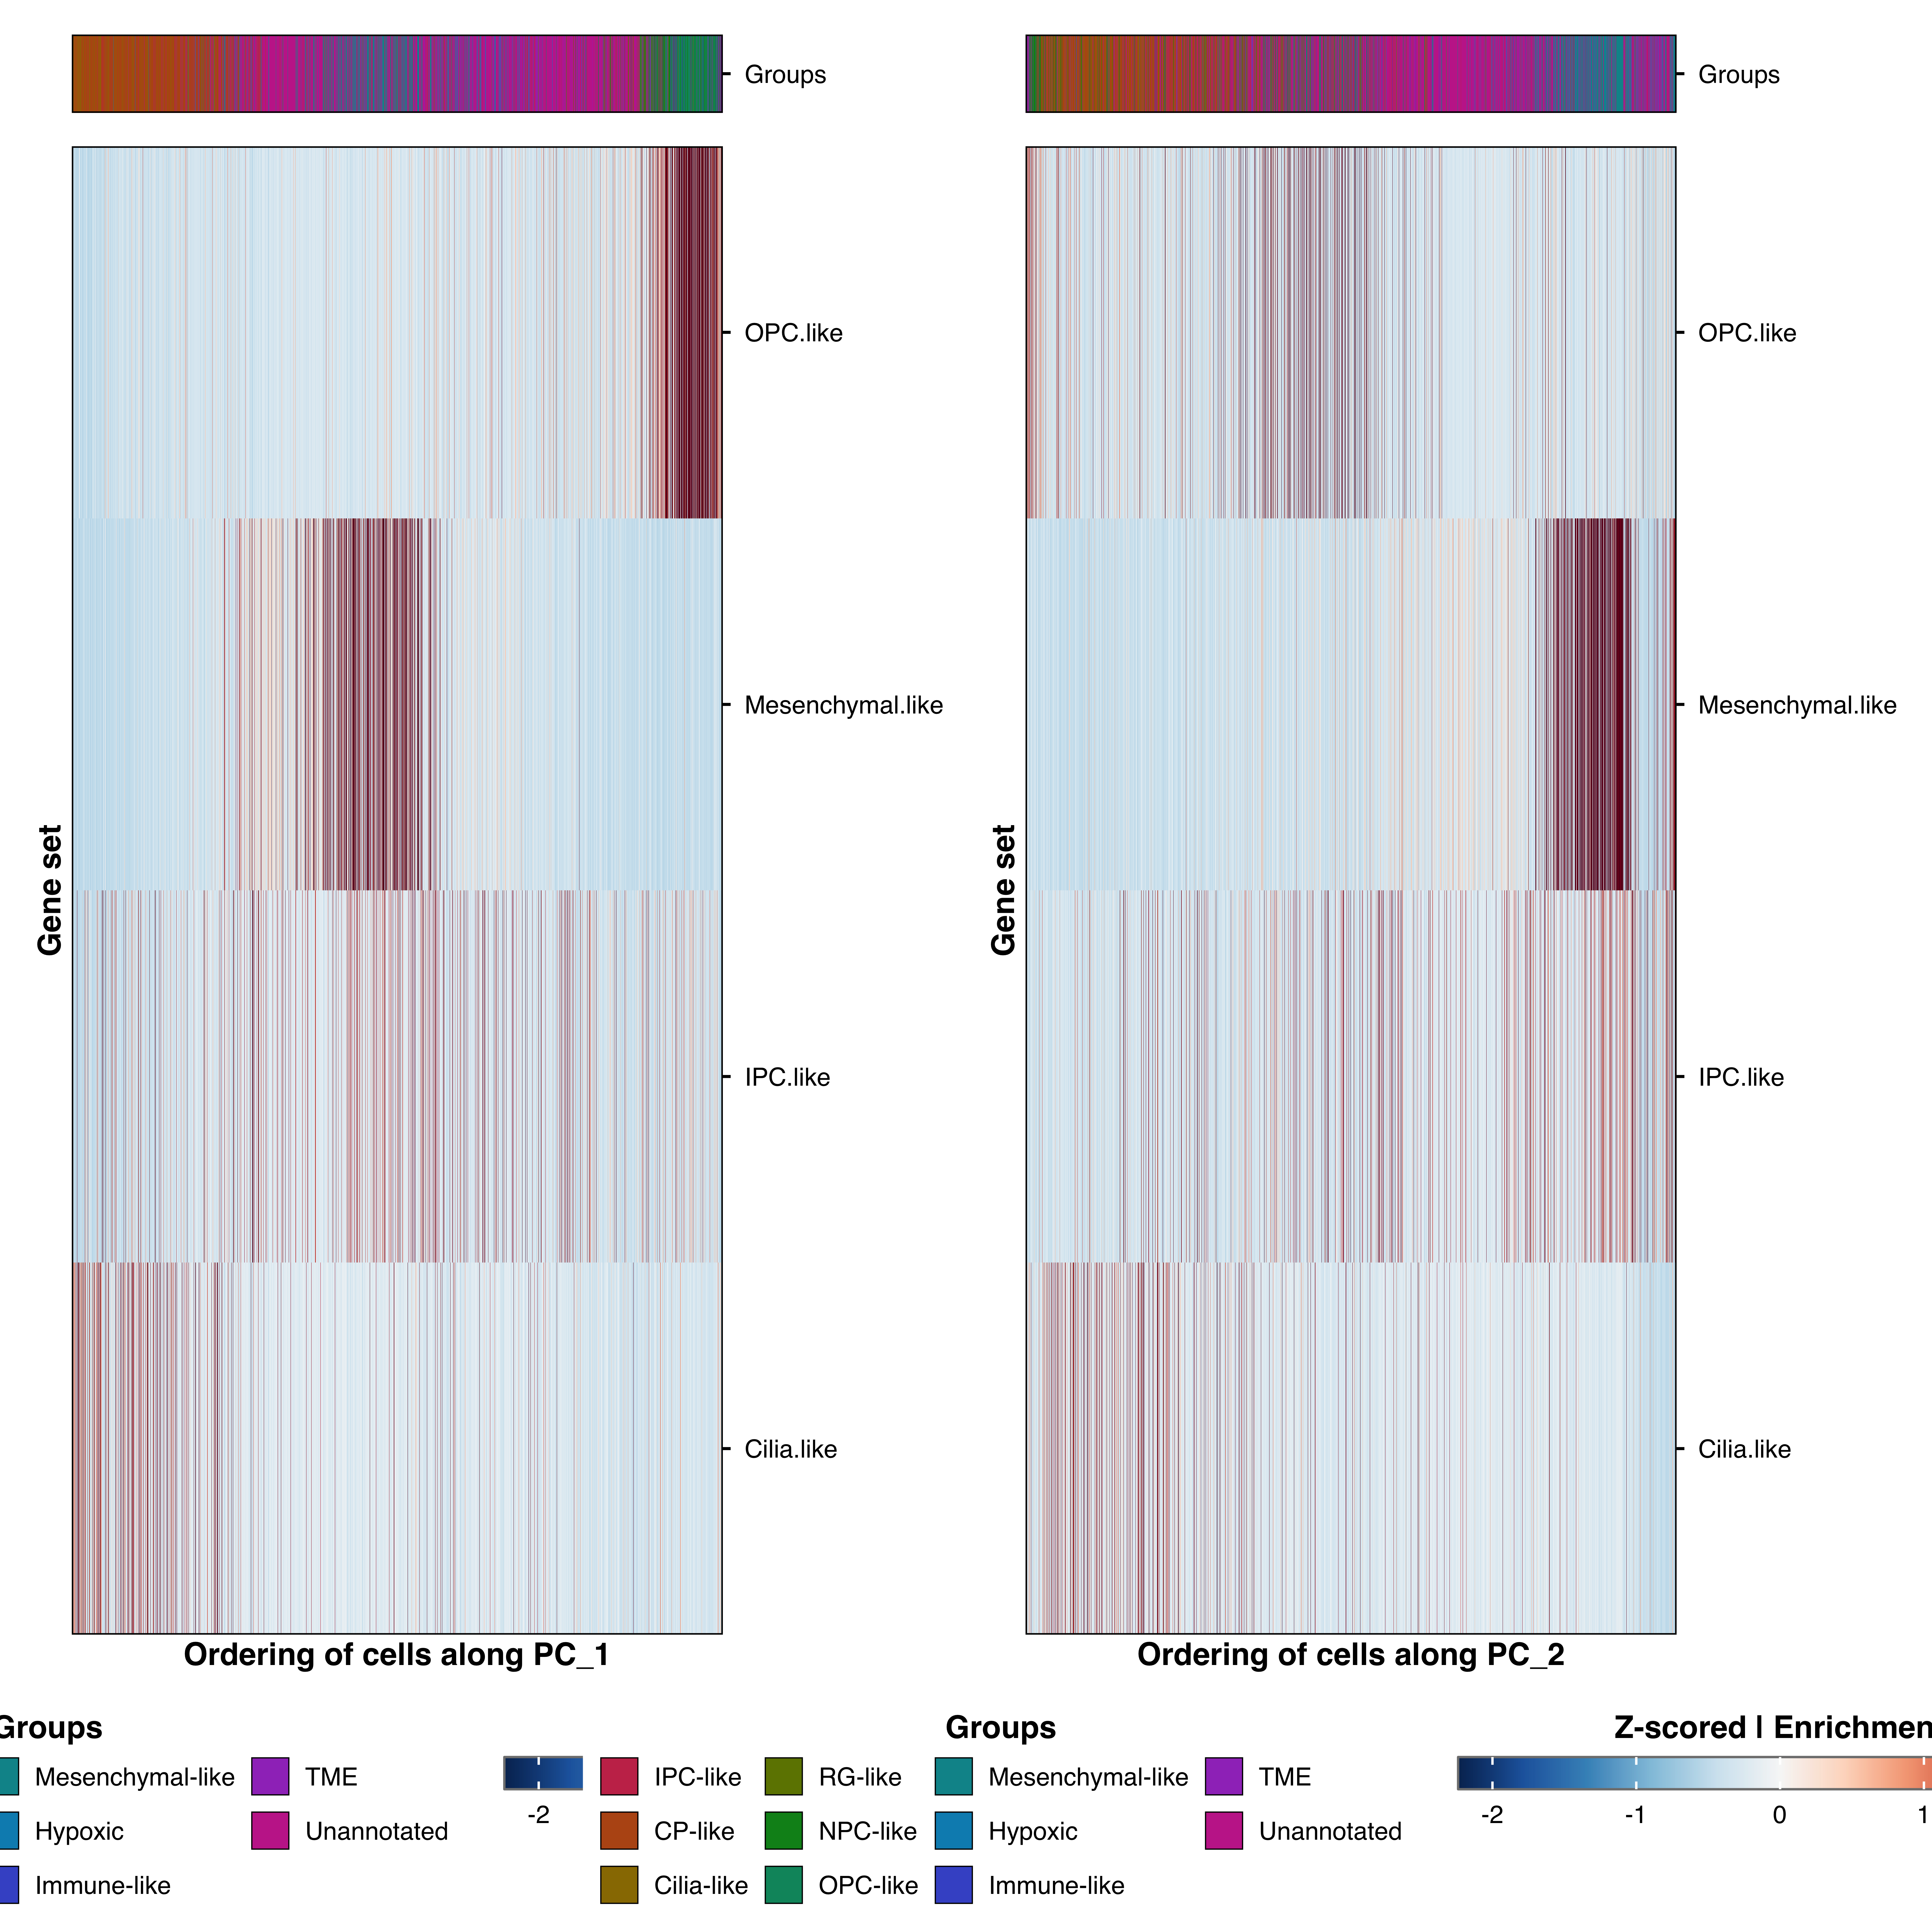
Multiple dimensions
p <- SCpubr :: do_RankedEnrichmentHeatmap ( sample = sample , input_gene_list = gene_lists ,
reduction = "pca" ,
dims = 1 : 2 )
# Access individual plots p $ PC_1 | p $ PC_2
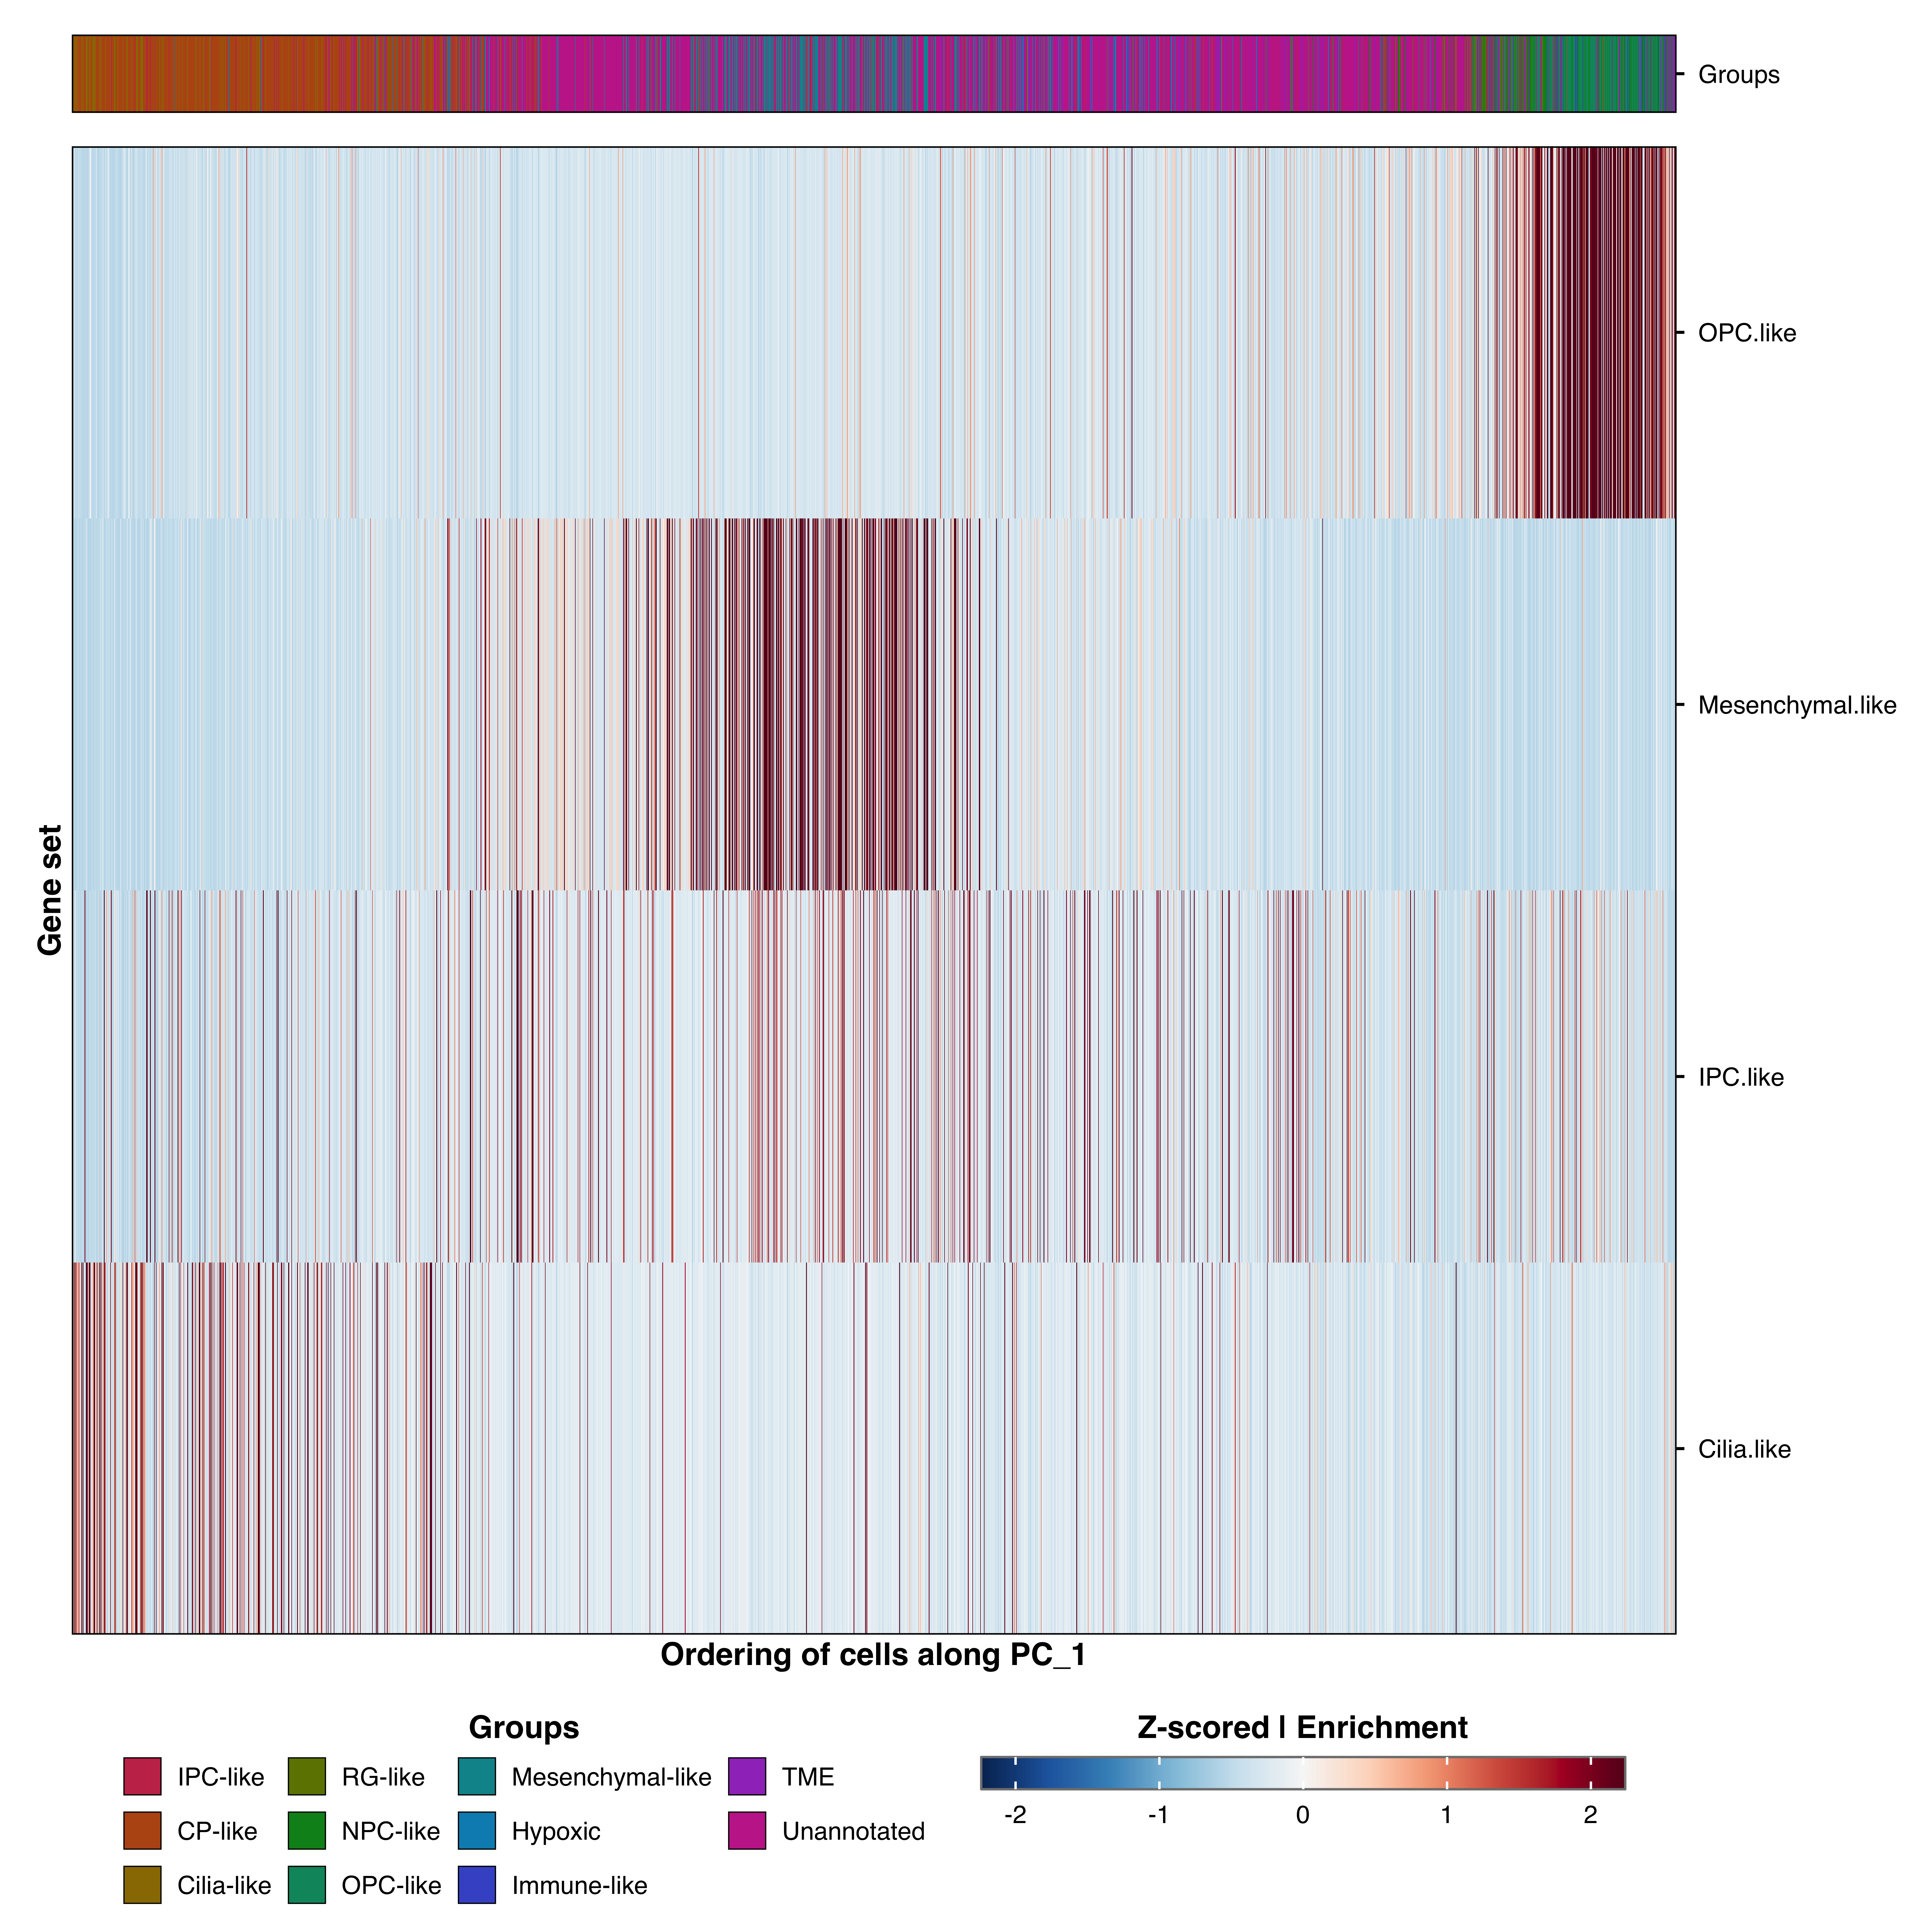
Scale enrichment scores (default)
Z-score enrichment for easier comparison between gene sets:
p <- SCpubr :: do_RankedEnrichmentHeatmap ( sample = sample , input_gene_list = gene_lists ,
dims = 1 ,
reduction = "pca" ,
scale.enrichment = TRUE )
p #> $PC_1
Scaling enables intra-gene set comparison but prevents absolute value comparison between gene sets.
Parameter reference
For parameters shared across many functions (color palettes, typography, legend styling), see Shared features .
Core parameters
input_gene_listNamed list of gene signatures
—
dimsDimensions to rank cells by
1:2
Scoring
flavor
"Seurat" or "UCell"
"Seurat"
scale.enrichmentZ-score enrichment values
TRUE
nbinBins for Seurat scoring
24
ctrlControl genes per bin
100
Appearance
main.heatmap.sizeMain heatmap proportion (0-1)
0.95
subsampleMax cells to display
2500
return_objectReturn Seurat object
FALSE