p <- SCpubr::do_CorrelationHeatmap(sample = sample)
p
Correlation heatmaps show pairwise Pearson correlations between samples, groups, or features. Use them to identify similar or distinct populations based on their expression profiles.
Correlate cell populations using highly variable genes:
p <- SCpubr::do_CorrelationHeatmap(sample = sample)
p
p <- SCpubr::do_CorrelationHeatmap(sample = sample,
                                   group.by = "ID")
p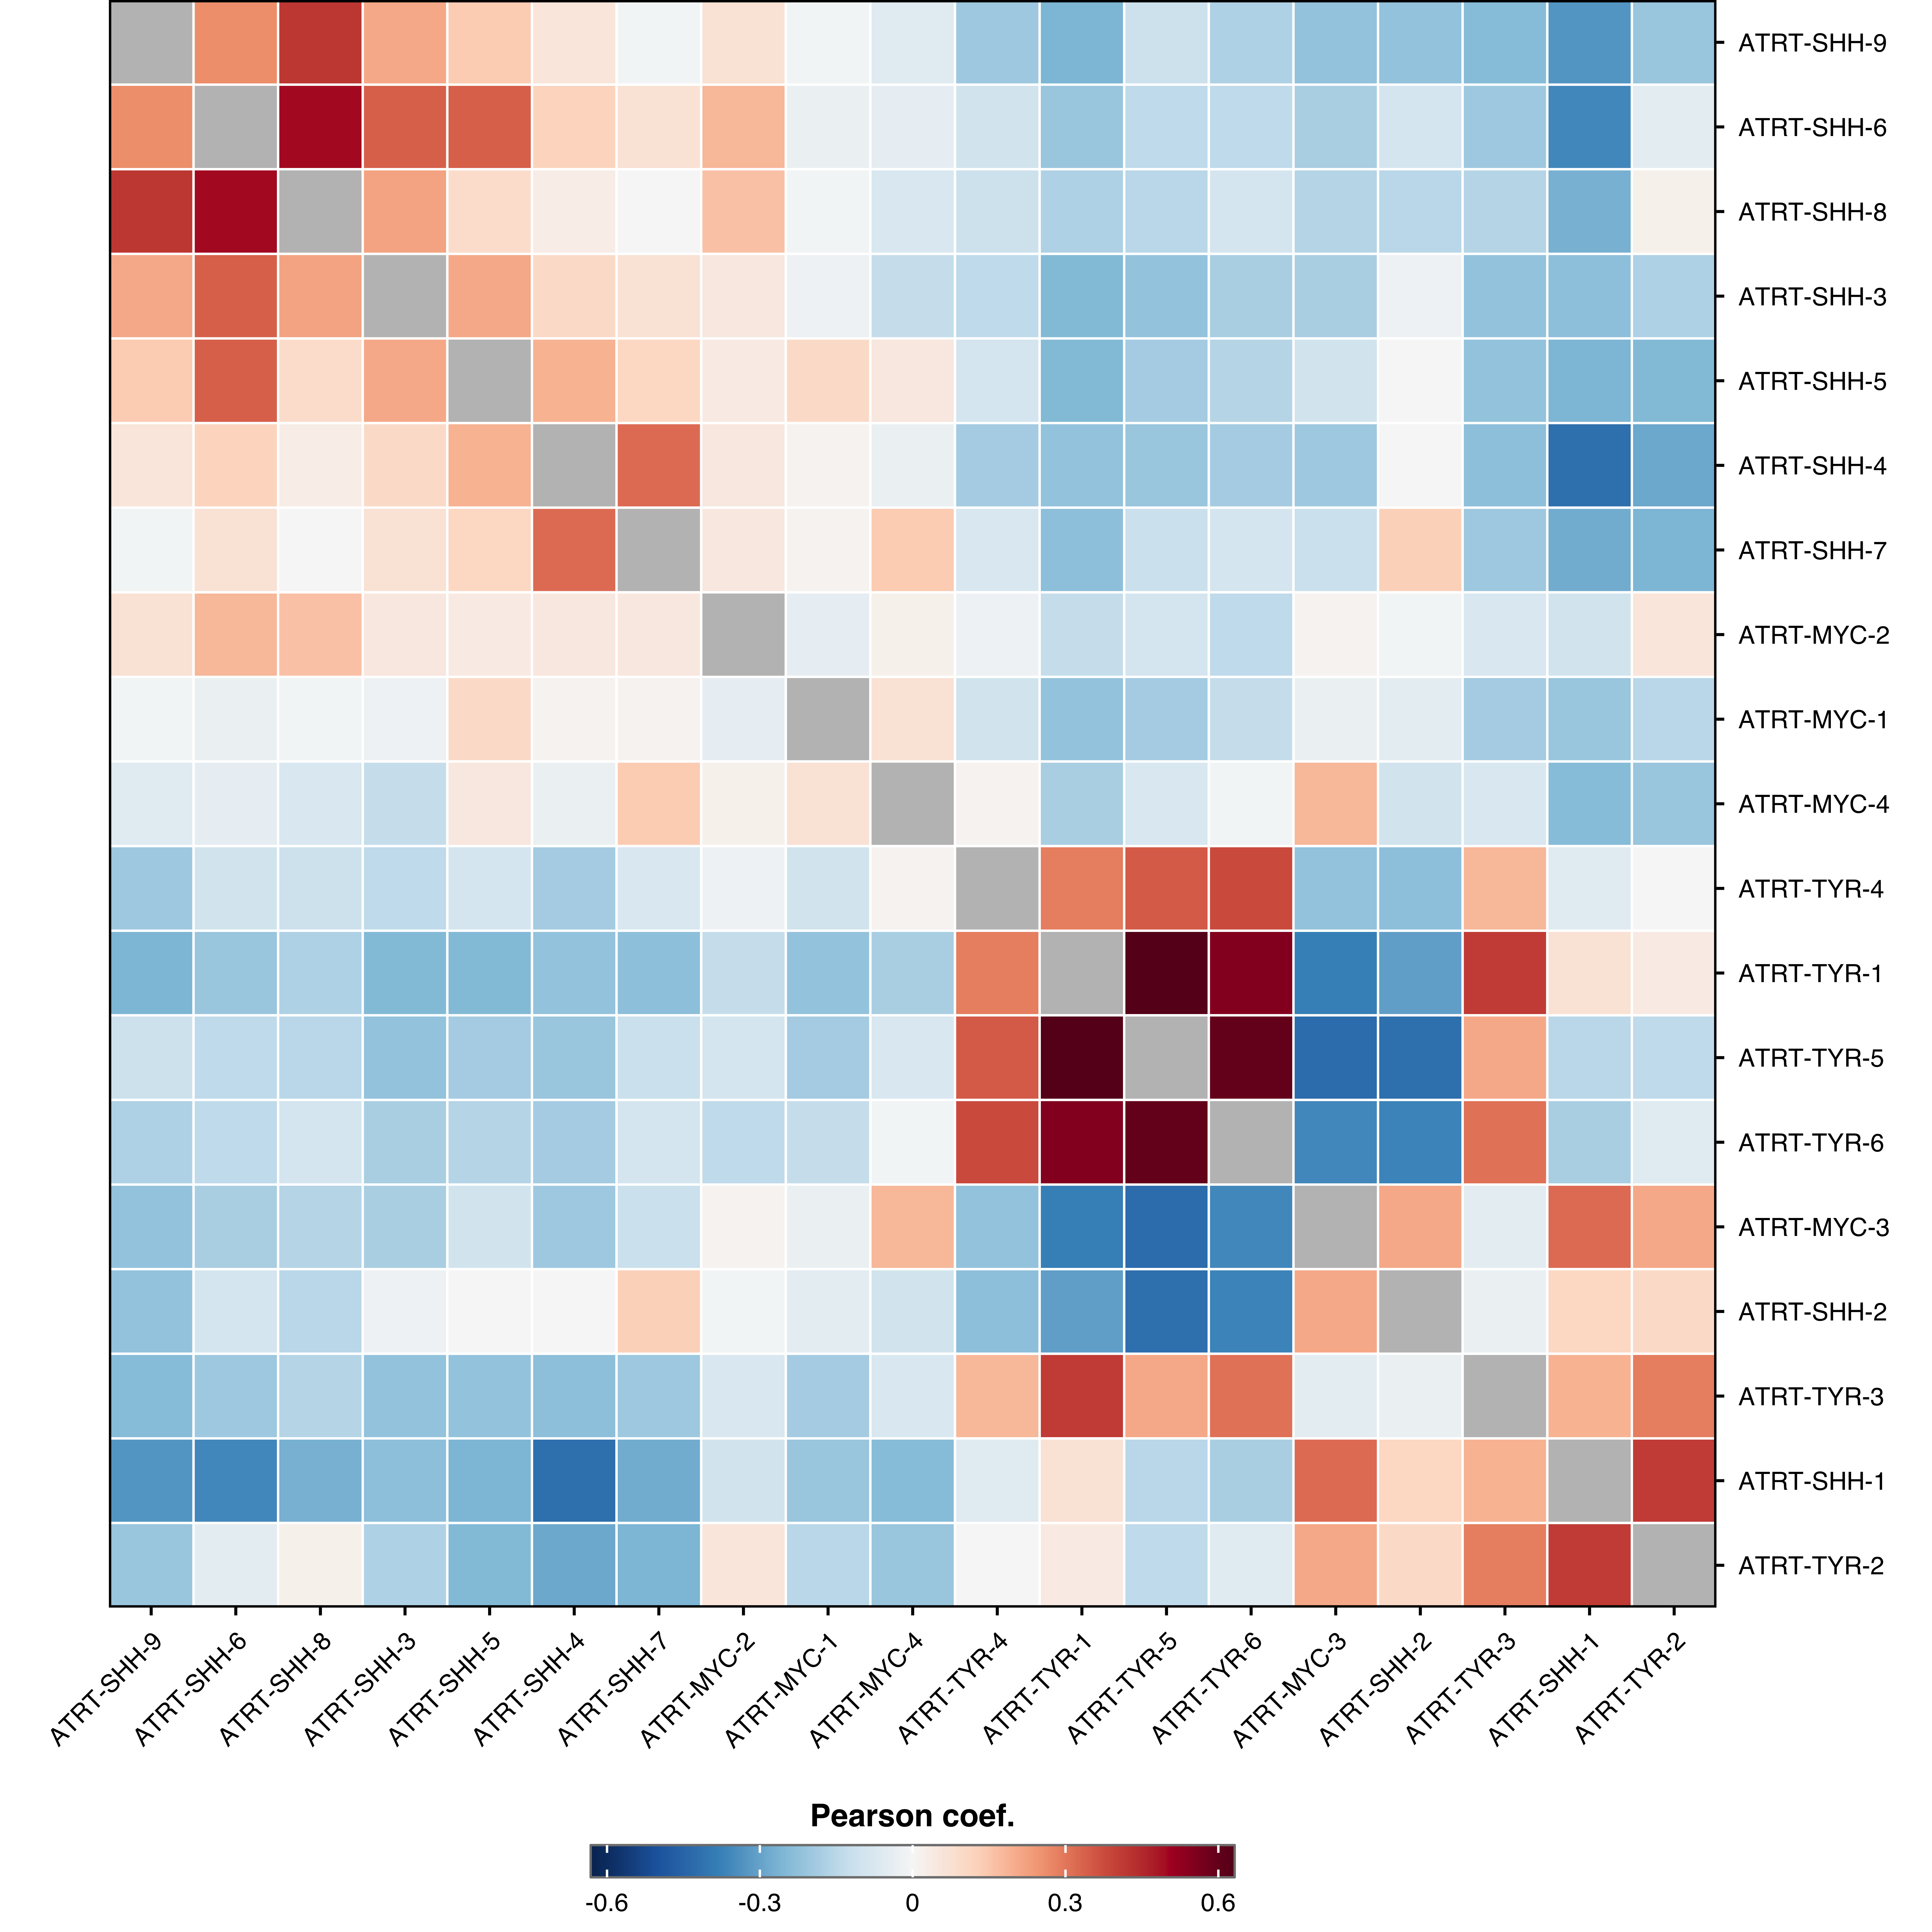
p <- SCpubr::do_CorrelationHeatmap(sample = sample,
                                   remove.diagonal = FALSE)
p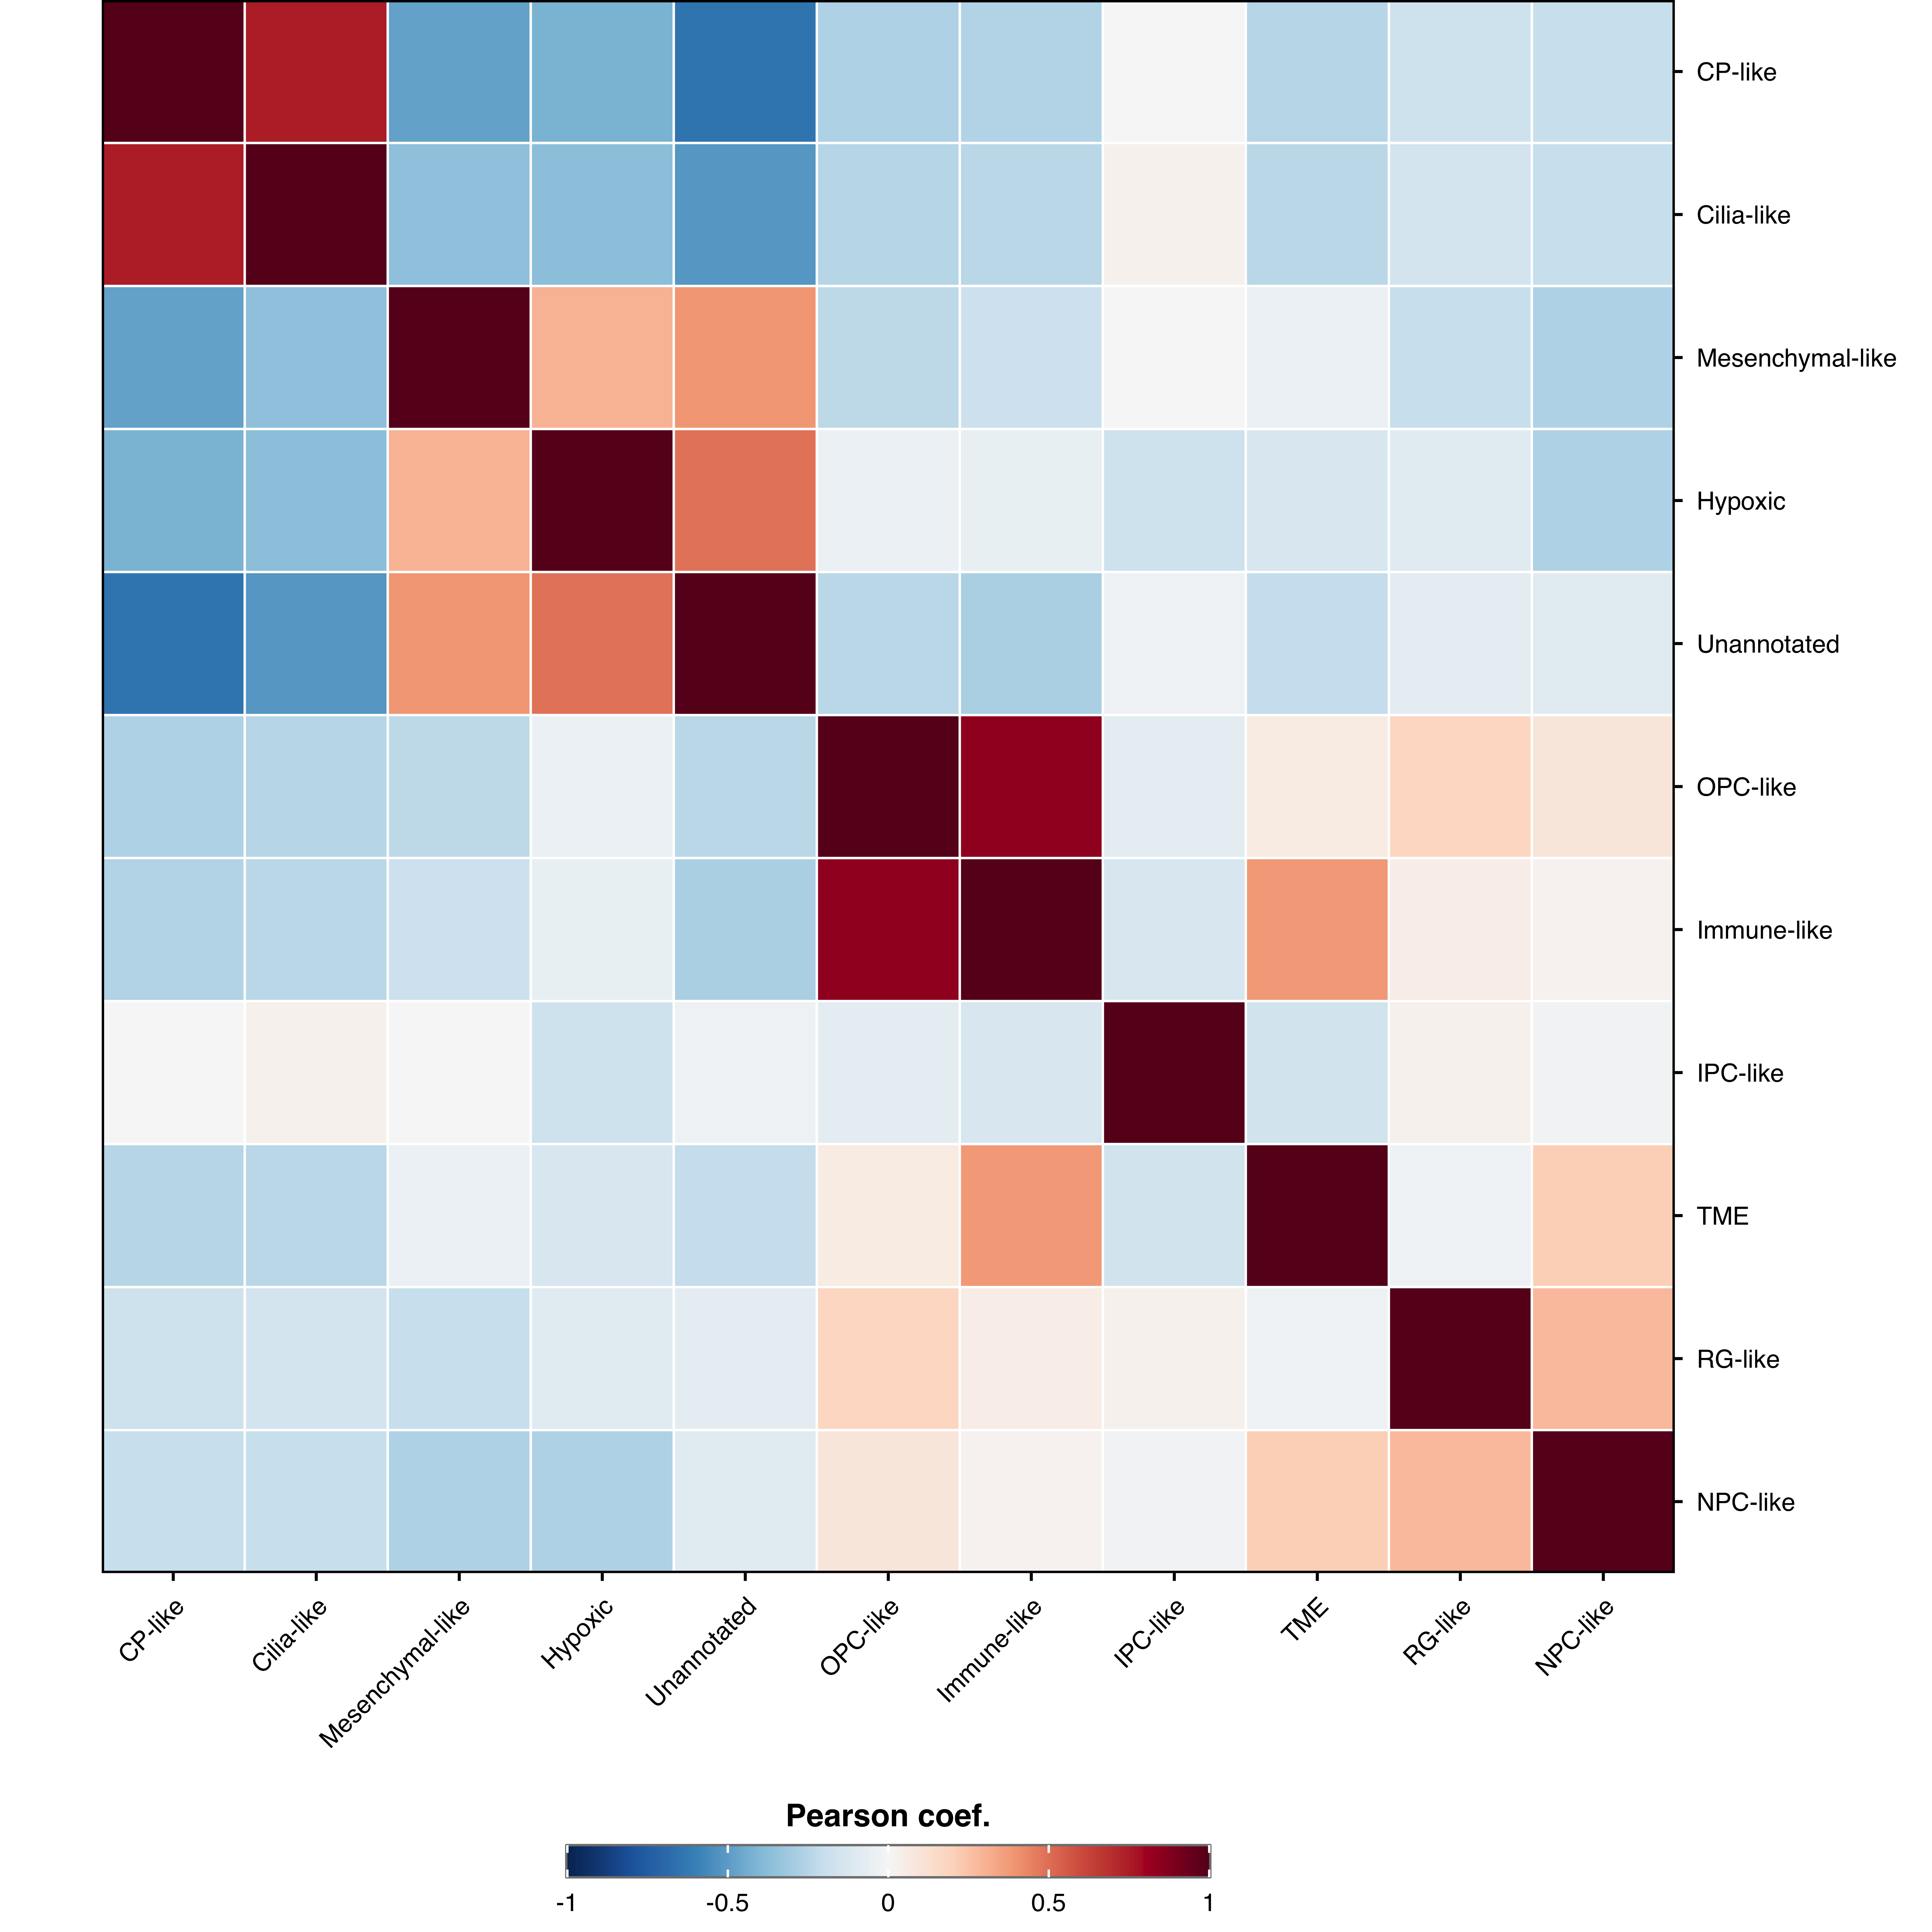
p <- SCpubr::do_CorrelationHeatmap(sample = sample,
                                   cluster = FALSE)
p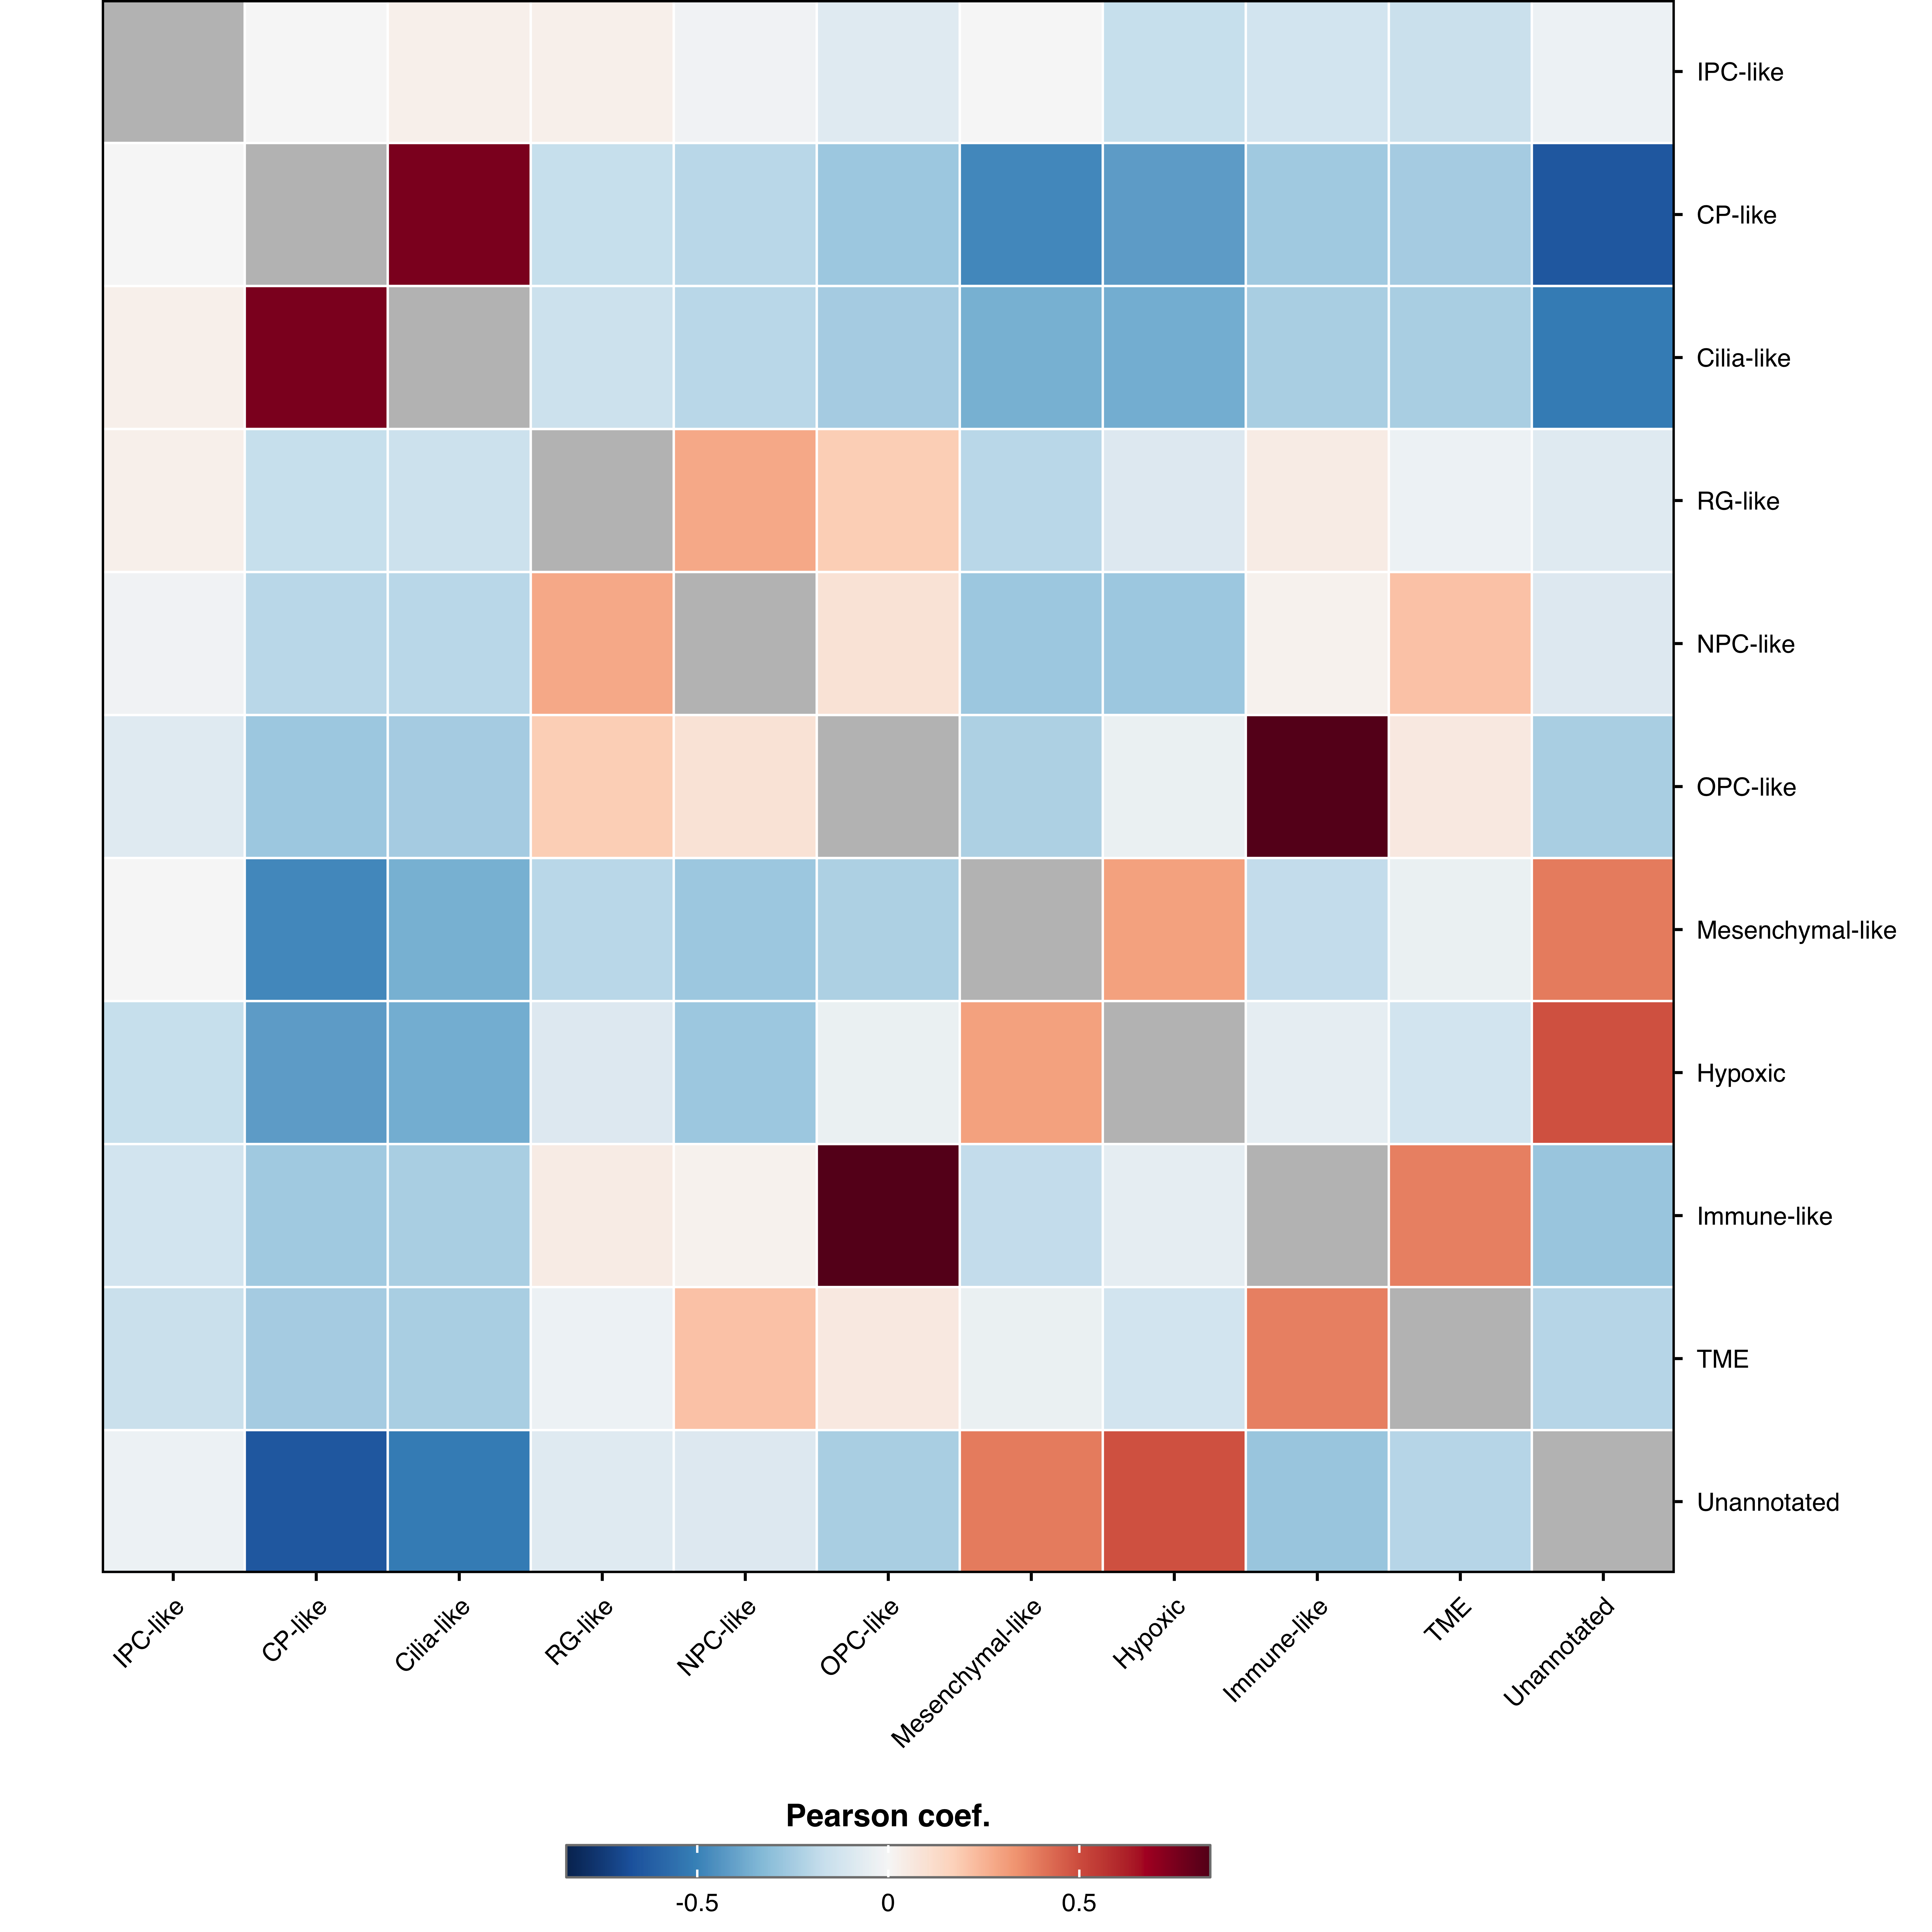
p <- SCpubr::do_CorrelationHeatmap(sample = sample,
                                   values.show = TRUE,
                                   values.threshold = 0.5)
p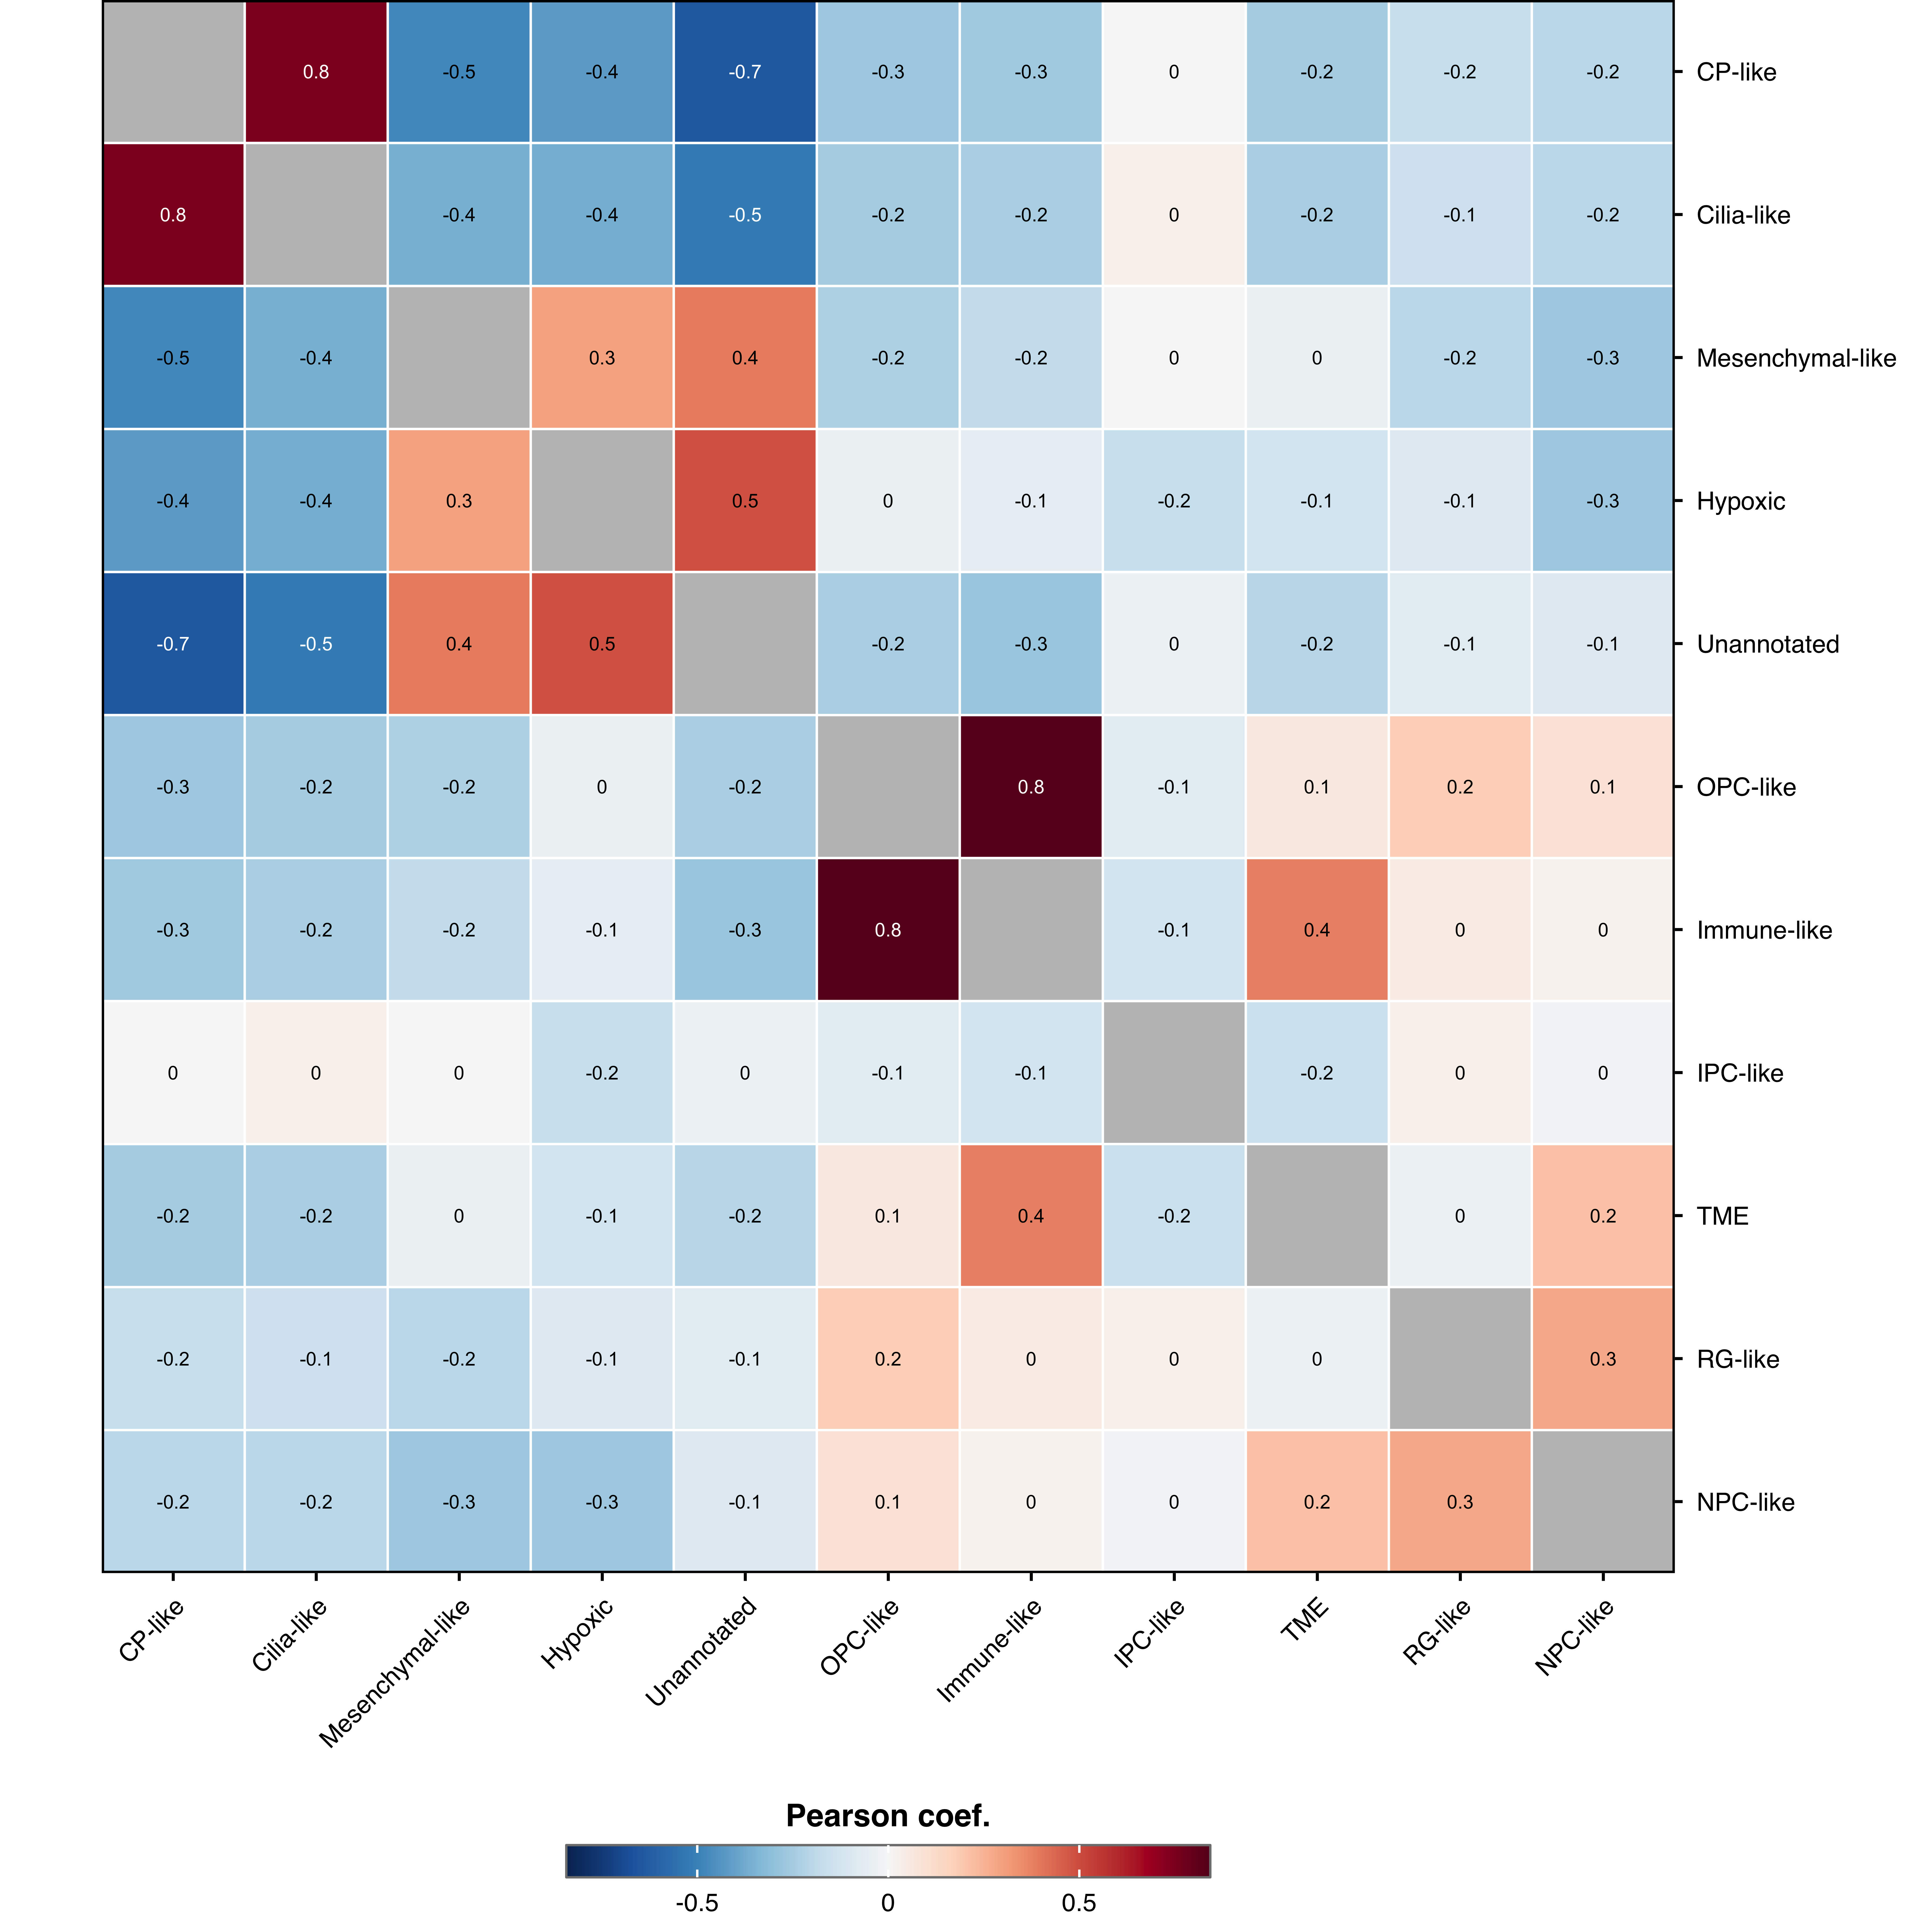
For parameters shared across many functions (color palettes, typography, legend styling, grid), see Shared features.
| Parameter | Description | Default |
|---|---|---|
input_gene_list |
Genes for correlation |
NULL (uses HVGs) |
mode |
Correlation mode | "hvg" |
cluster |
Hierarchical clustering | TRUE |
remove.diagonal |
Set diagonal to NA | TRUE |
| Parameter | Description | Default |
|---|---|---|
values.show |
Show numeric values | FALSE |
values.size |
Value text size | 3 |
values.threshold |
Threshold on which the text changes color | NULL |
values.round |
Decimal places | 1 |