p <- SCpubr::do_LoadingsHeatmap(sample = sample)
p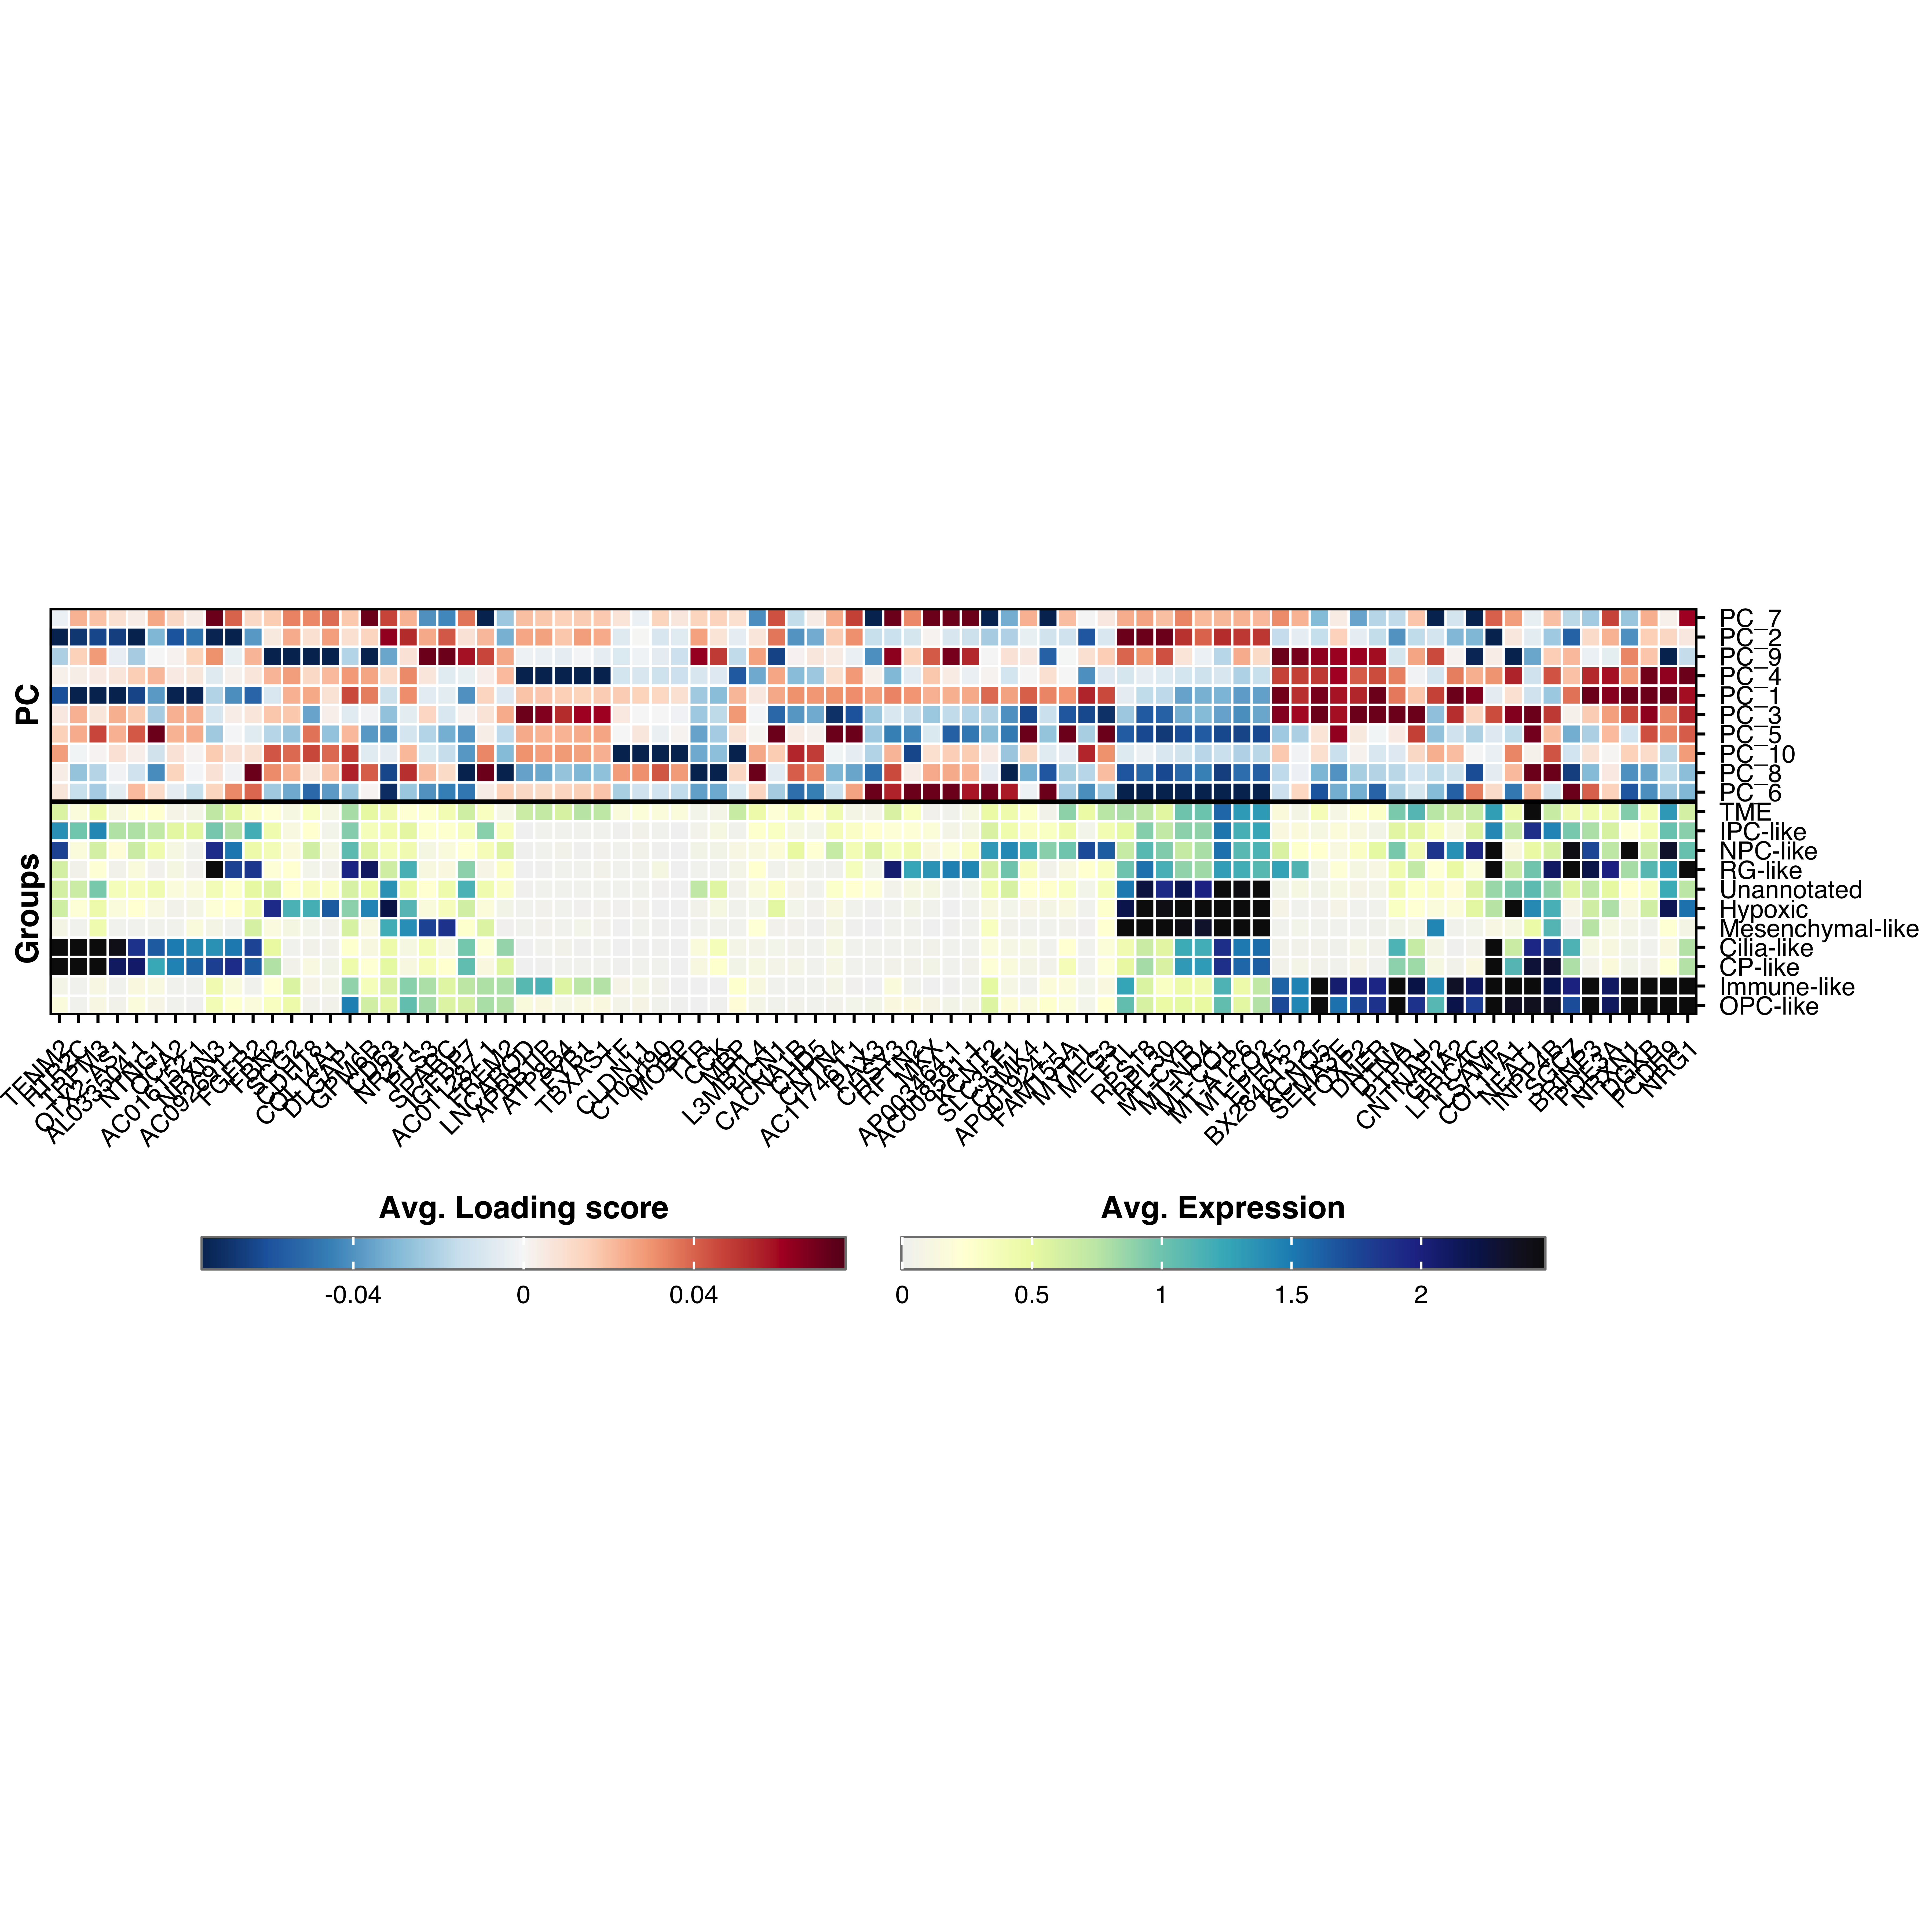
Loadings heatmaps show which genes contribute most to principal components. Displays top and bottom scoring genes for each PC alongside their expression levels.
p <- SCpubr::do_LoadingsHeatmap(sample = sample)
p
p <- SCpubr::do_LoadingsHeatmap(sample = sample,
                                dims = 1:2)
p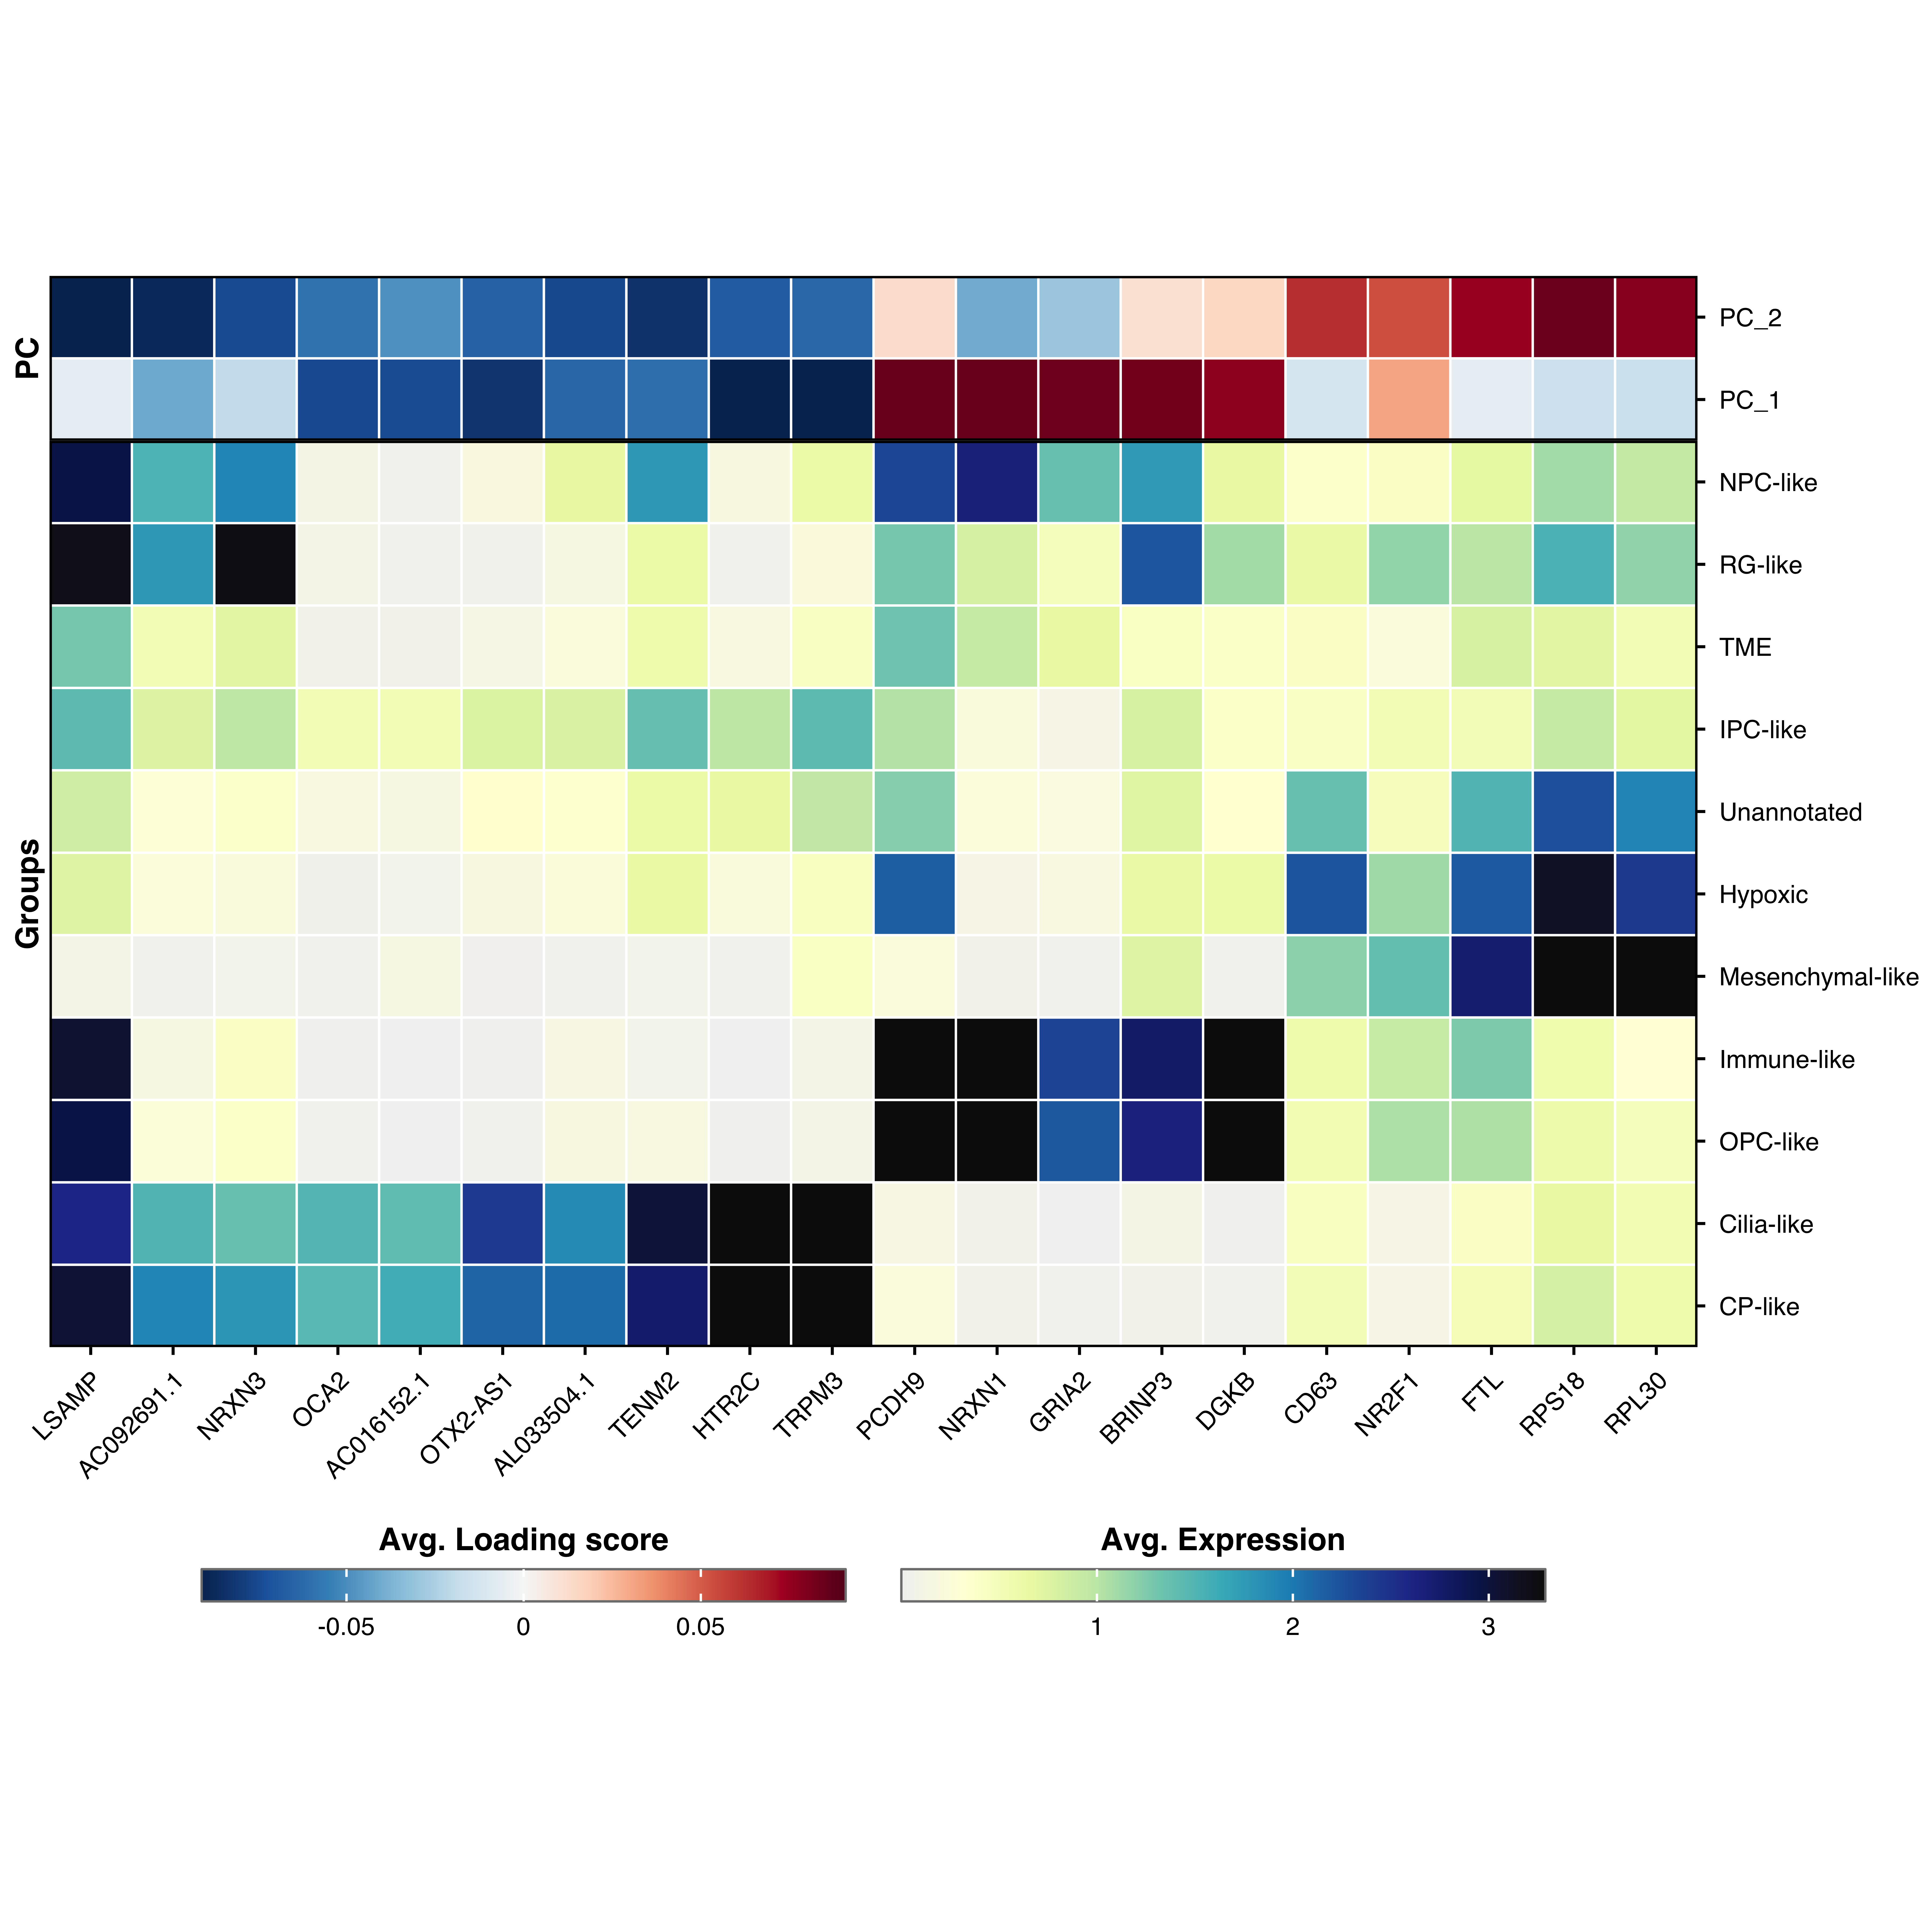
p <- SCpubr::do_LoadingsHeatmap(sample = sample,
                                top_loadings = 2)
p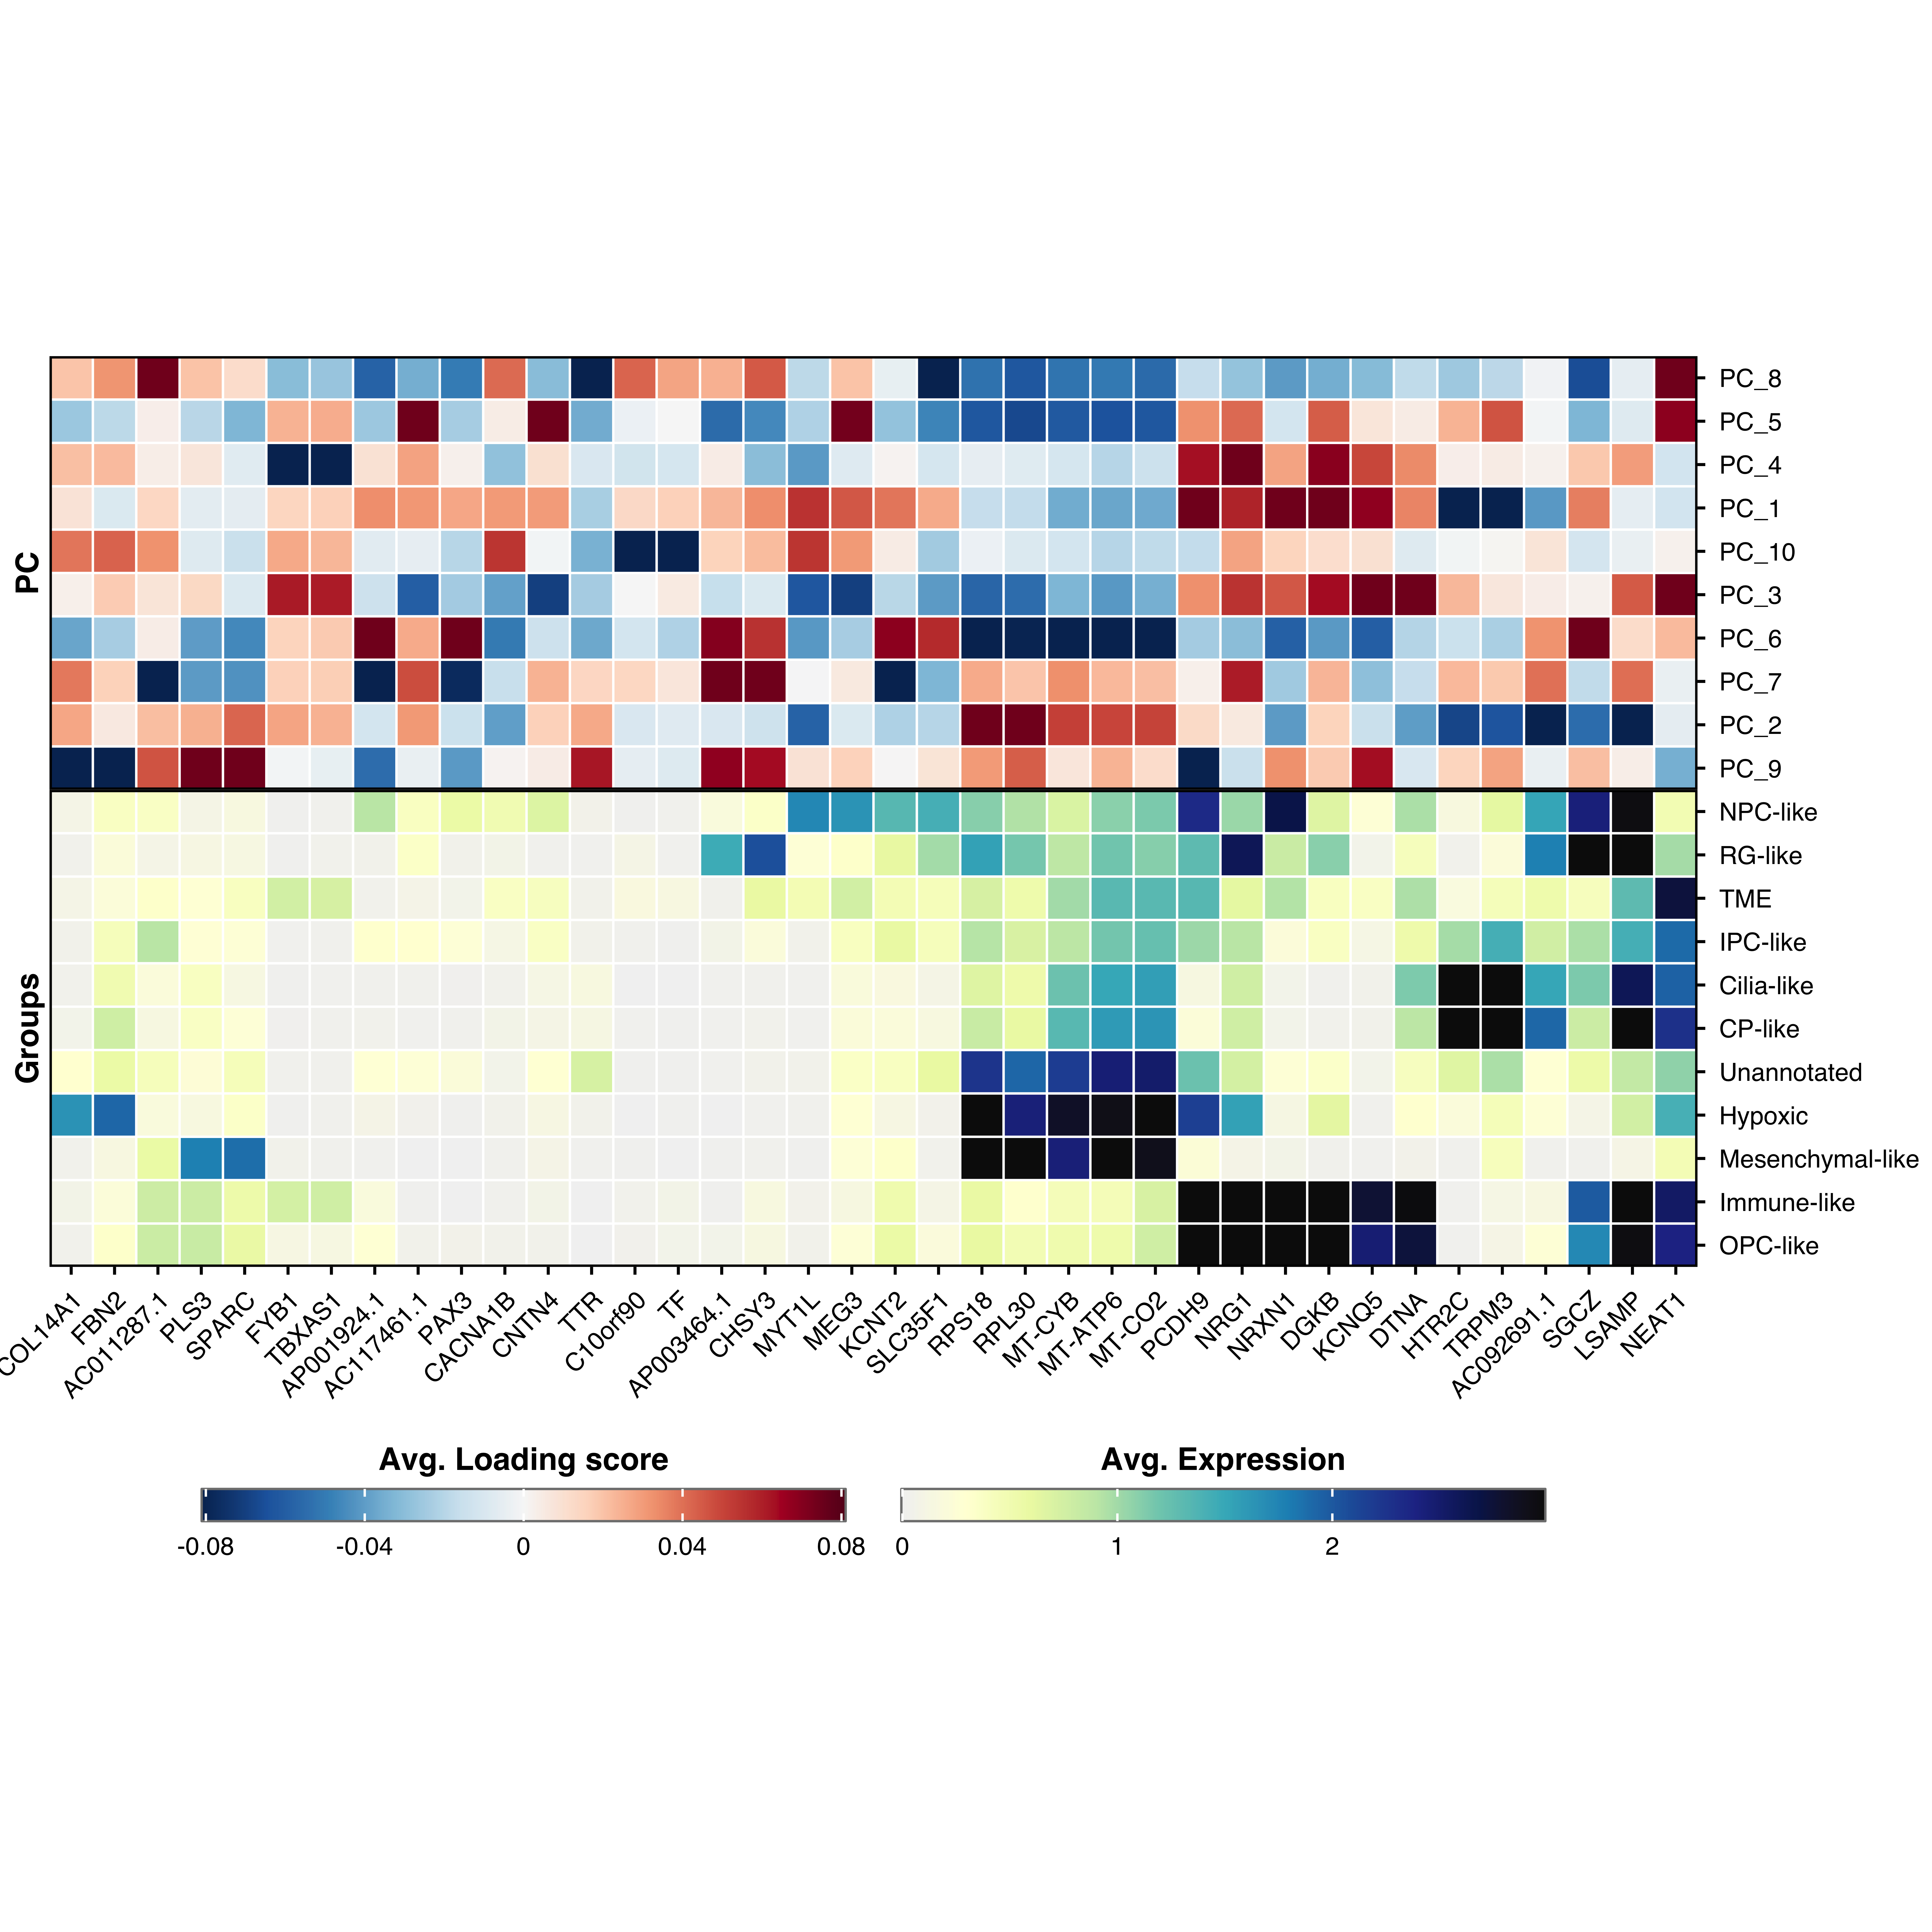
p <- SCpubr::do_LoadingsHeatmap(sample = sample,
                                group.by = "subtype")
p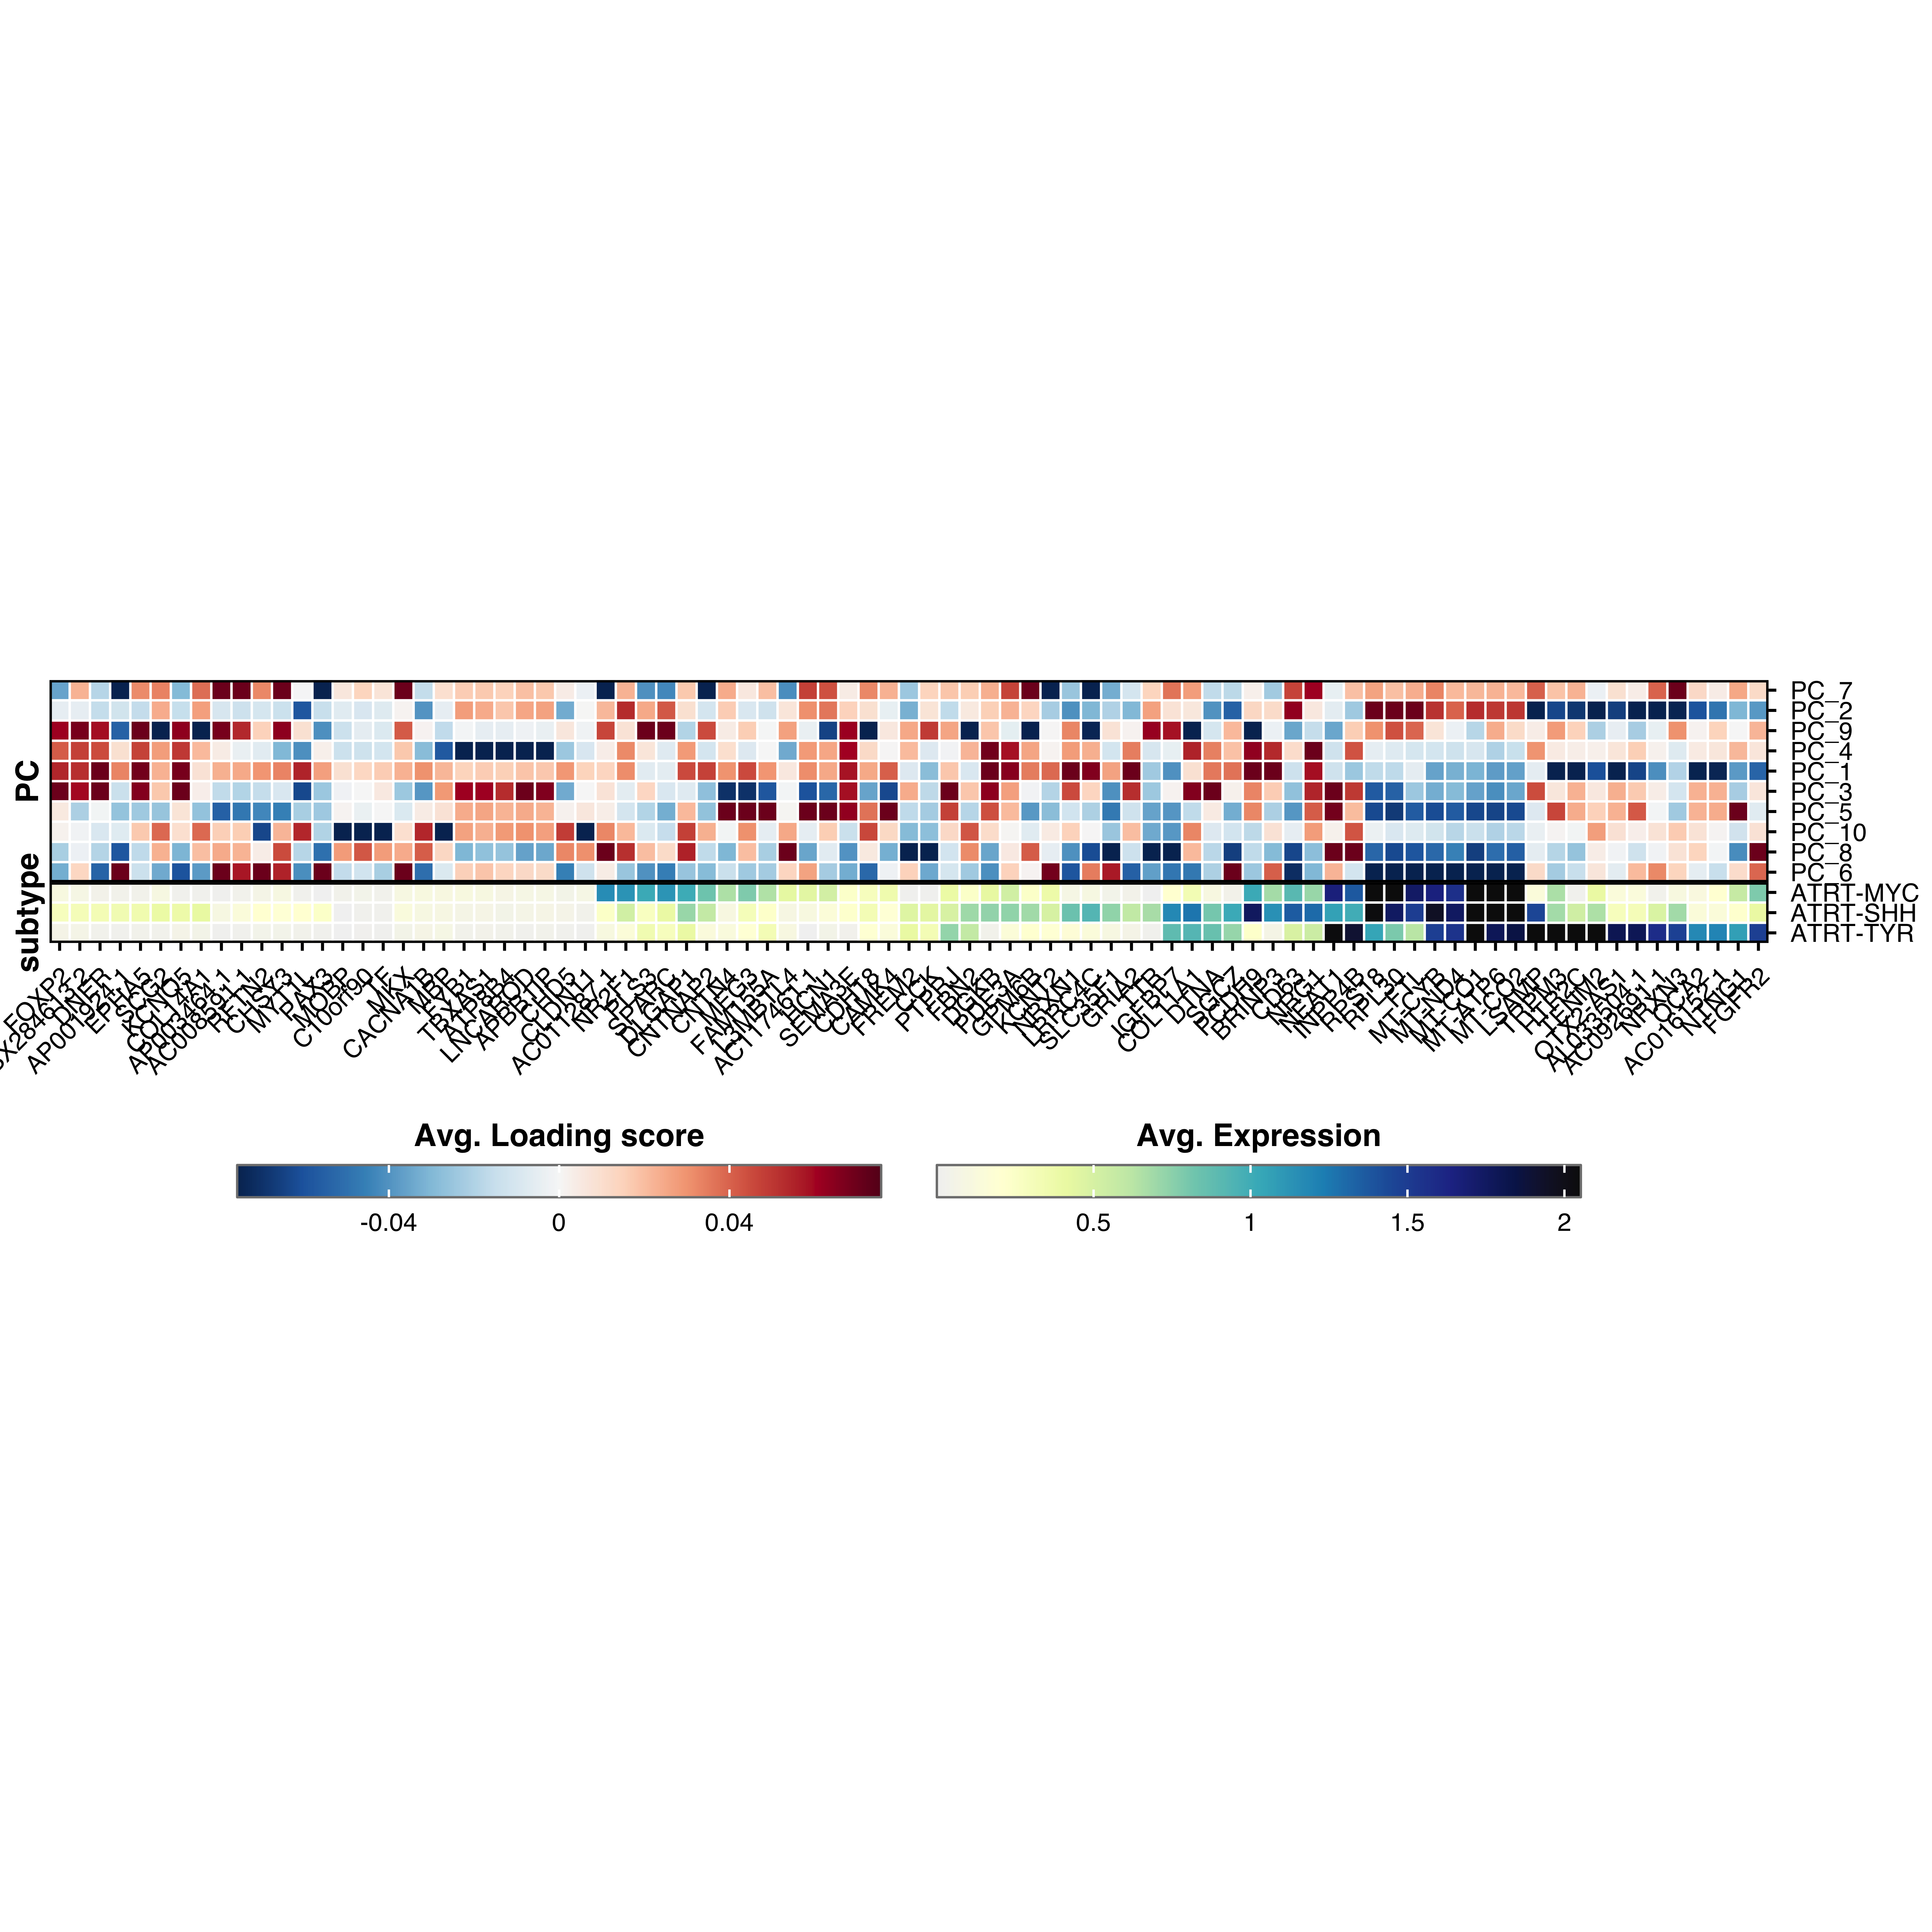
p <- SCpubr::do_LoadingsHeatmap(sample = sample,
                                subsample = 1000)
p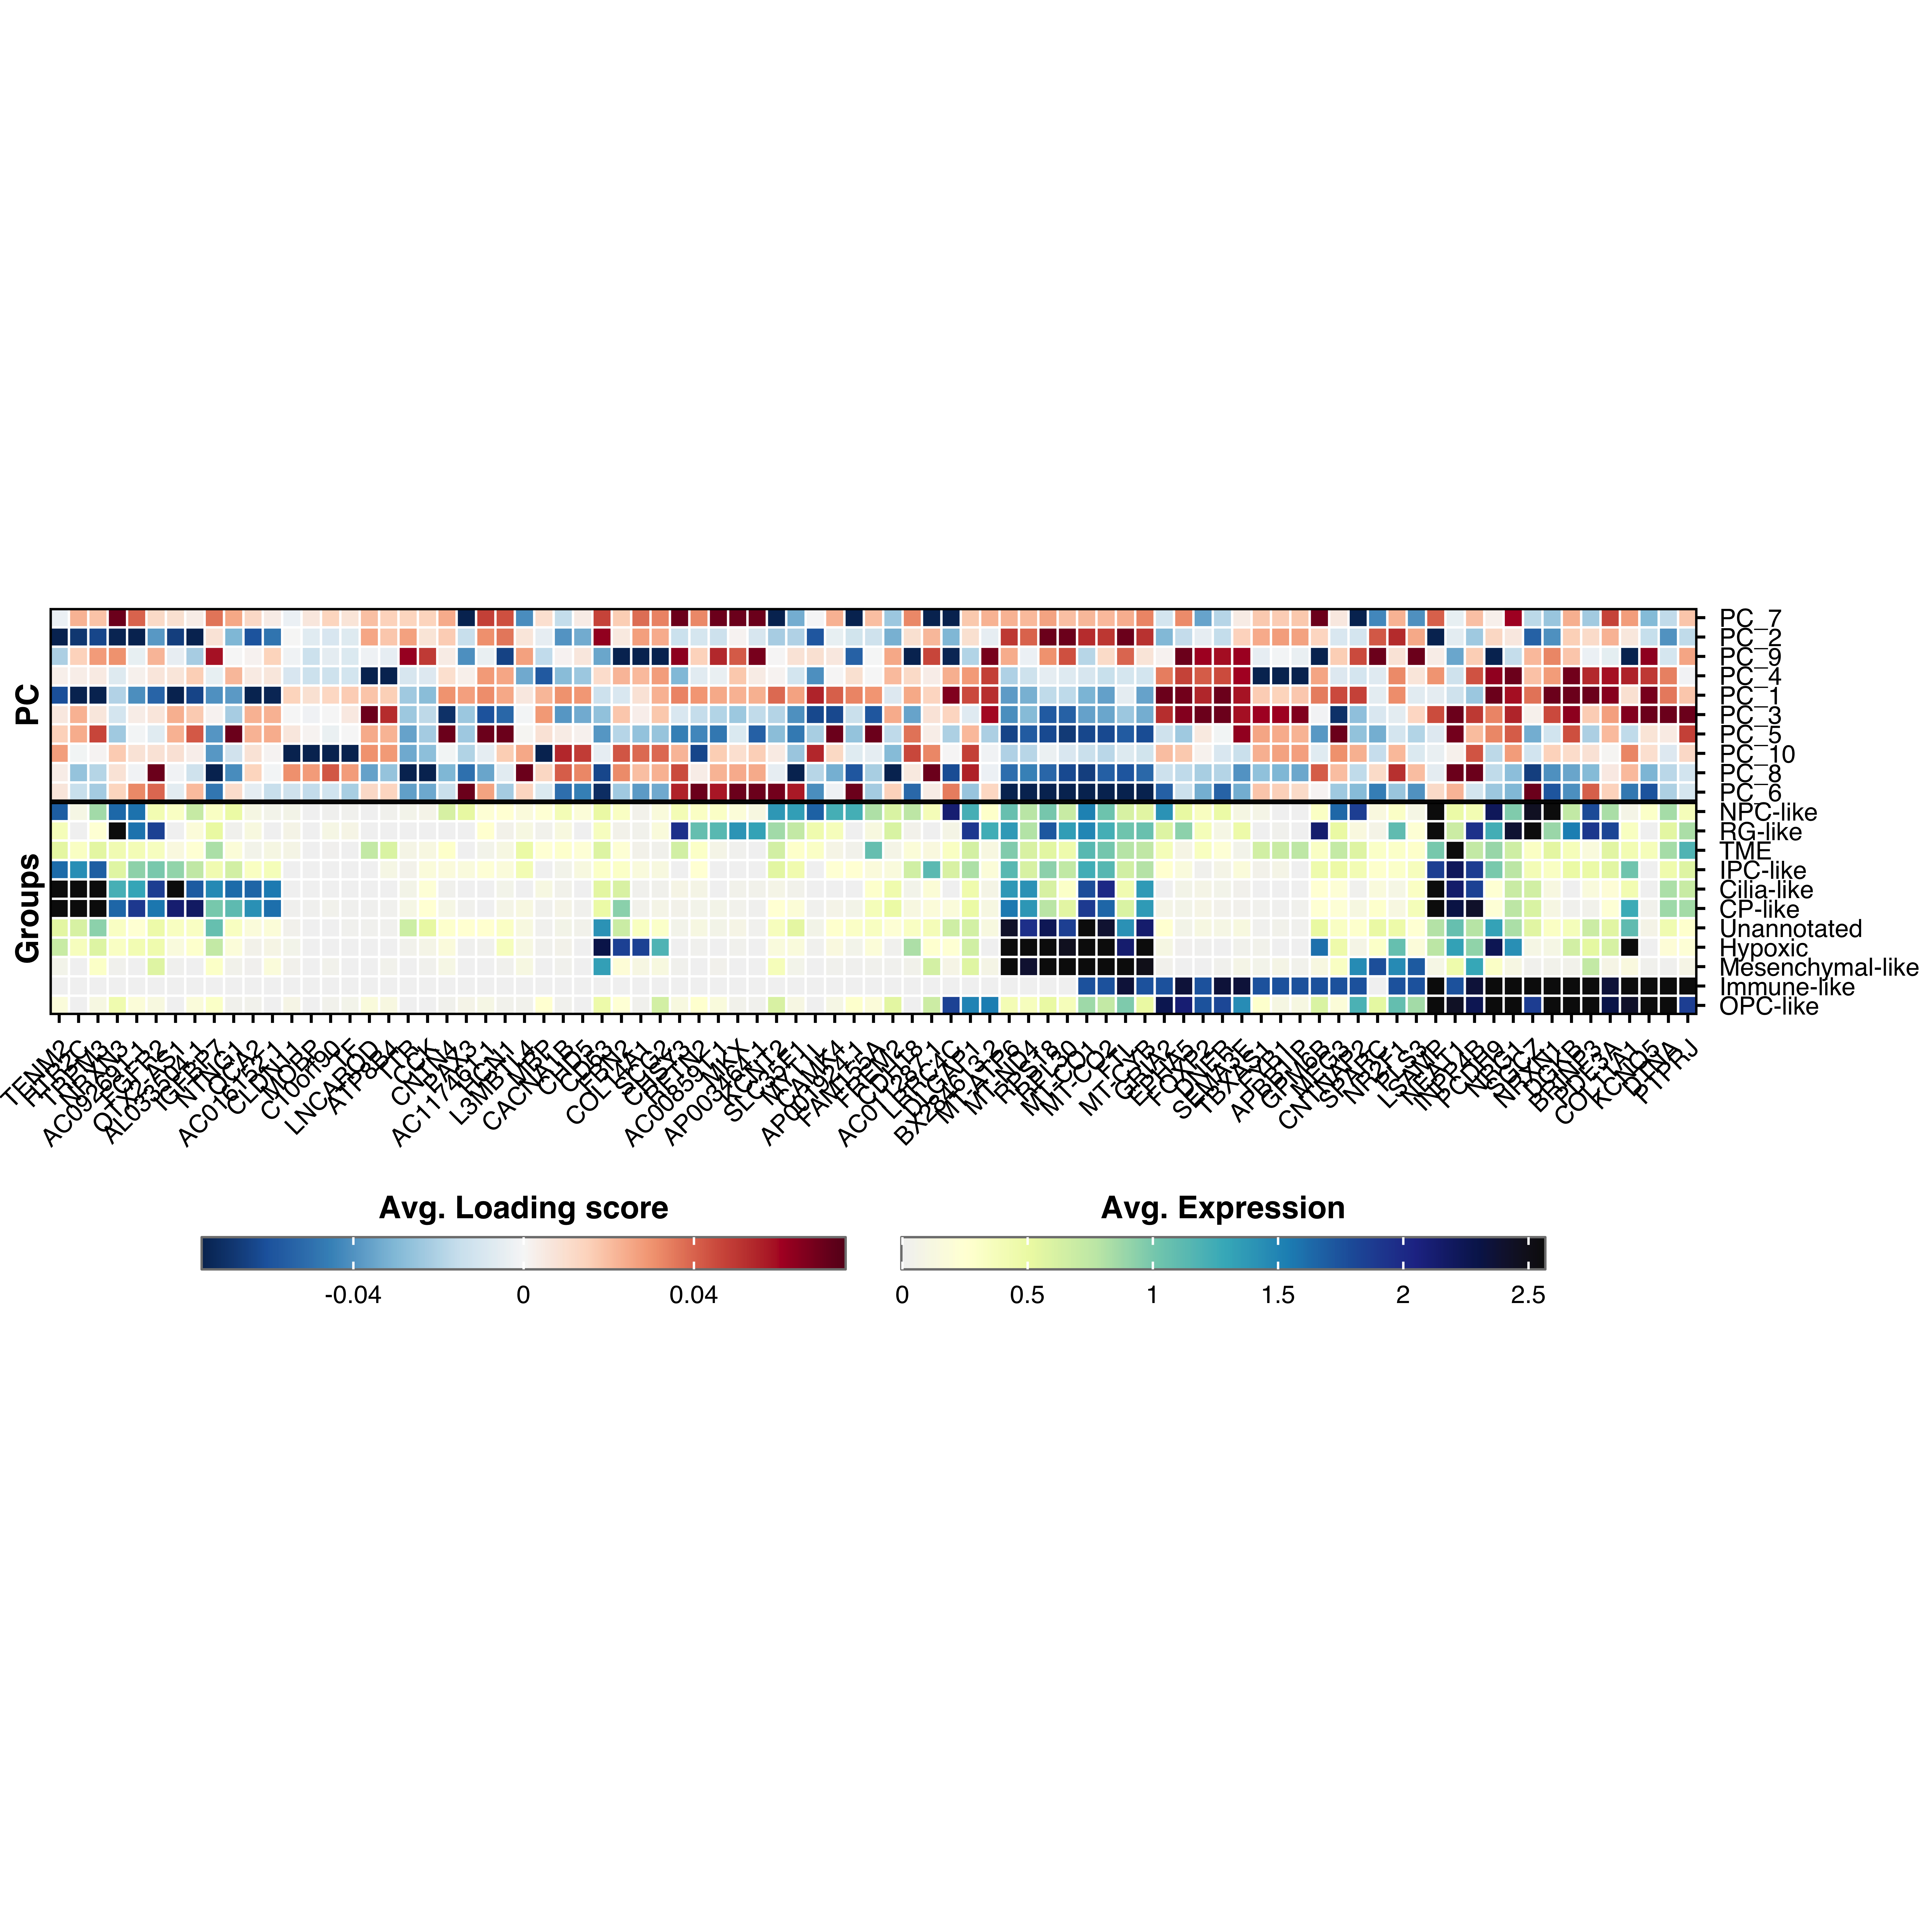
p <- SCpubr::do_LoadingsHeatmap(sample = sample,
                                min.cutoff.loadings = -0.1,
                                max.cutoff.loadings = 0.1,
                                min.cutoff.expression = 0,
                                max.cutoff.expression = 3)
p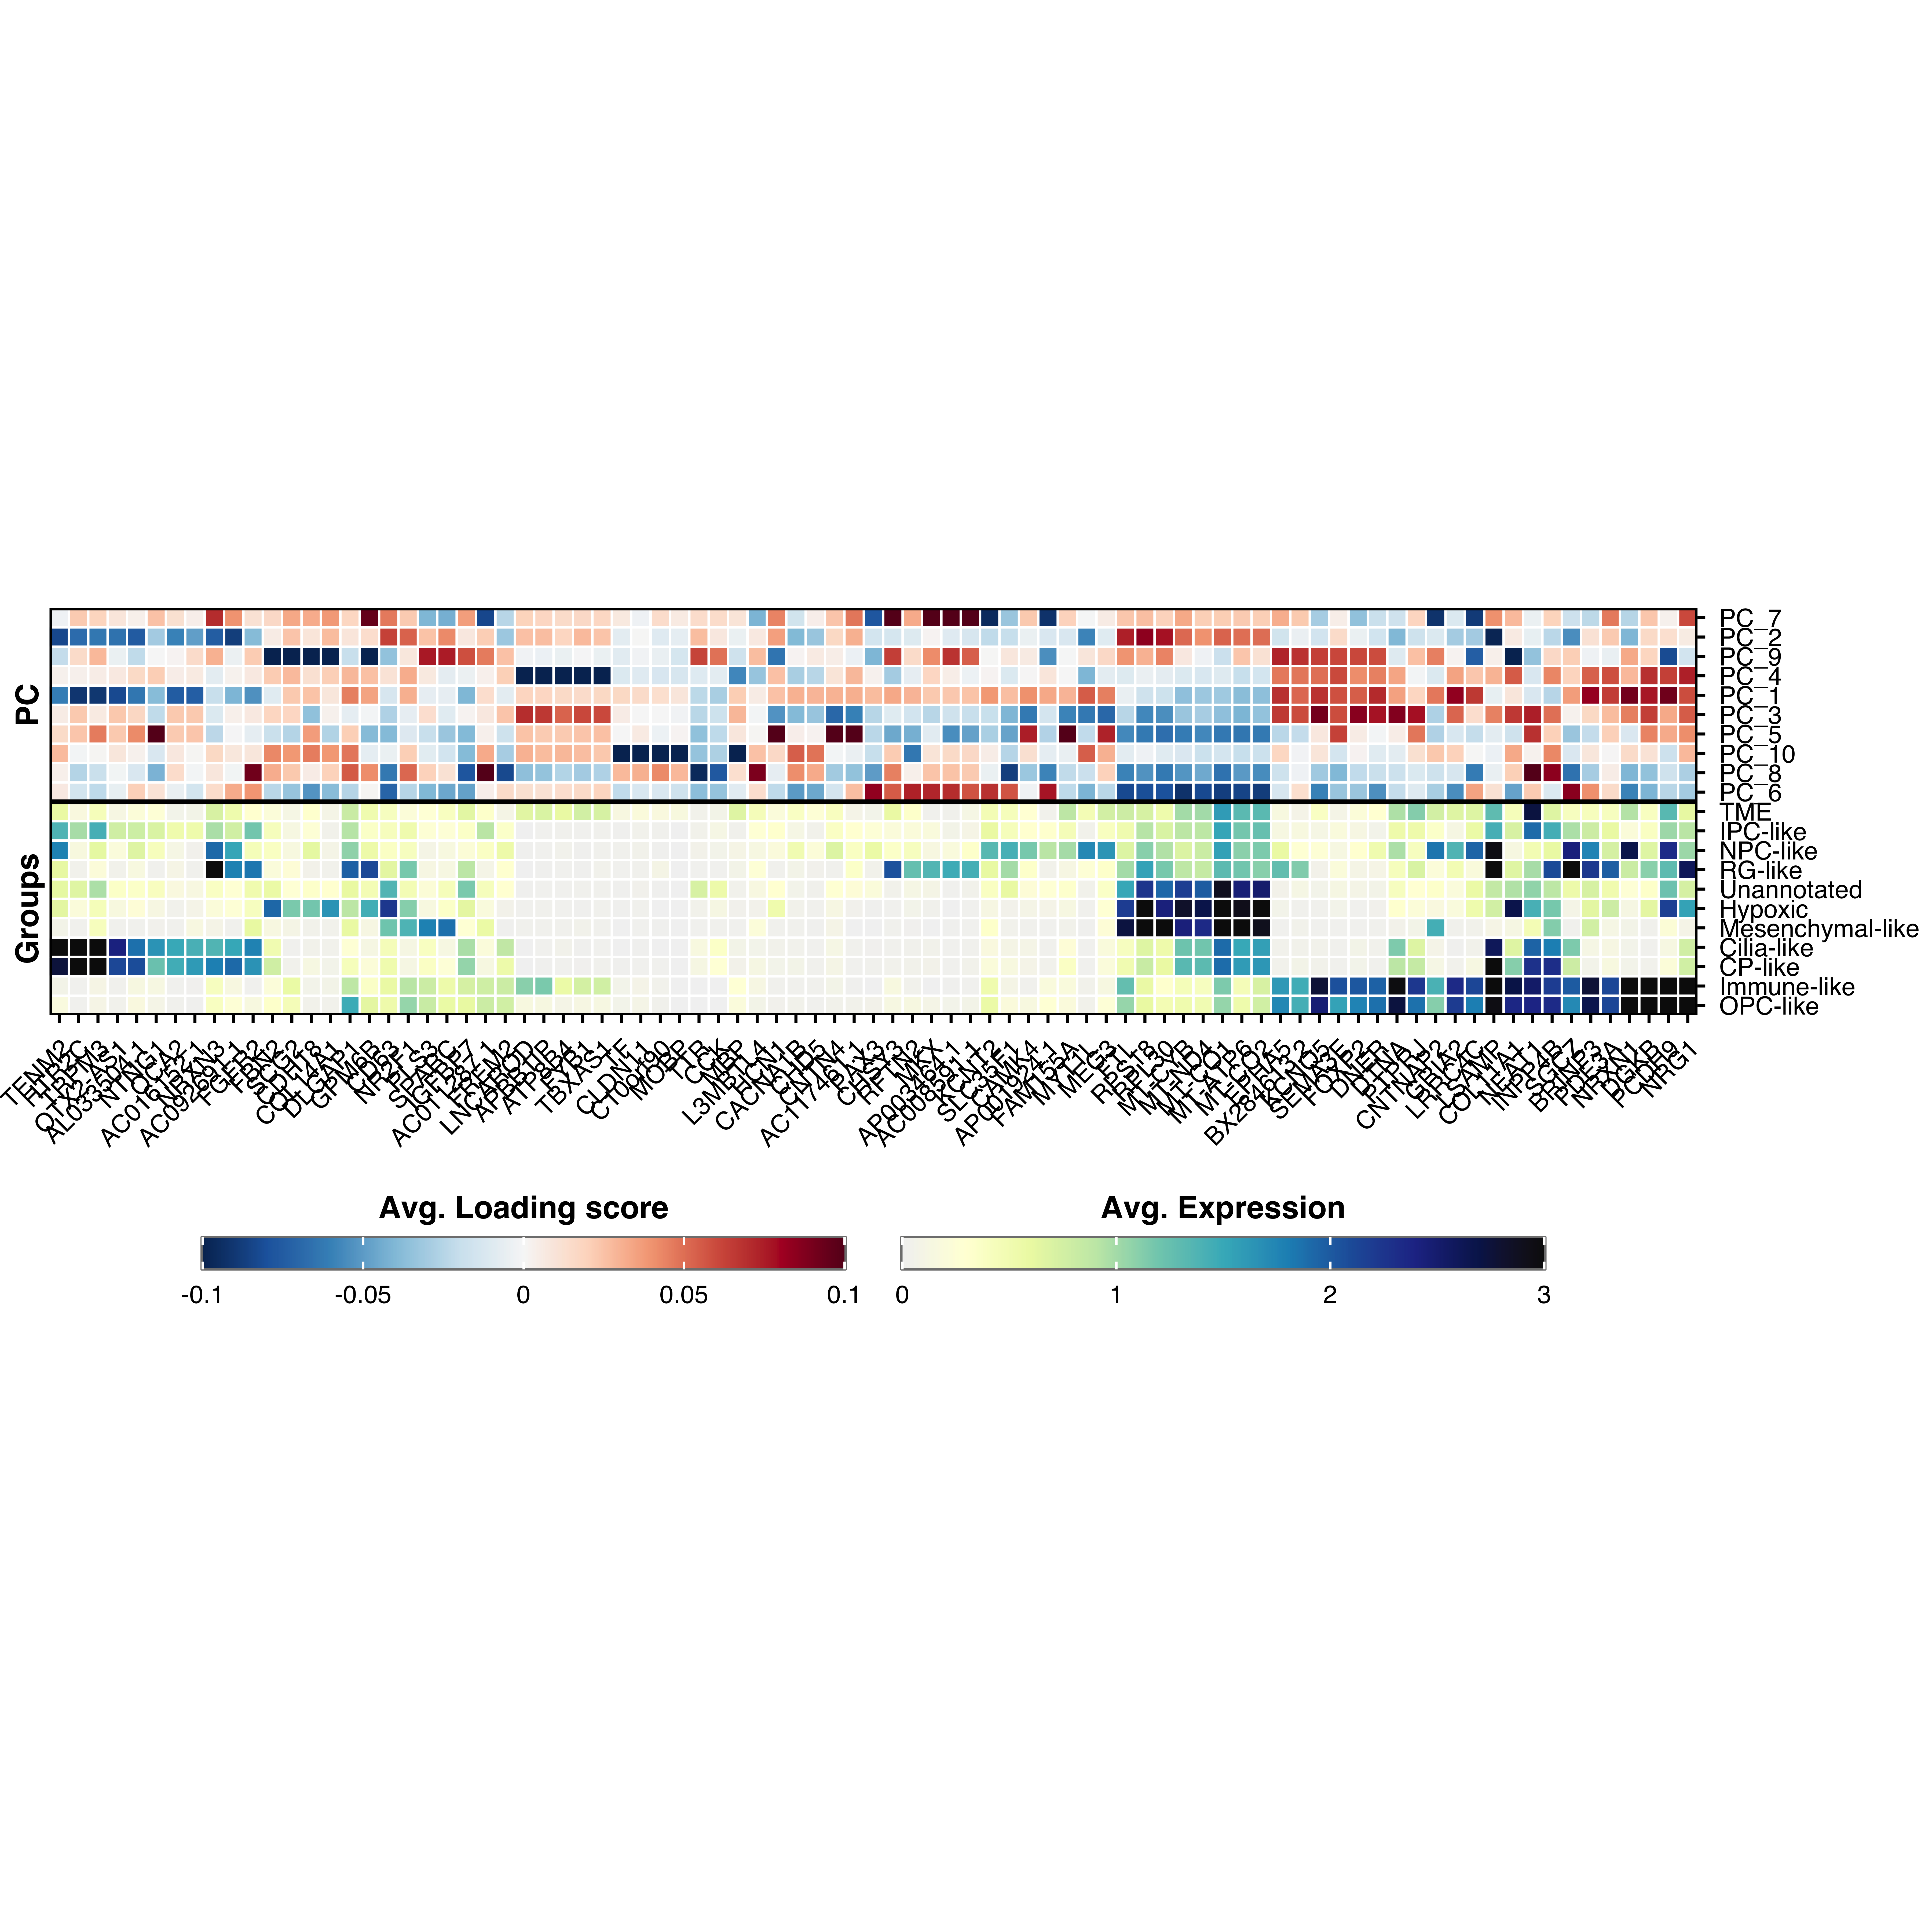
For parameters shared across many functions (color palettes, typography, legend styling, grid), see Shared features.
| Parameter | Description | Default |
|---|---|---|
dims |
PCs to include | 1:10 |
top_loadings |
Top/bottom genes per PC | 5 |
subsample |
Number of cells to sample | NA |
| Parameter | Description | Default |
|---|---|---|
min.cutoff.loadings |
Min loading score |
NA (q=0.05) |
max.cutoff.loadings |
Max loading score |
NA (q=0.95) |
min.cutoff.expression |
Min expression |
NA (0) |
max.cutoff.expression |
Max expression |
NA (q=0.95) |