p <- SCpubr::do_DimPlot(sample = sample)
p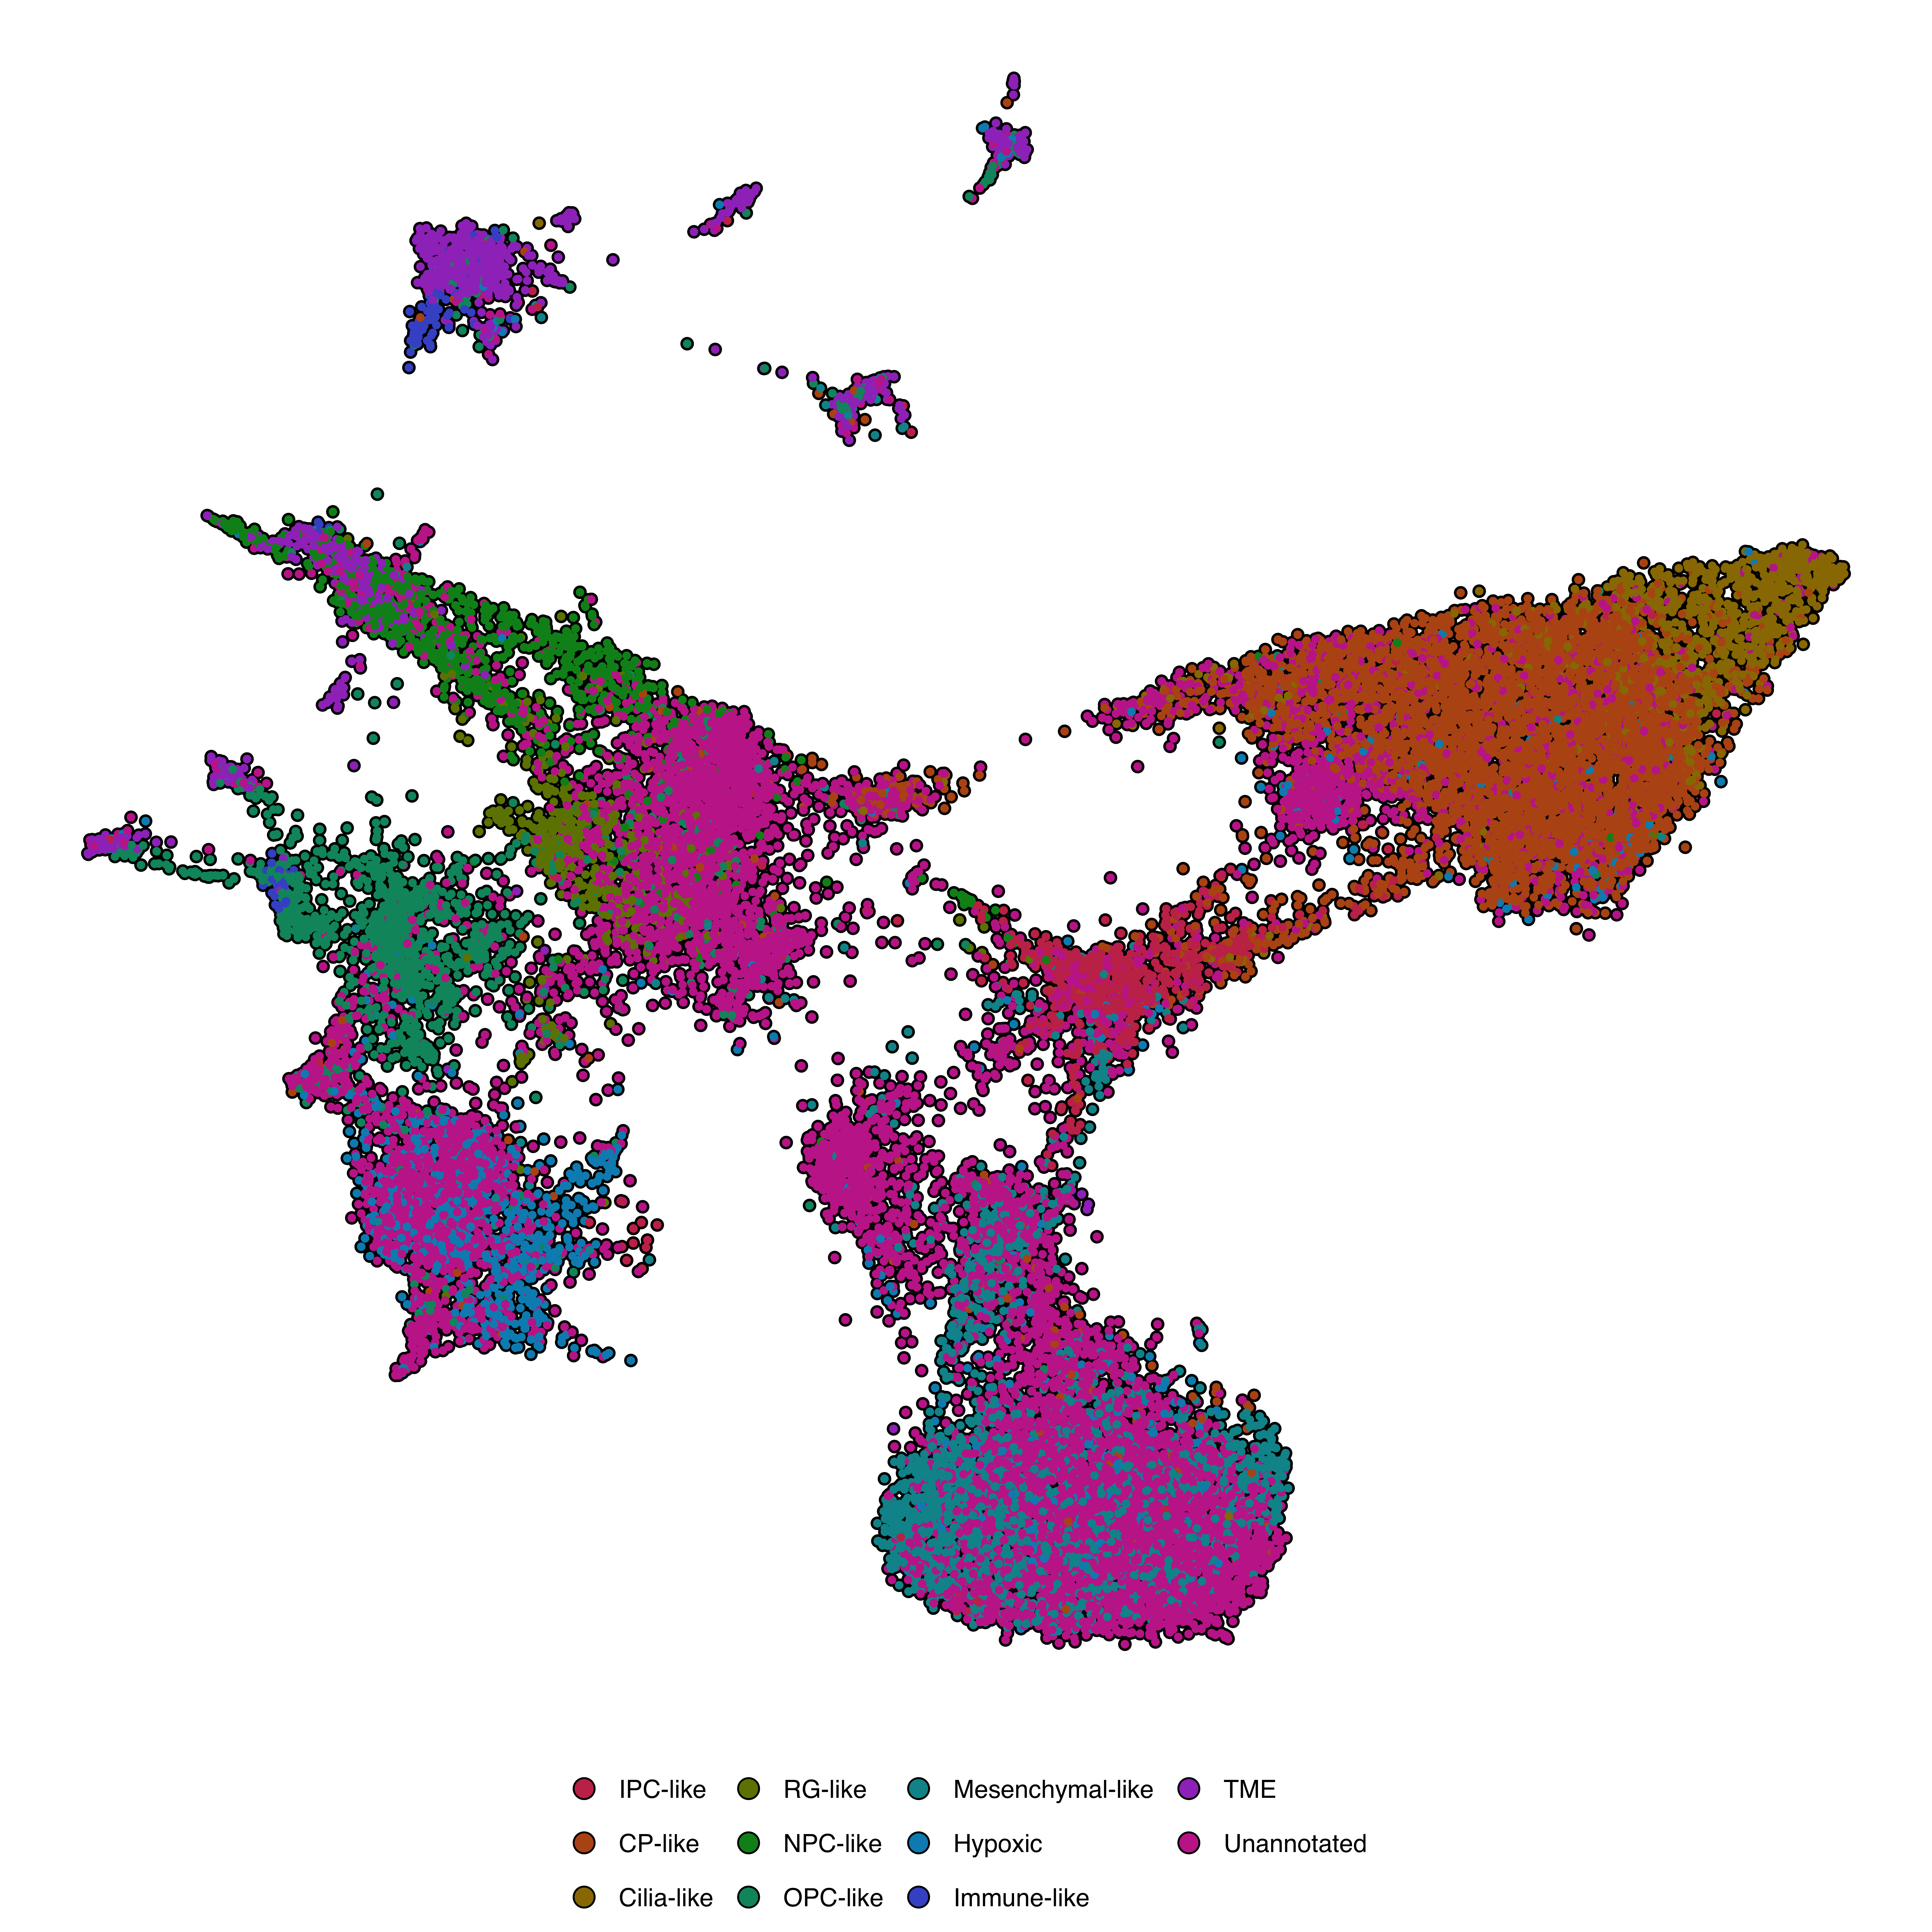
Dimensional reduction plots (DimPlots) are the cornerstone of single-cell visualization. They display cells in a reduced-dimension embedding (UMAP, tSNE, PCA) colored by any categorical variable—clusters, cell types, conditions, or any metadata.
Generate a DimPlot with default settings. Cells are colored by the active identity (Idents(sample)):
p <- SCpubr::do_DimPlot(sample = sample)
p
By default, axes are hidden for a cleaner look. To show them:
p <- SCpubr::do_DimPlot(sample = sample,
                        plot.axes = TRUE)
p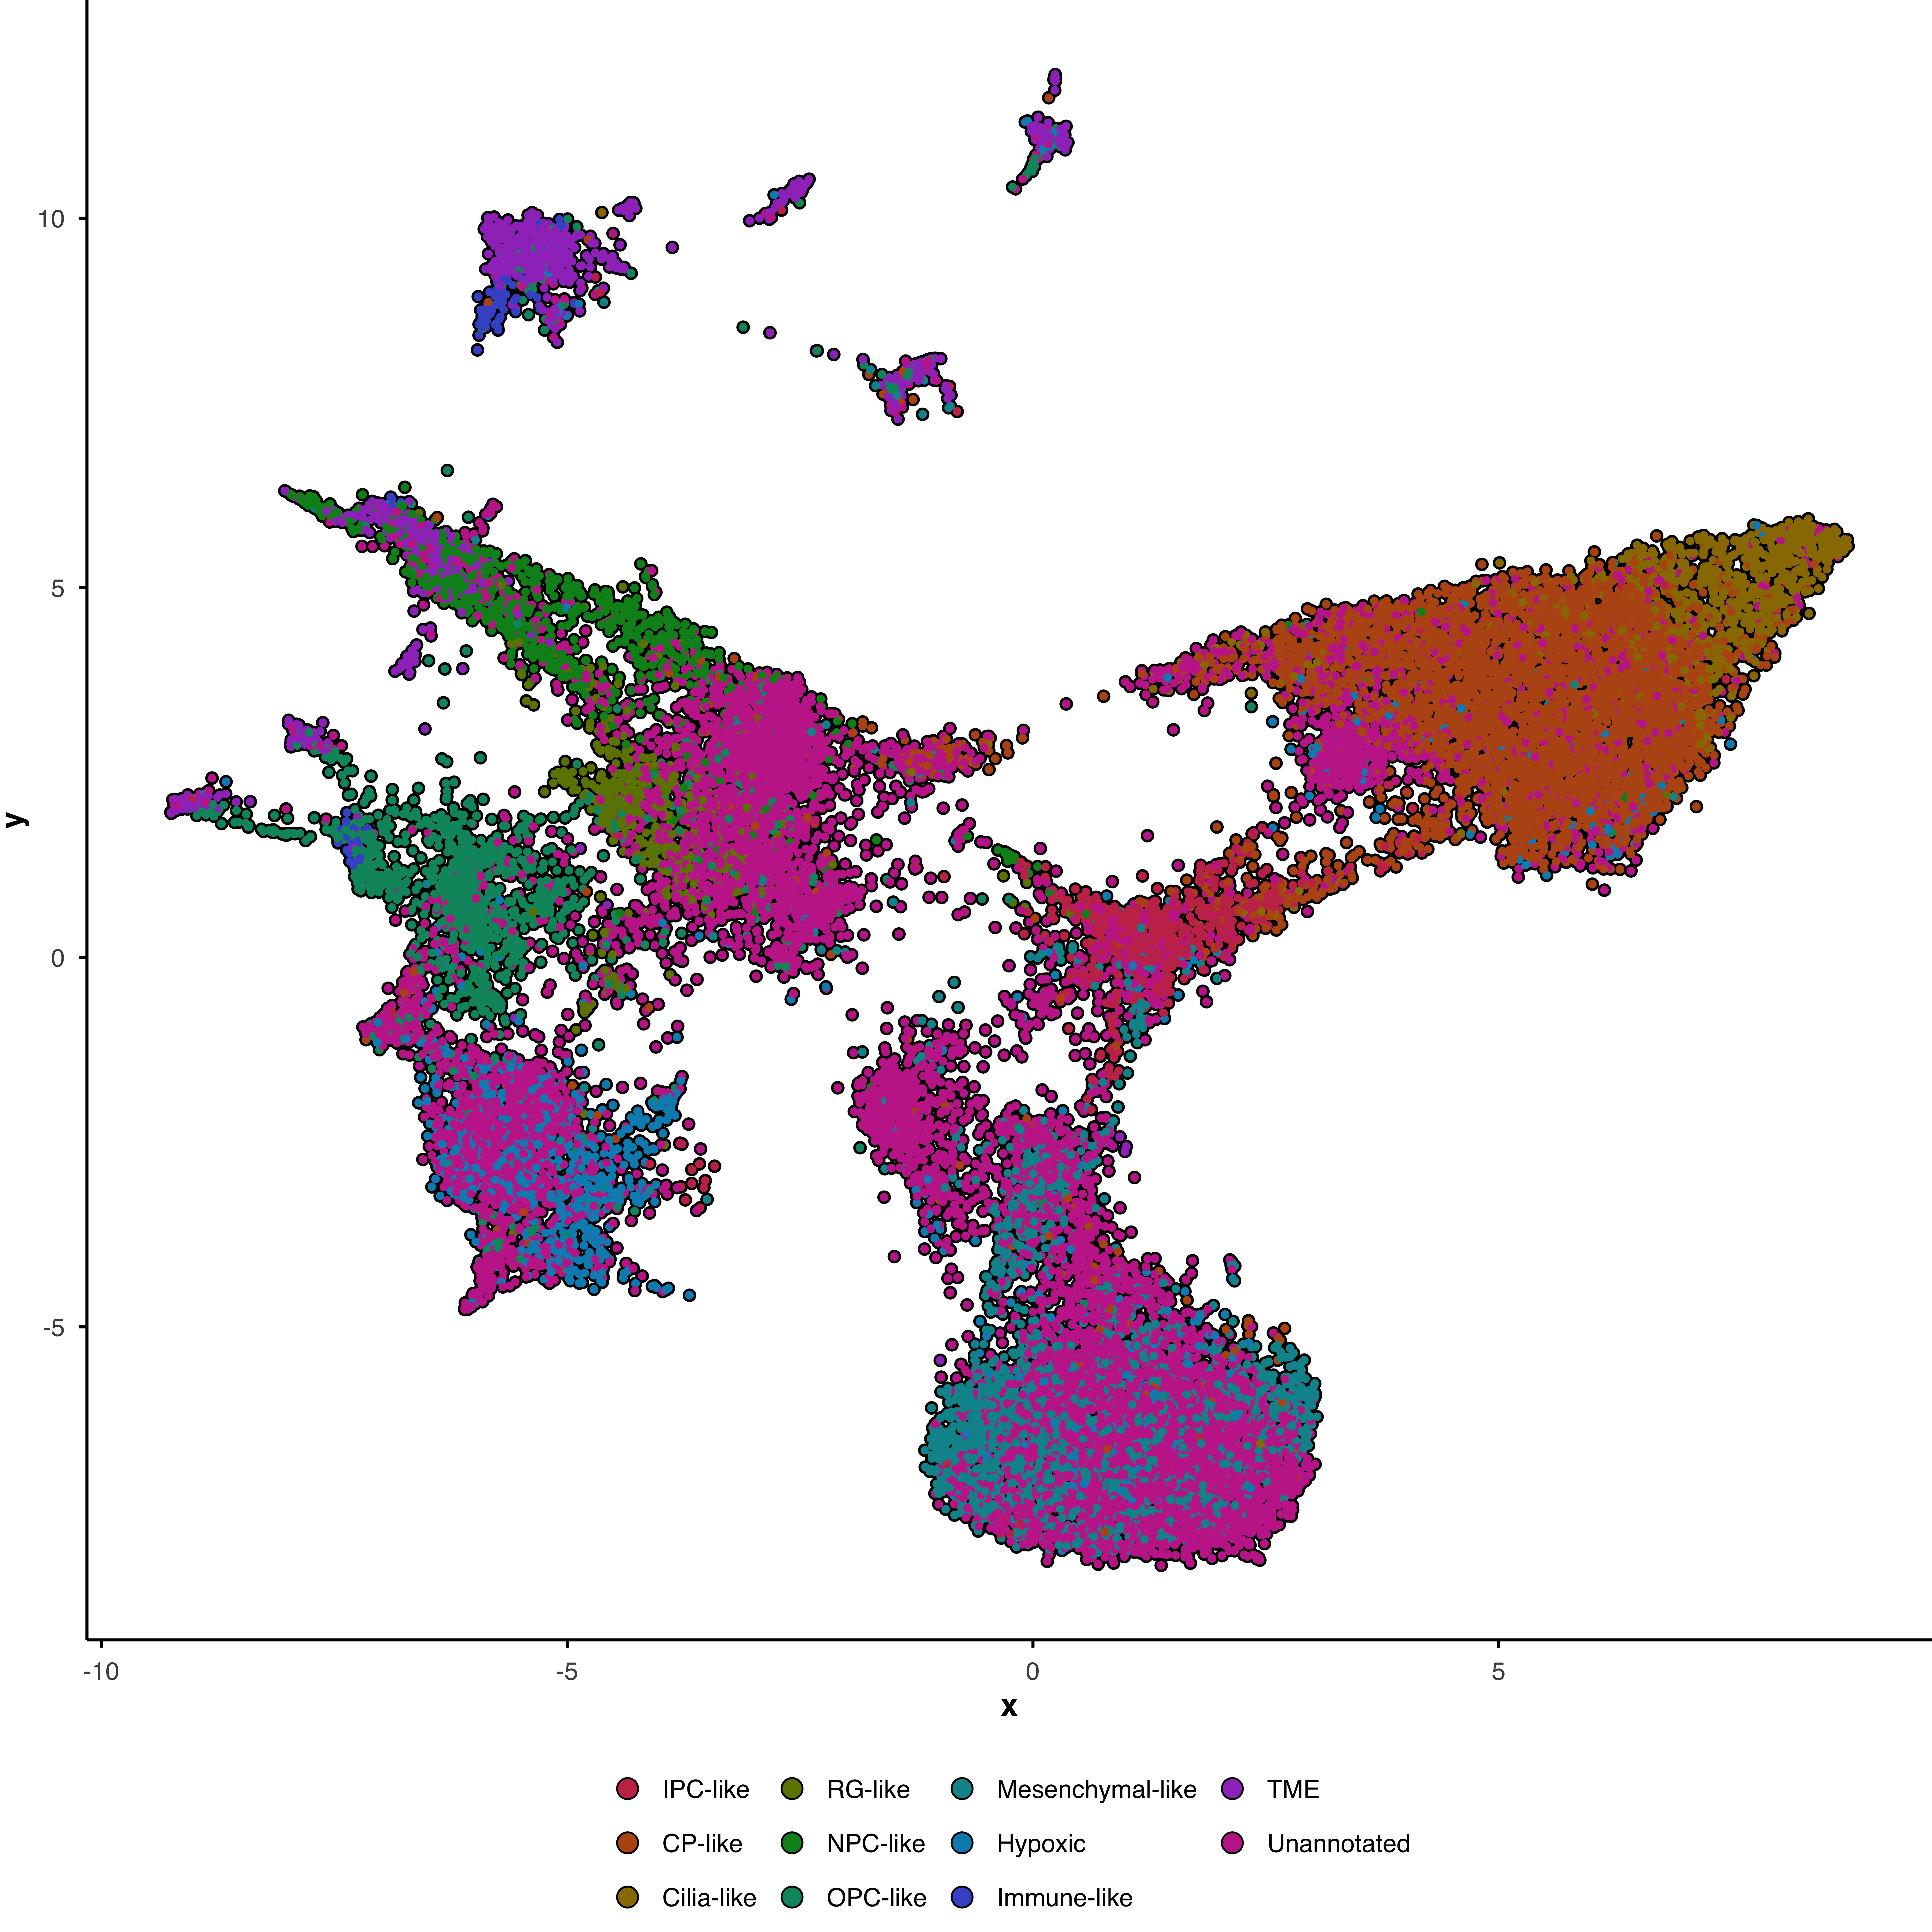
Color cells by any metadata column using group.by:
p <- SCpubr::do_DimPlot(sample = sample,
                        group.by = "subtype")
p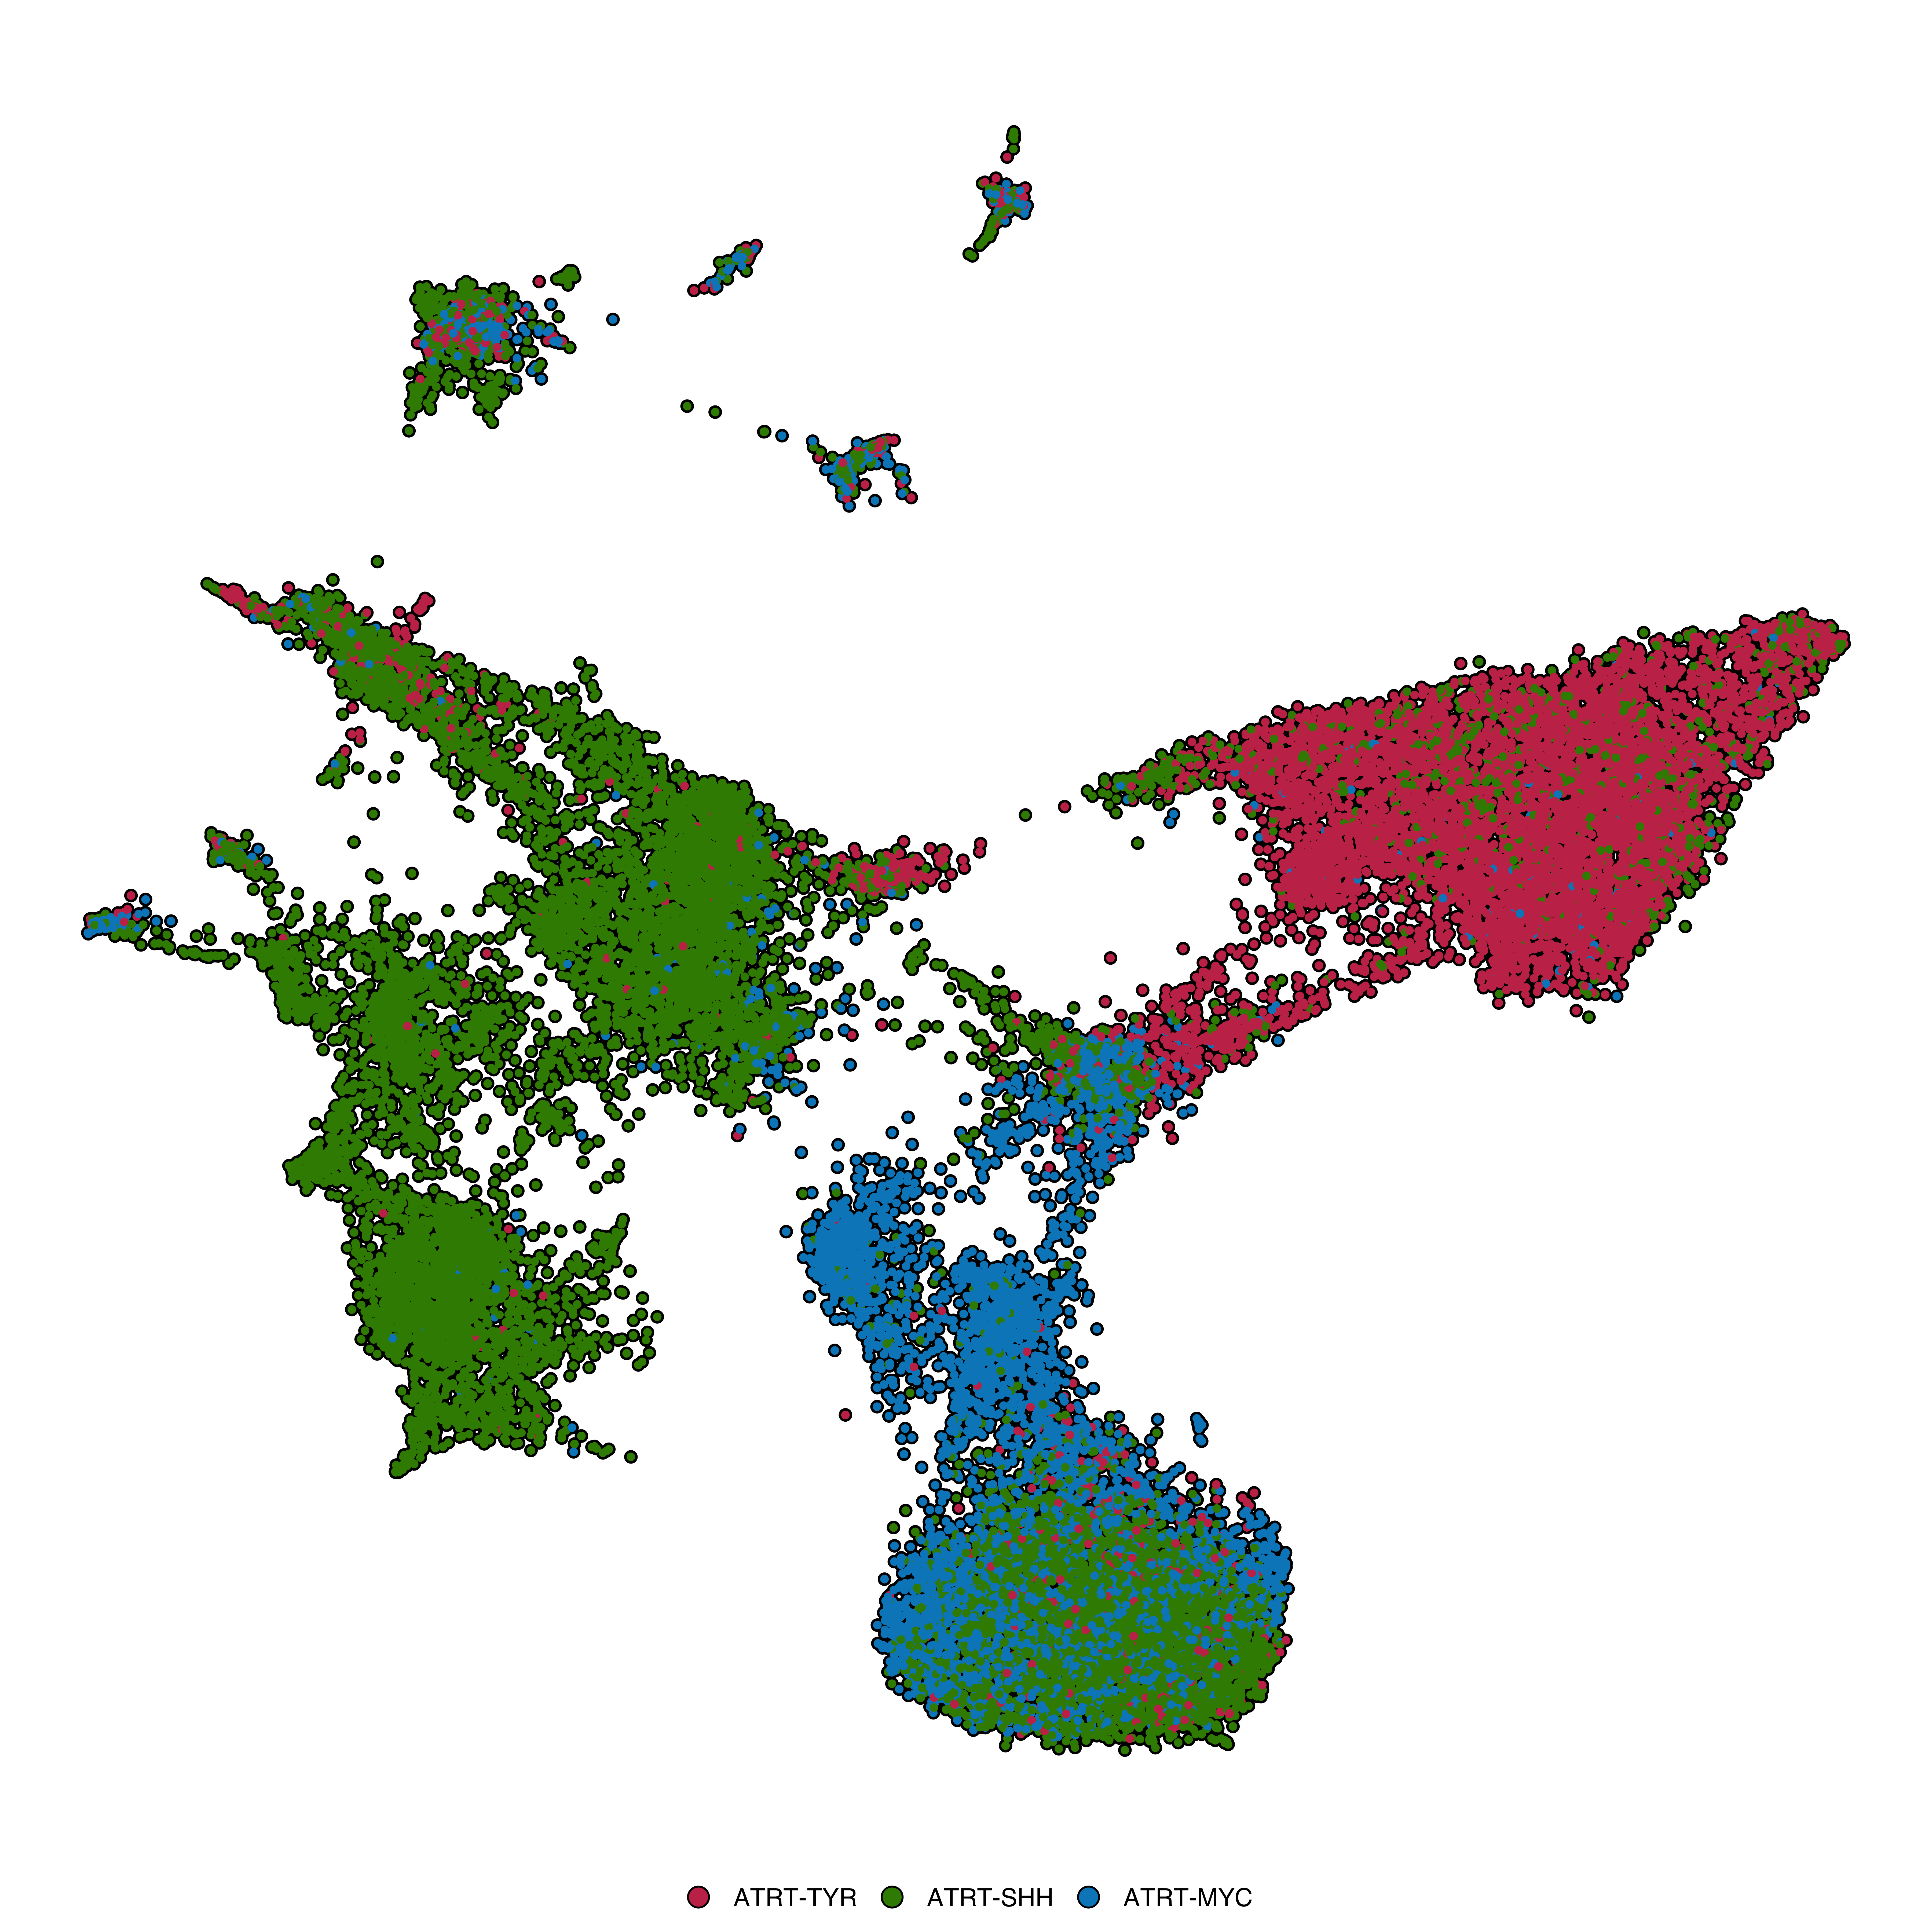
Create separate panels for each value of a variable:
p <- SCpubr::do_DimPlot(sample = sample,
                        split.by = "subtype",
                        ncol = 3)
p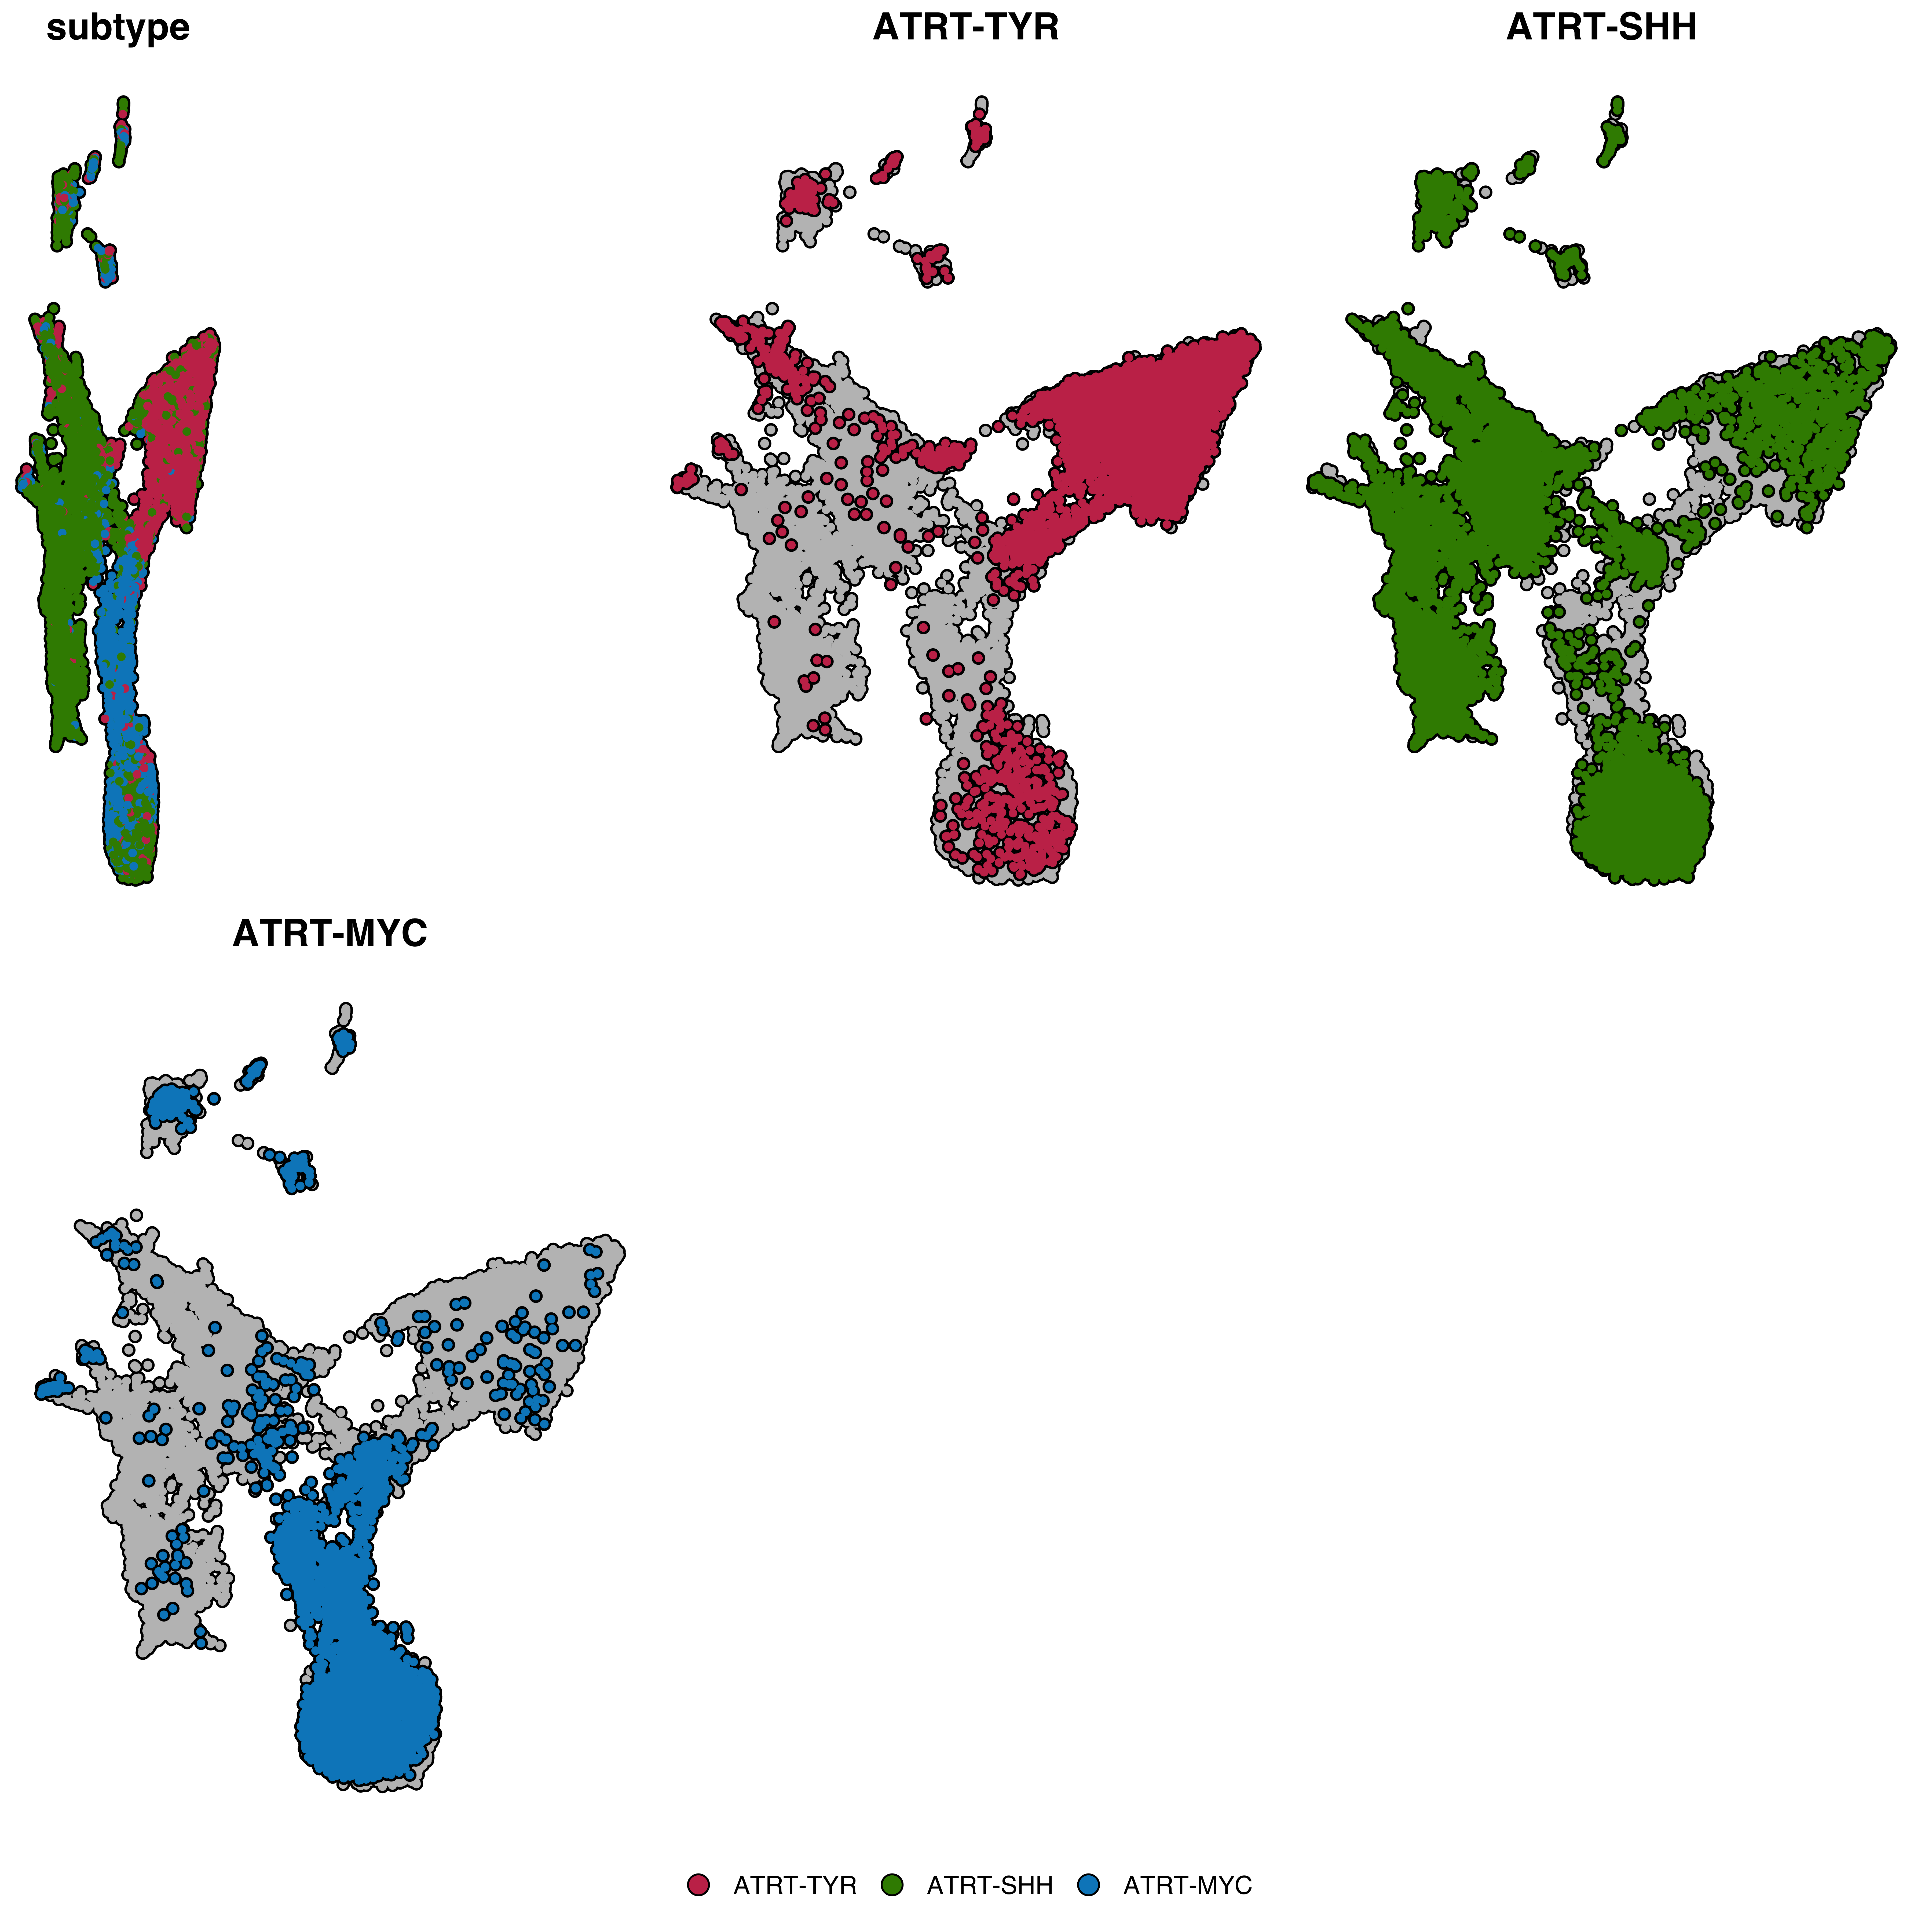
Note: the error in the first plot is currently being reviewed.
A combined overview panel is automatically added. Control this with split.by.combined:
# Without the combined panel
p <- SCpubr::do_DimPlot(sample = sample,
                        split.by = "subtype",
                        split.by.combined = FALSE)
p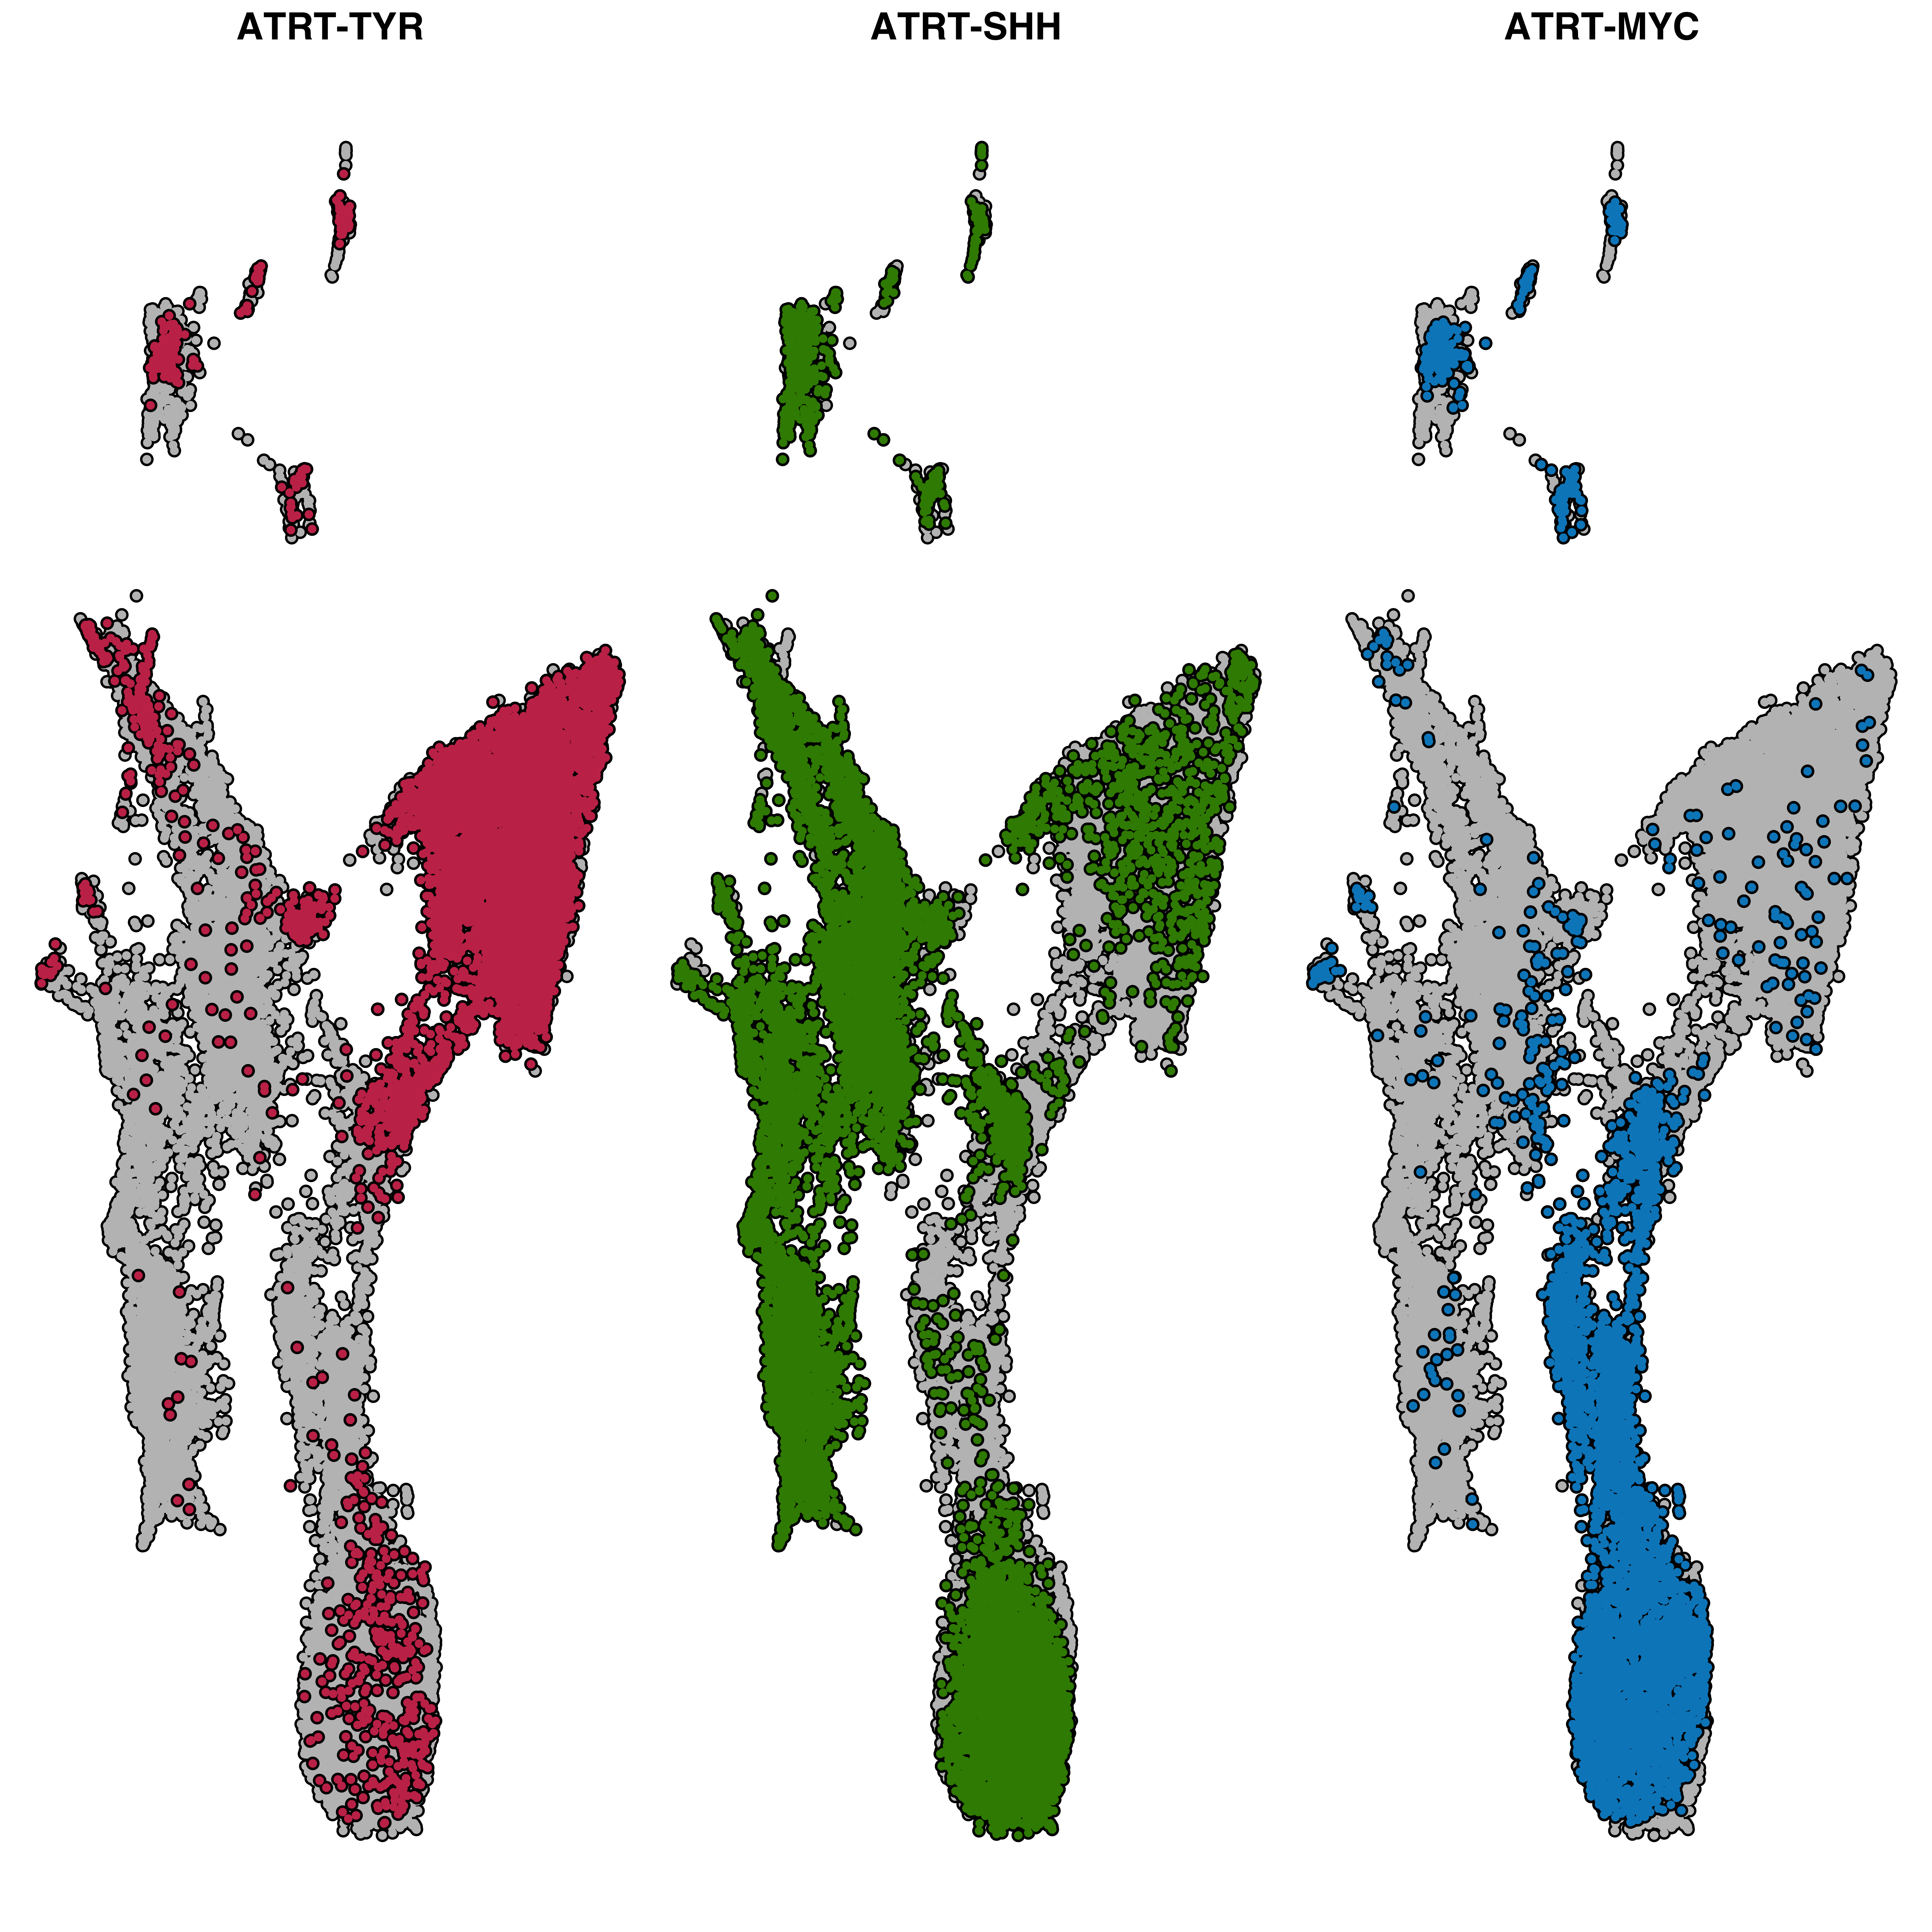
Color by one variable, split by another:
p <- SCpubr::do_DimPlot(sample = sample,
                        group.by = "subtype",
                        split.by = "technology")
p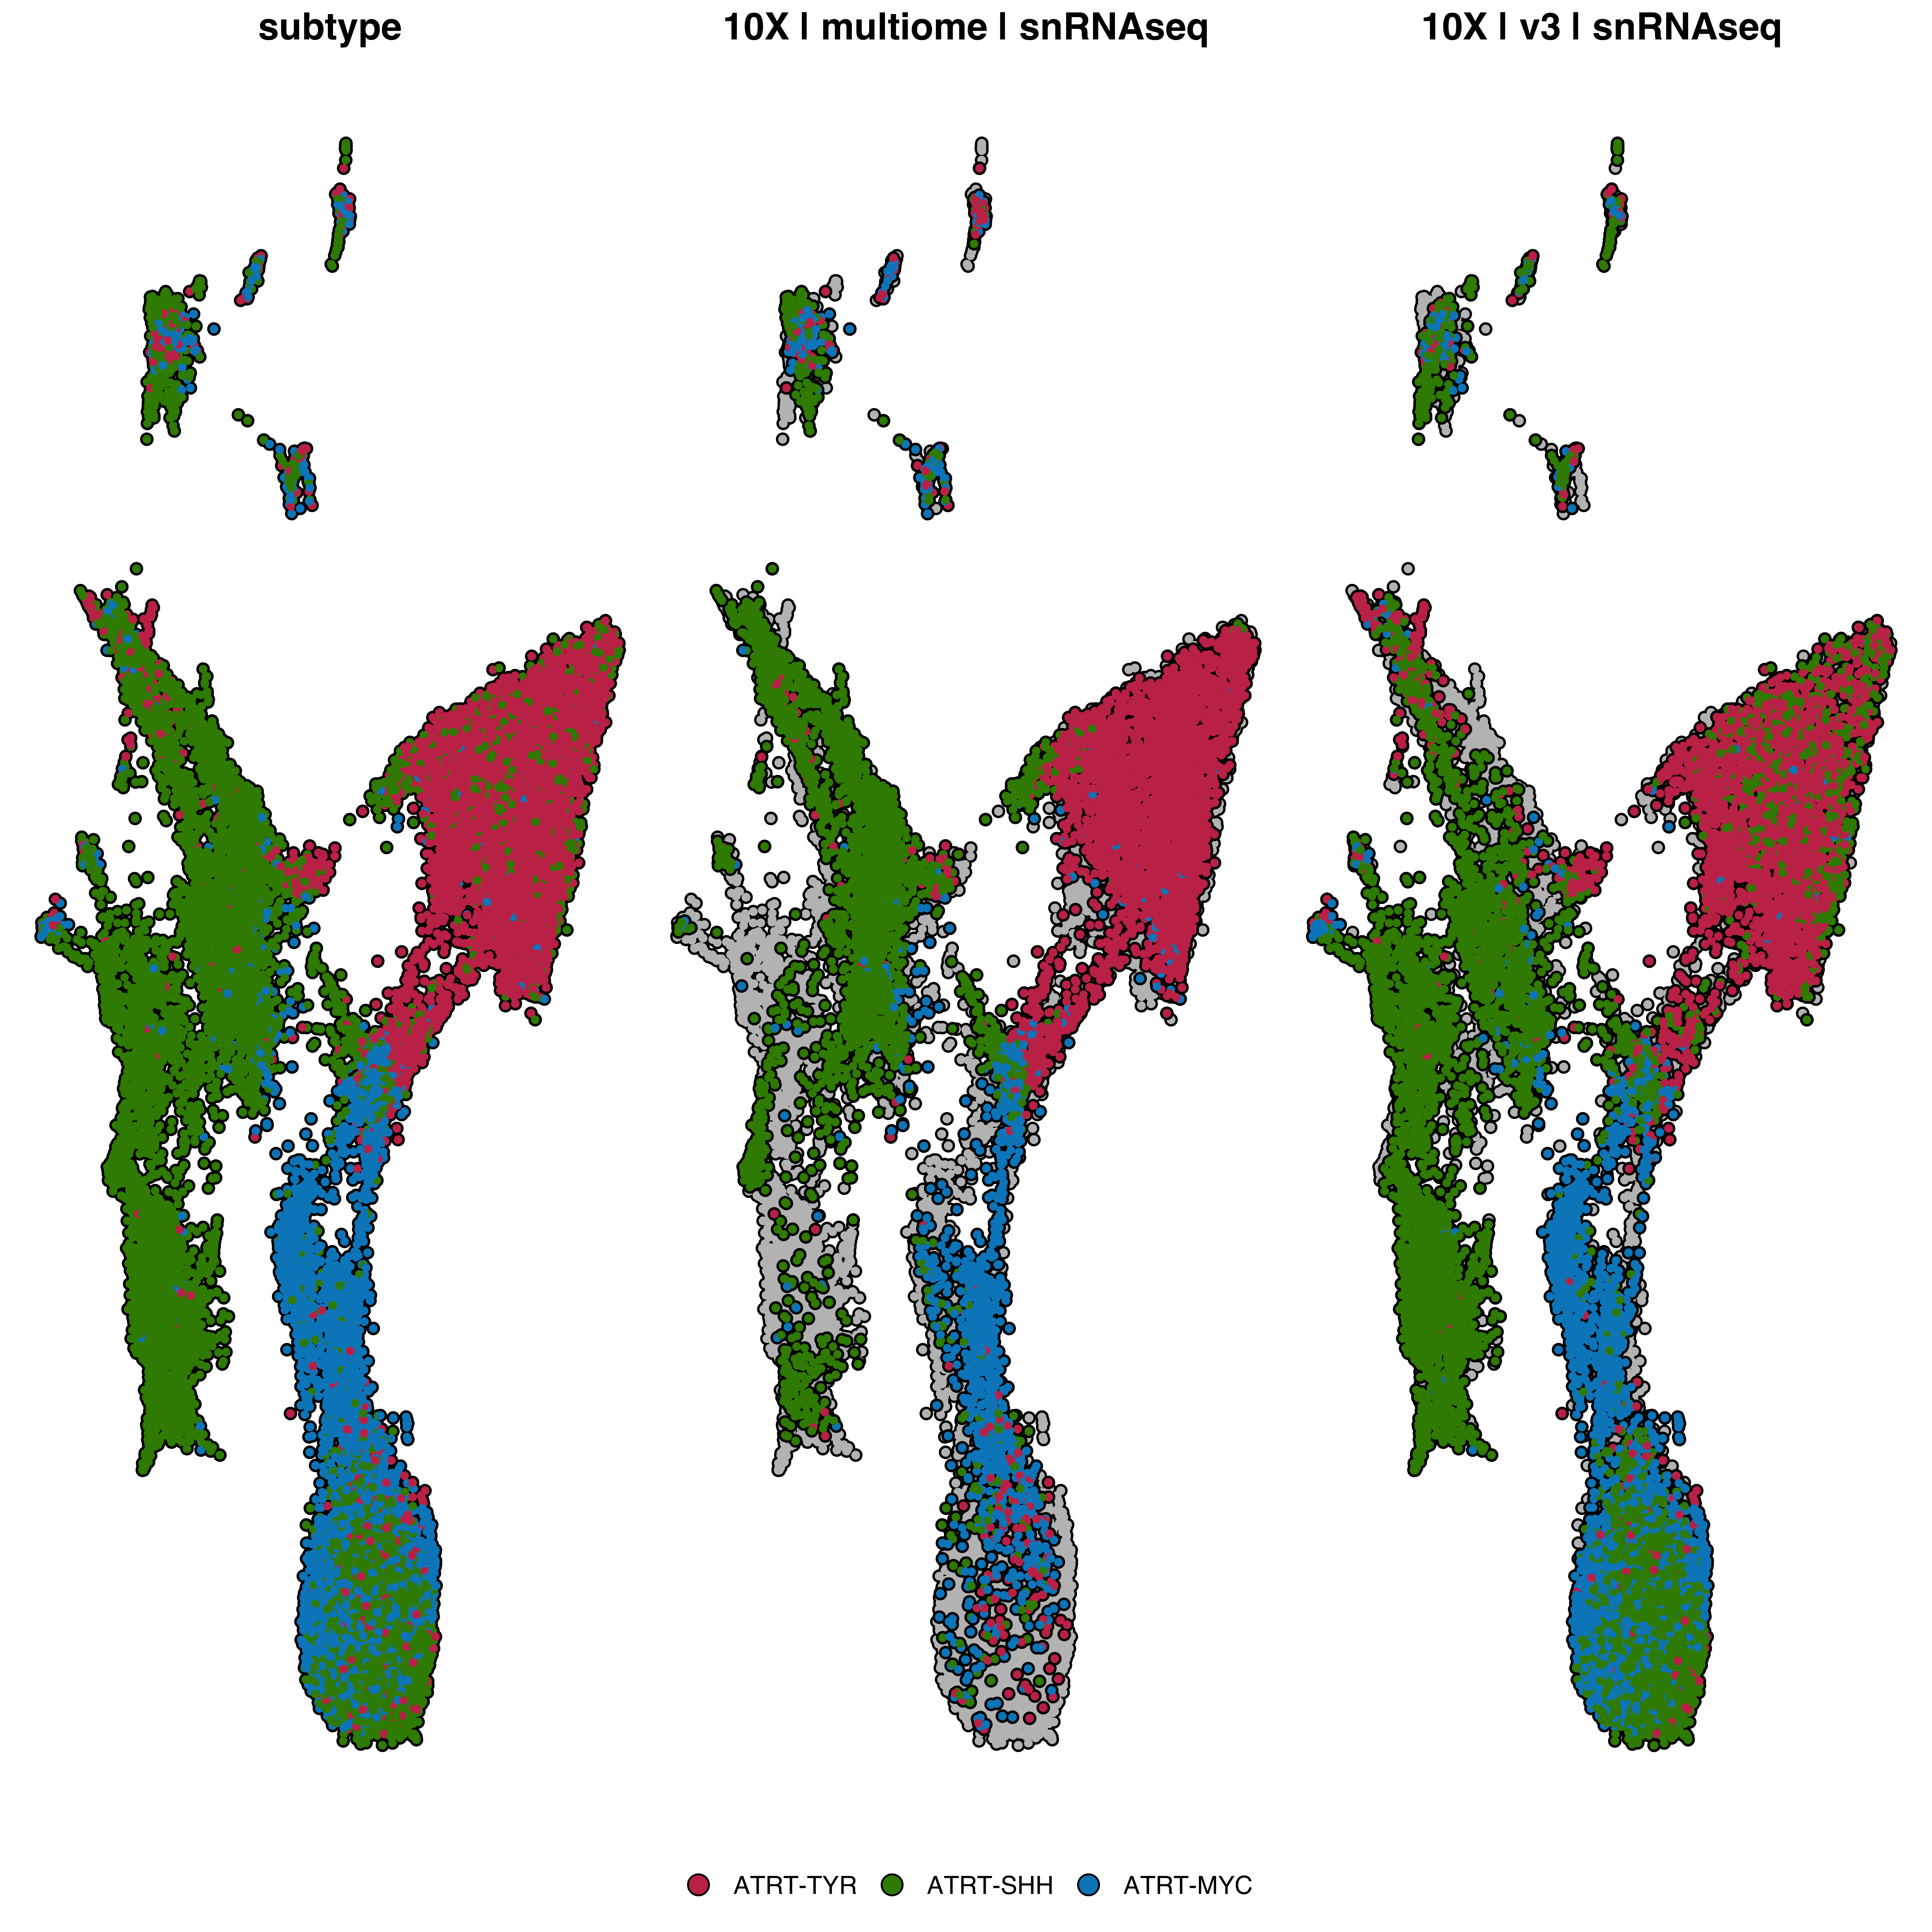
Show only specific groups while preserving the full UMAP silhouette:
# Only show clusters 0, 2, and 5
p <- SCpubr::do_DimPlot(sample = sample,
                        idents.keep = c("IPC-like", "Cilia-like", "NPC-like", "OPC-like", "Mesenchymal-like"))
p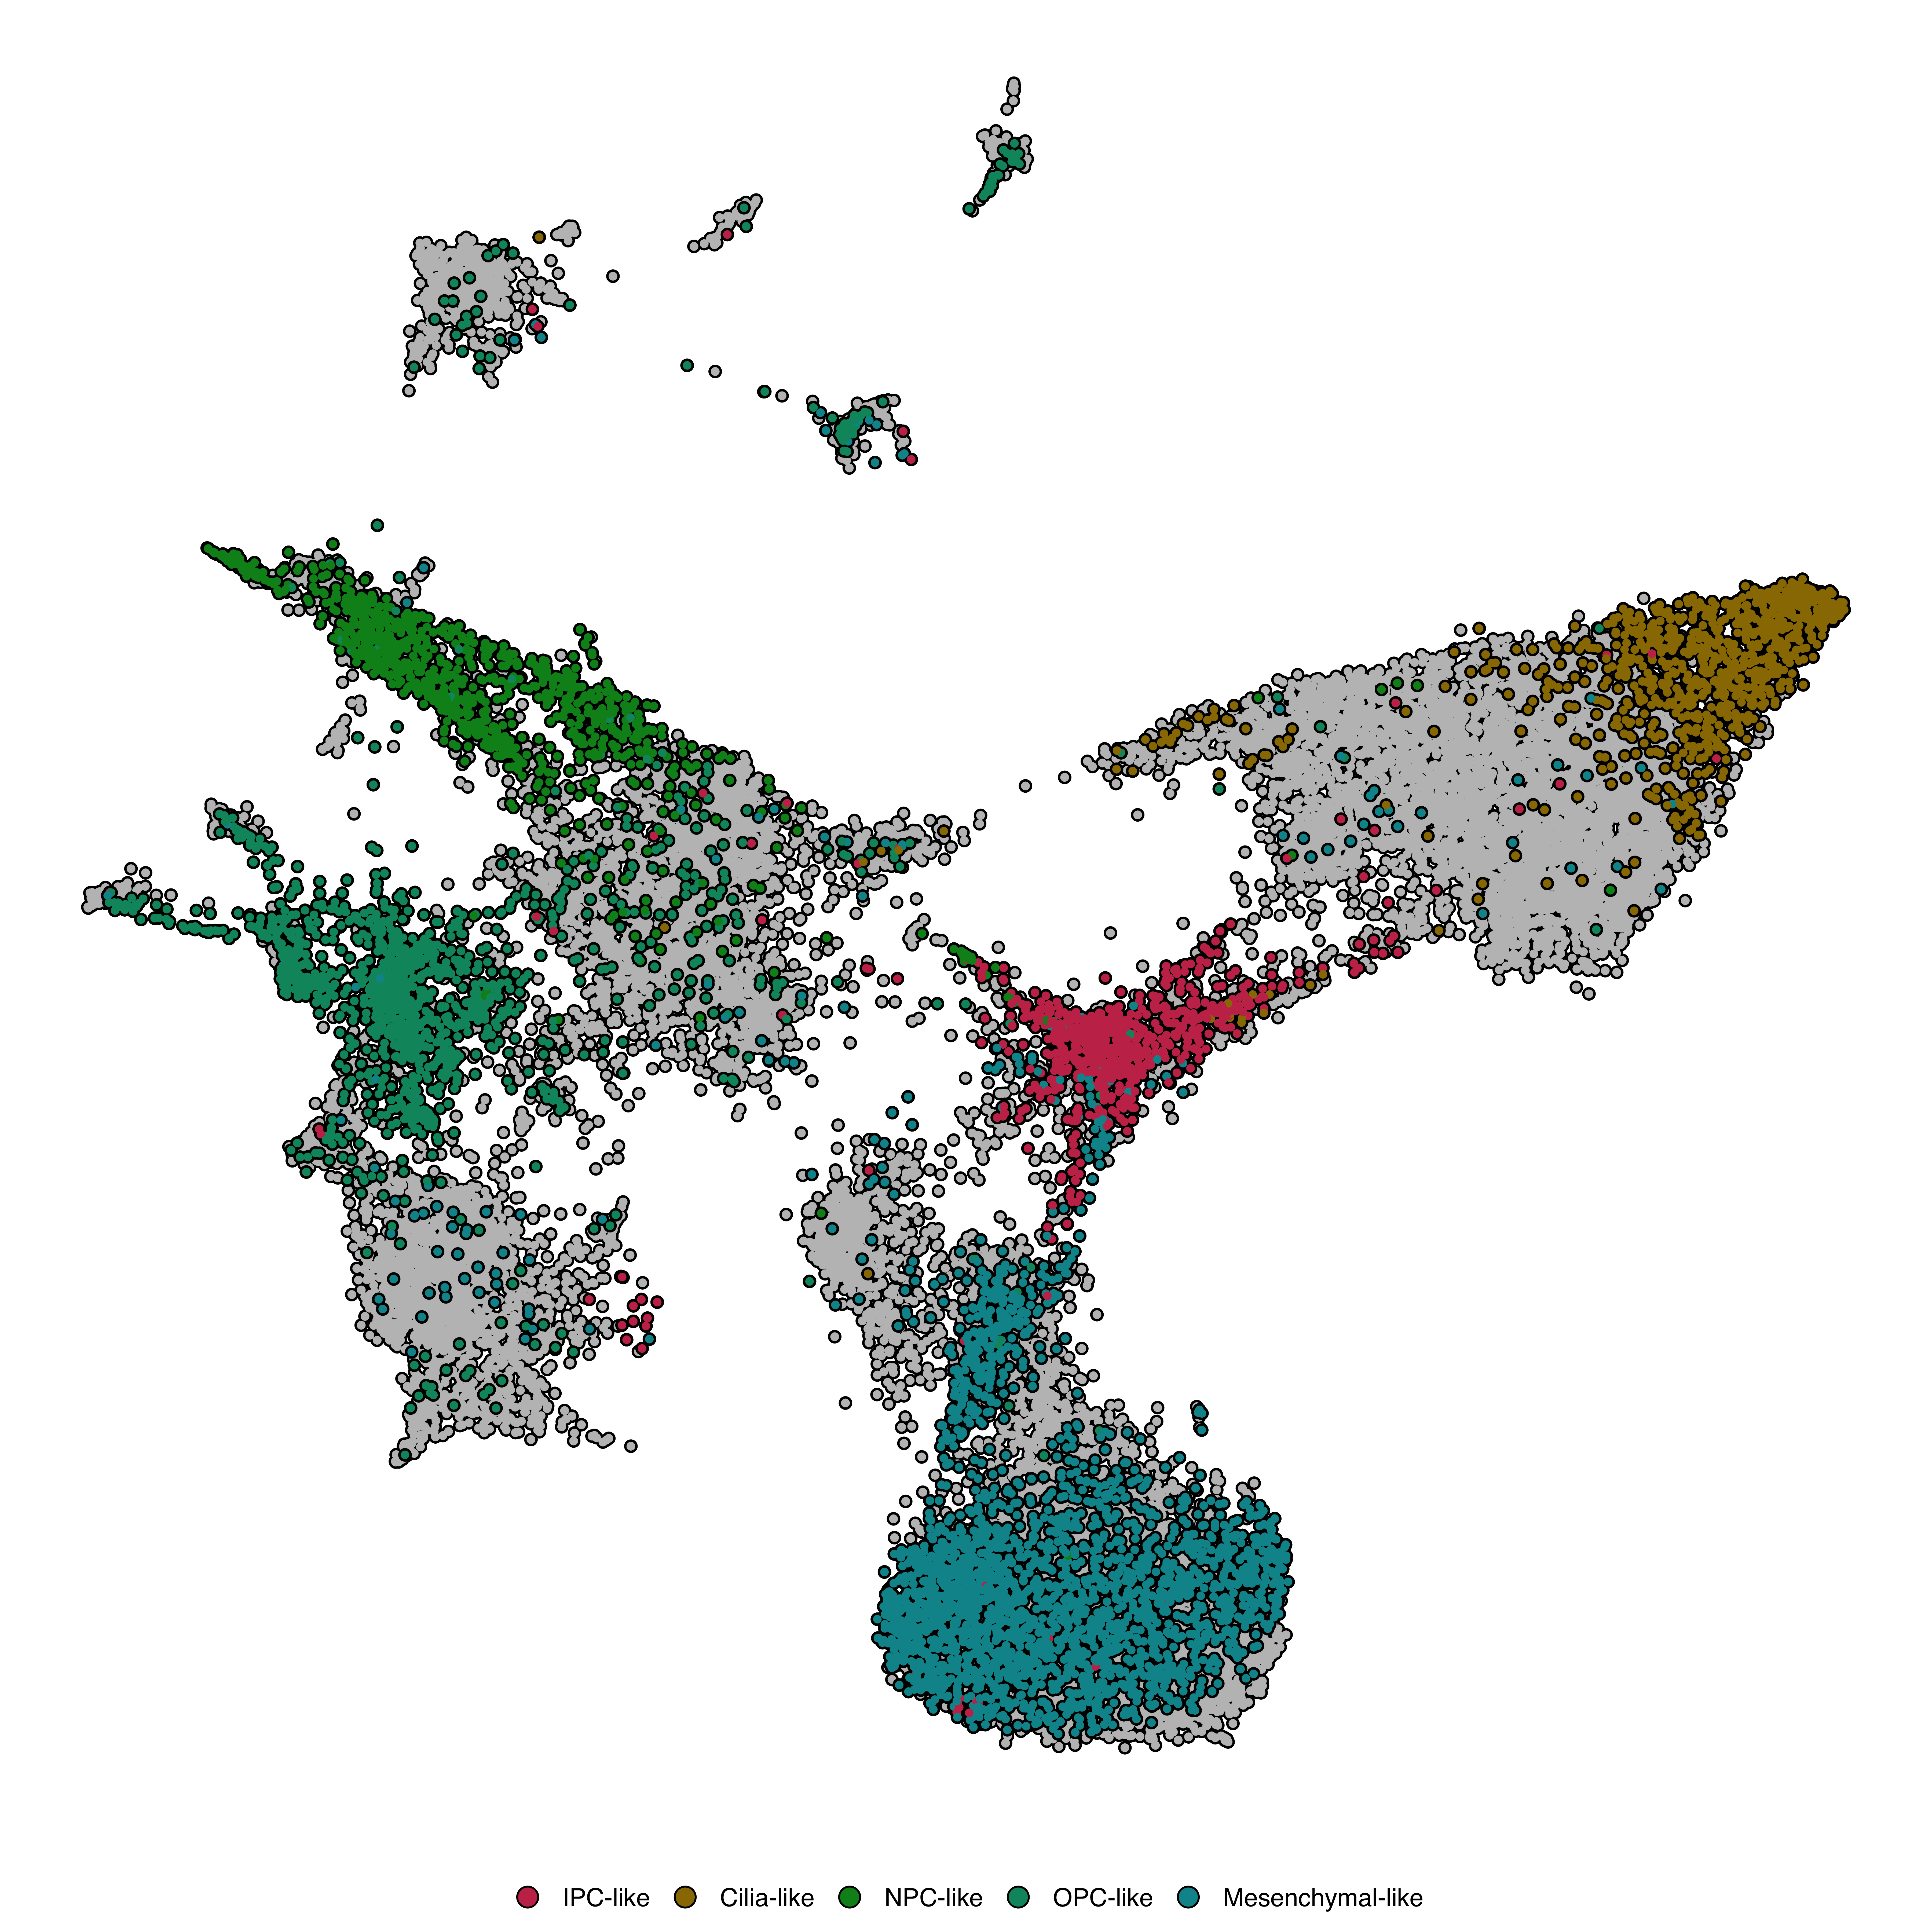
This is preferable to subsetting the Seurat object, as it retains context from all cells.
Add labels directly on clusters:
p <- SCpubr::do_DimPlot(sample = sample,
                        label = TRUE)
p
| Parameter | Description | Default |
|---|---|---|
label |
Show labels | FALSE |
label.box |
Draw box around label | TRUE |
label.color |
Text color | "black" |
label.fill |
Box fill color (NULL = match cluster color) |
"white" |
label.size |
Text size | 4 |
repel |
Repel overlapping labels | FALSE |
Provide cell names to highlight:
cells.use <- sample(colnames(sample), 1500)

p <- SCpubr::do_DimPlot(sample = sample,
                        cells.highlight = cells.use)
p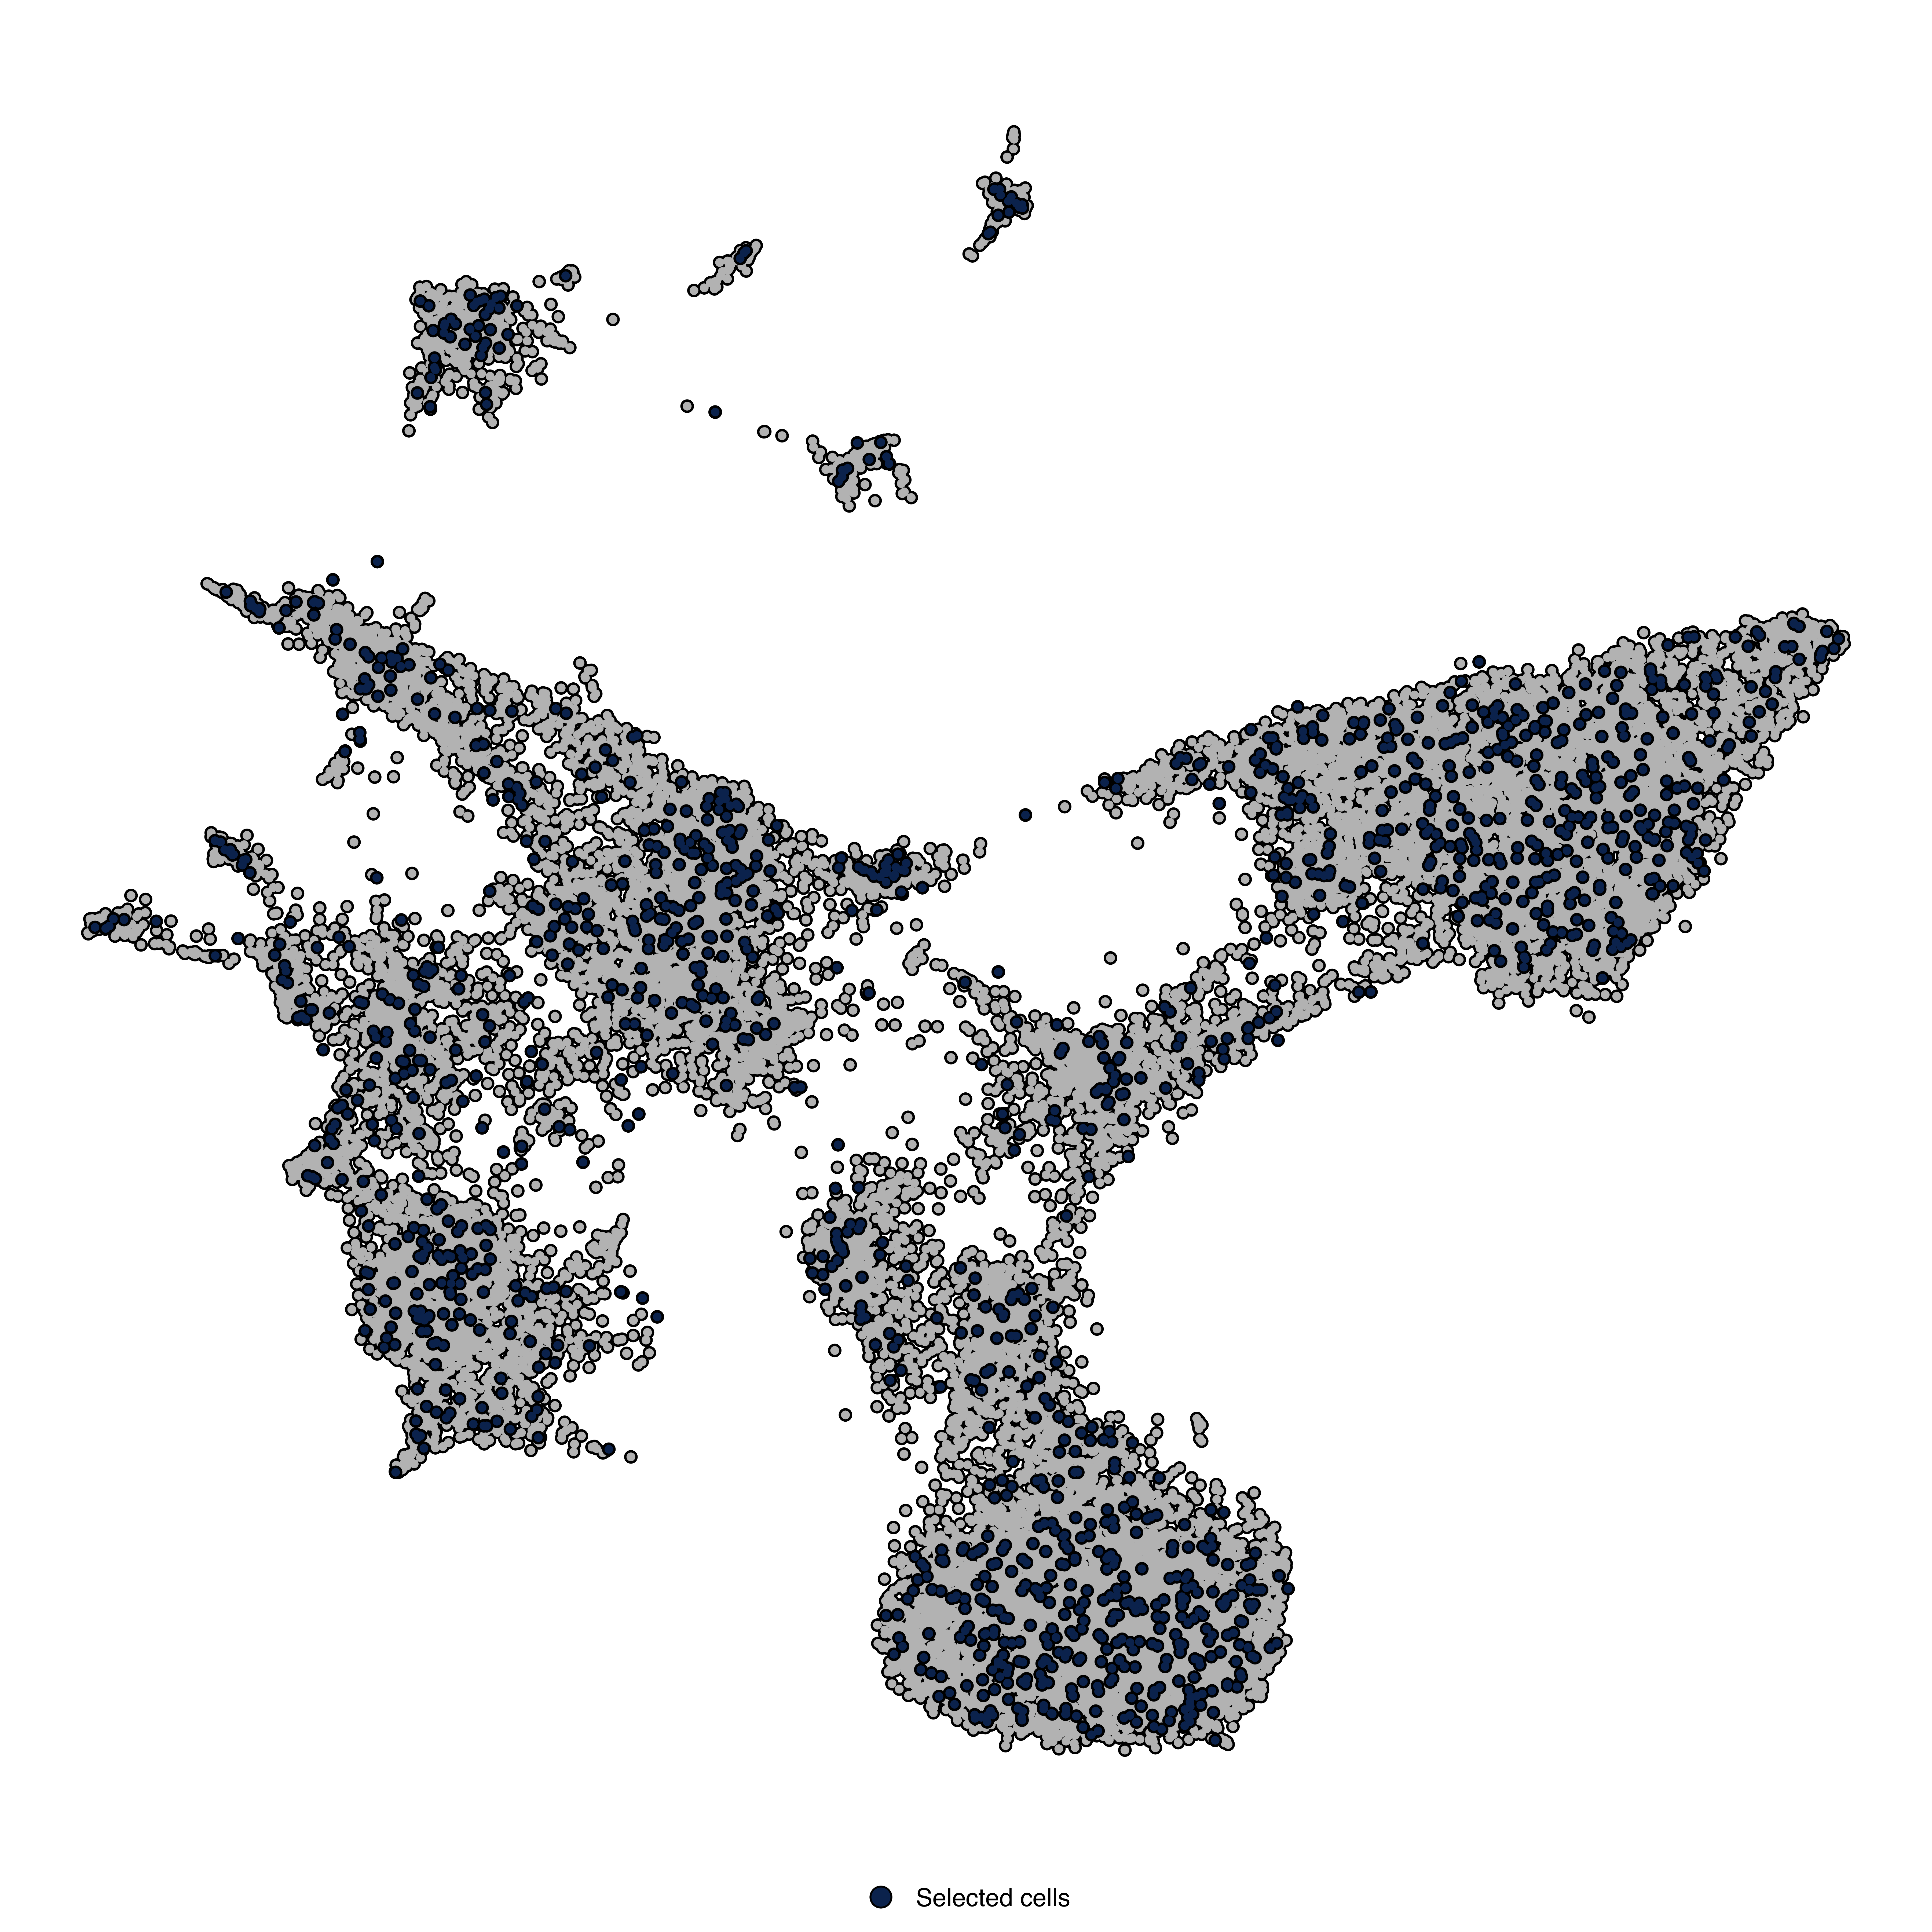
Highlight all cells belonging to specific clusters:
p <- SCpubr::do_DimPlot(sample = sample,
                        idents.highlight = c("IPC-like", "Cilia-like"))
p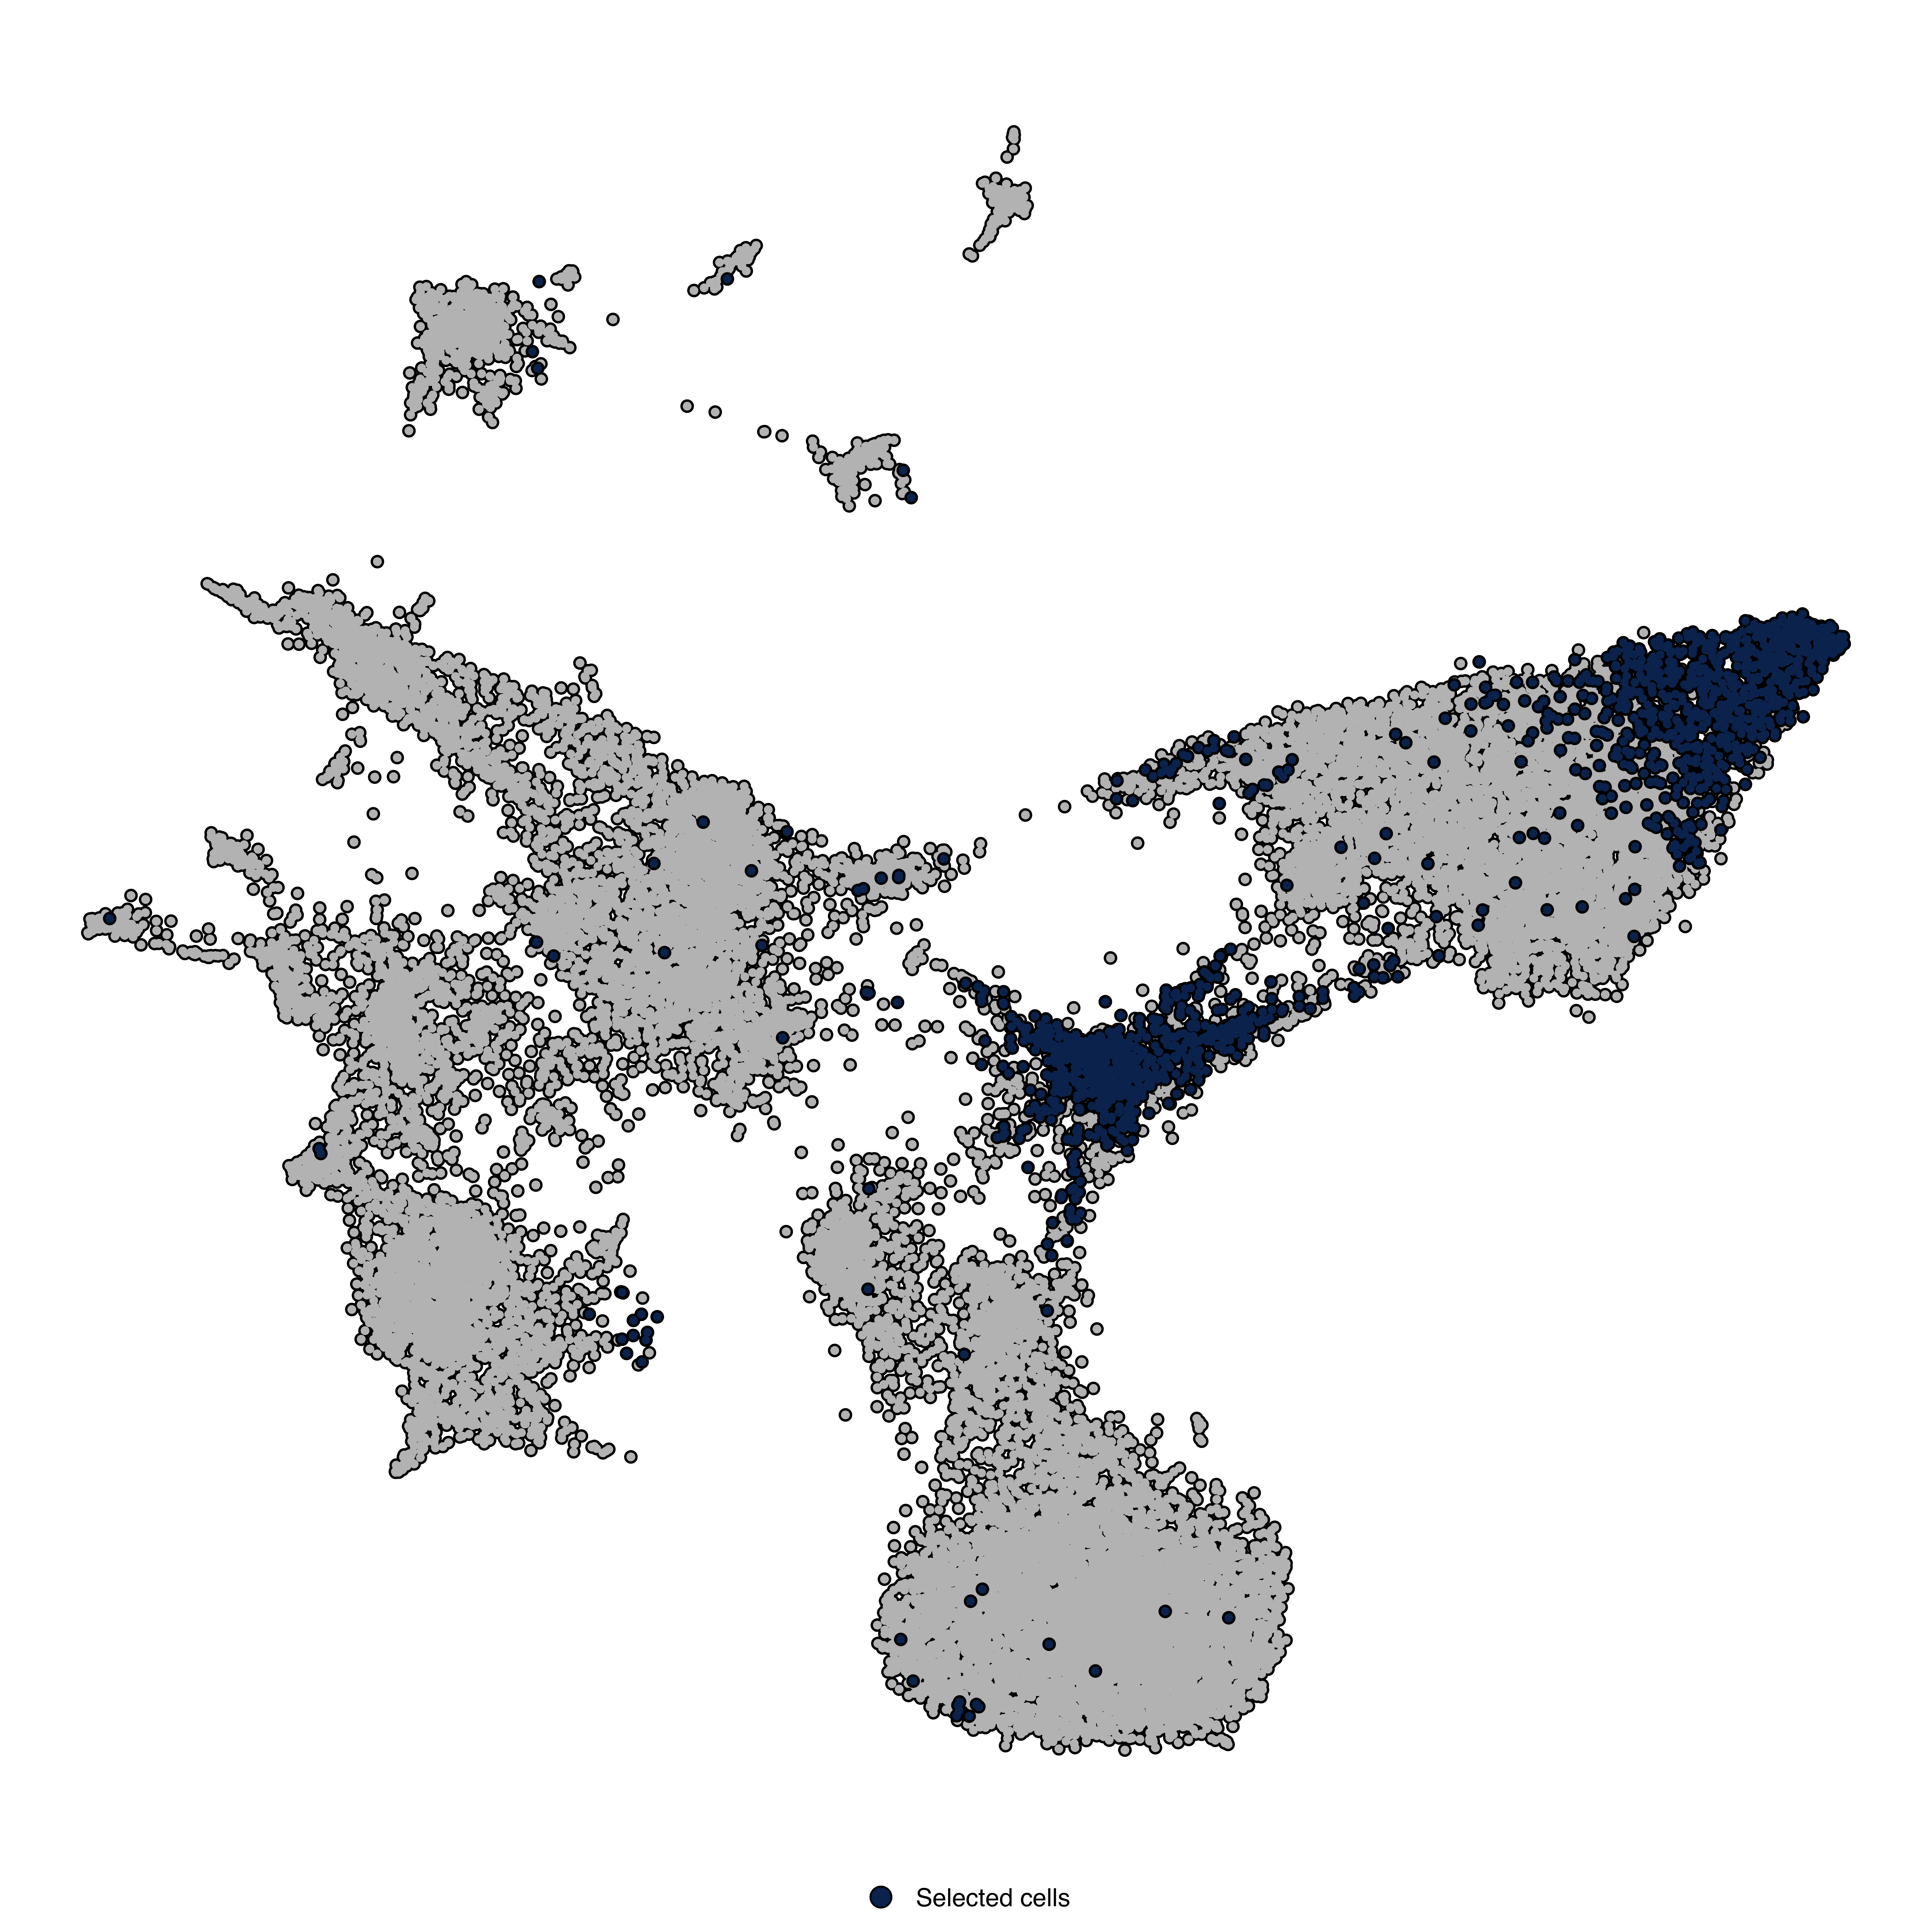
cells.highlight and idents.highlight cannot be used with group.by or split.by.
Overlay density contour lines:
p <- SCpubr::do_DimPlot(sample = sample,
                        plot_density_contour = TRUE,
                        contour.color = "grey90",
                        contour.position = "top")
p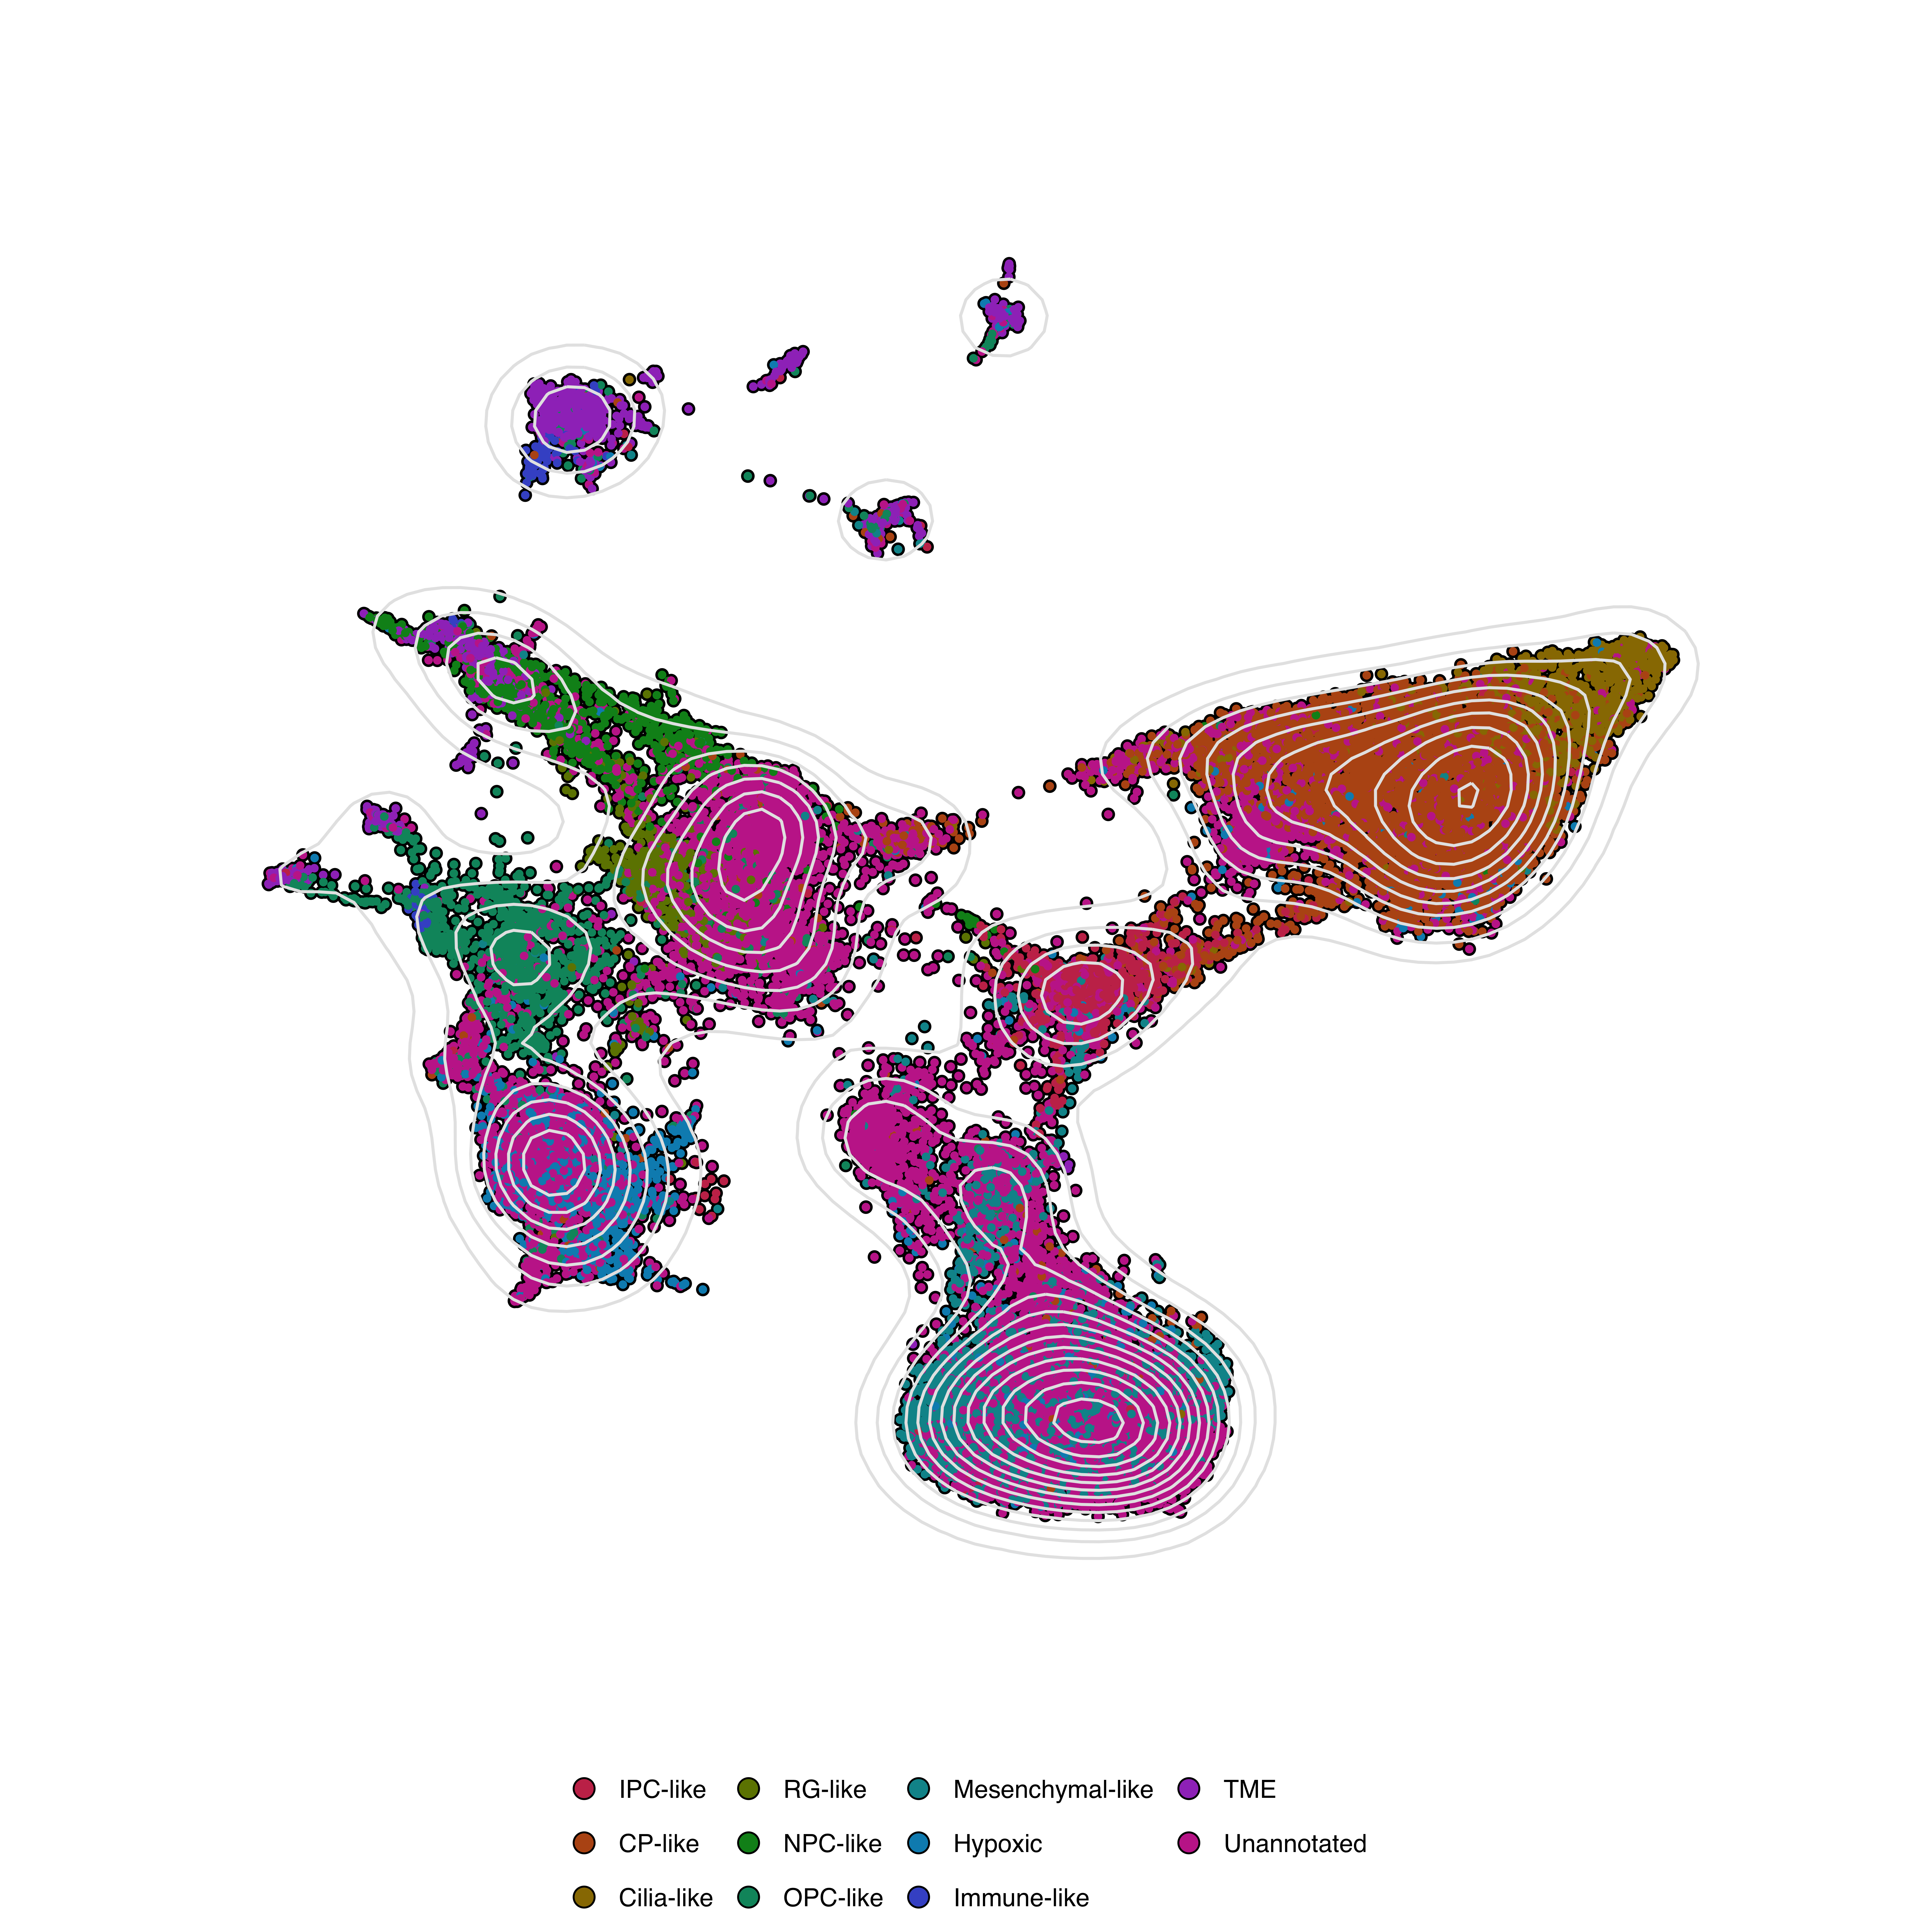
Add density/histogram plots along axes:
p <- SCpubr::do_DimPlot(sample = sample,
                        plot_marginal_distributions = TRUE,
                        marginal.type = "density",
                        marginal.group = TRUE,
                        plot_cell_borders = FALSE)
p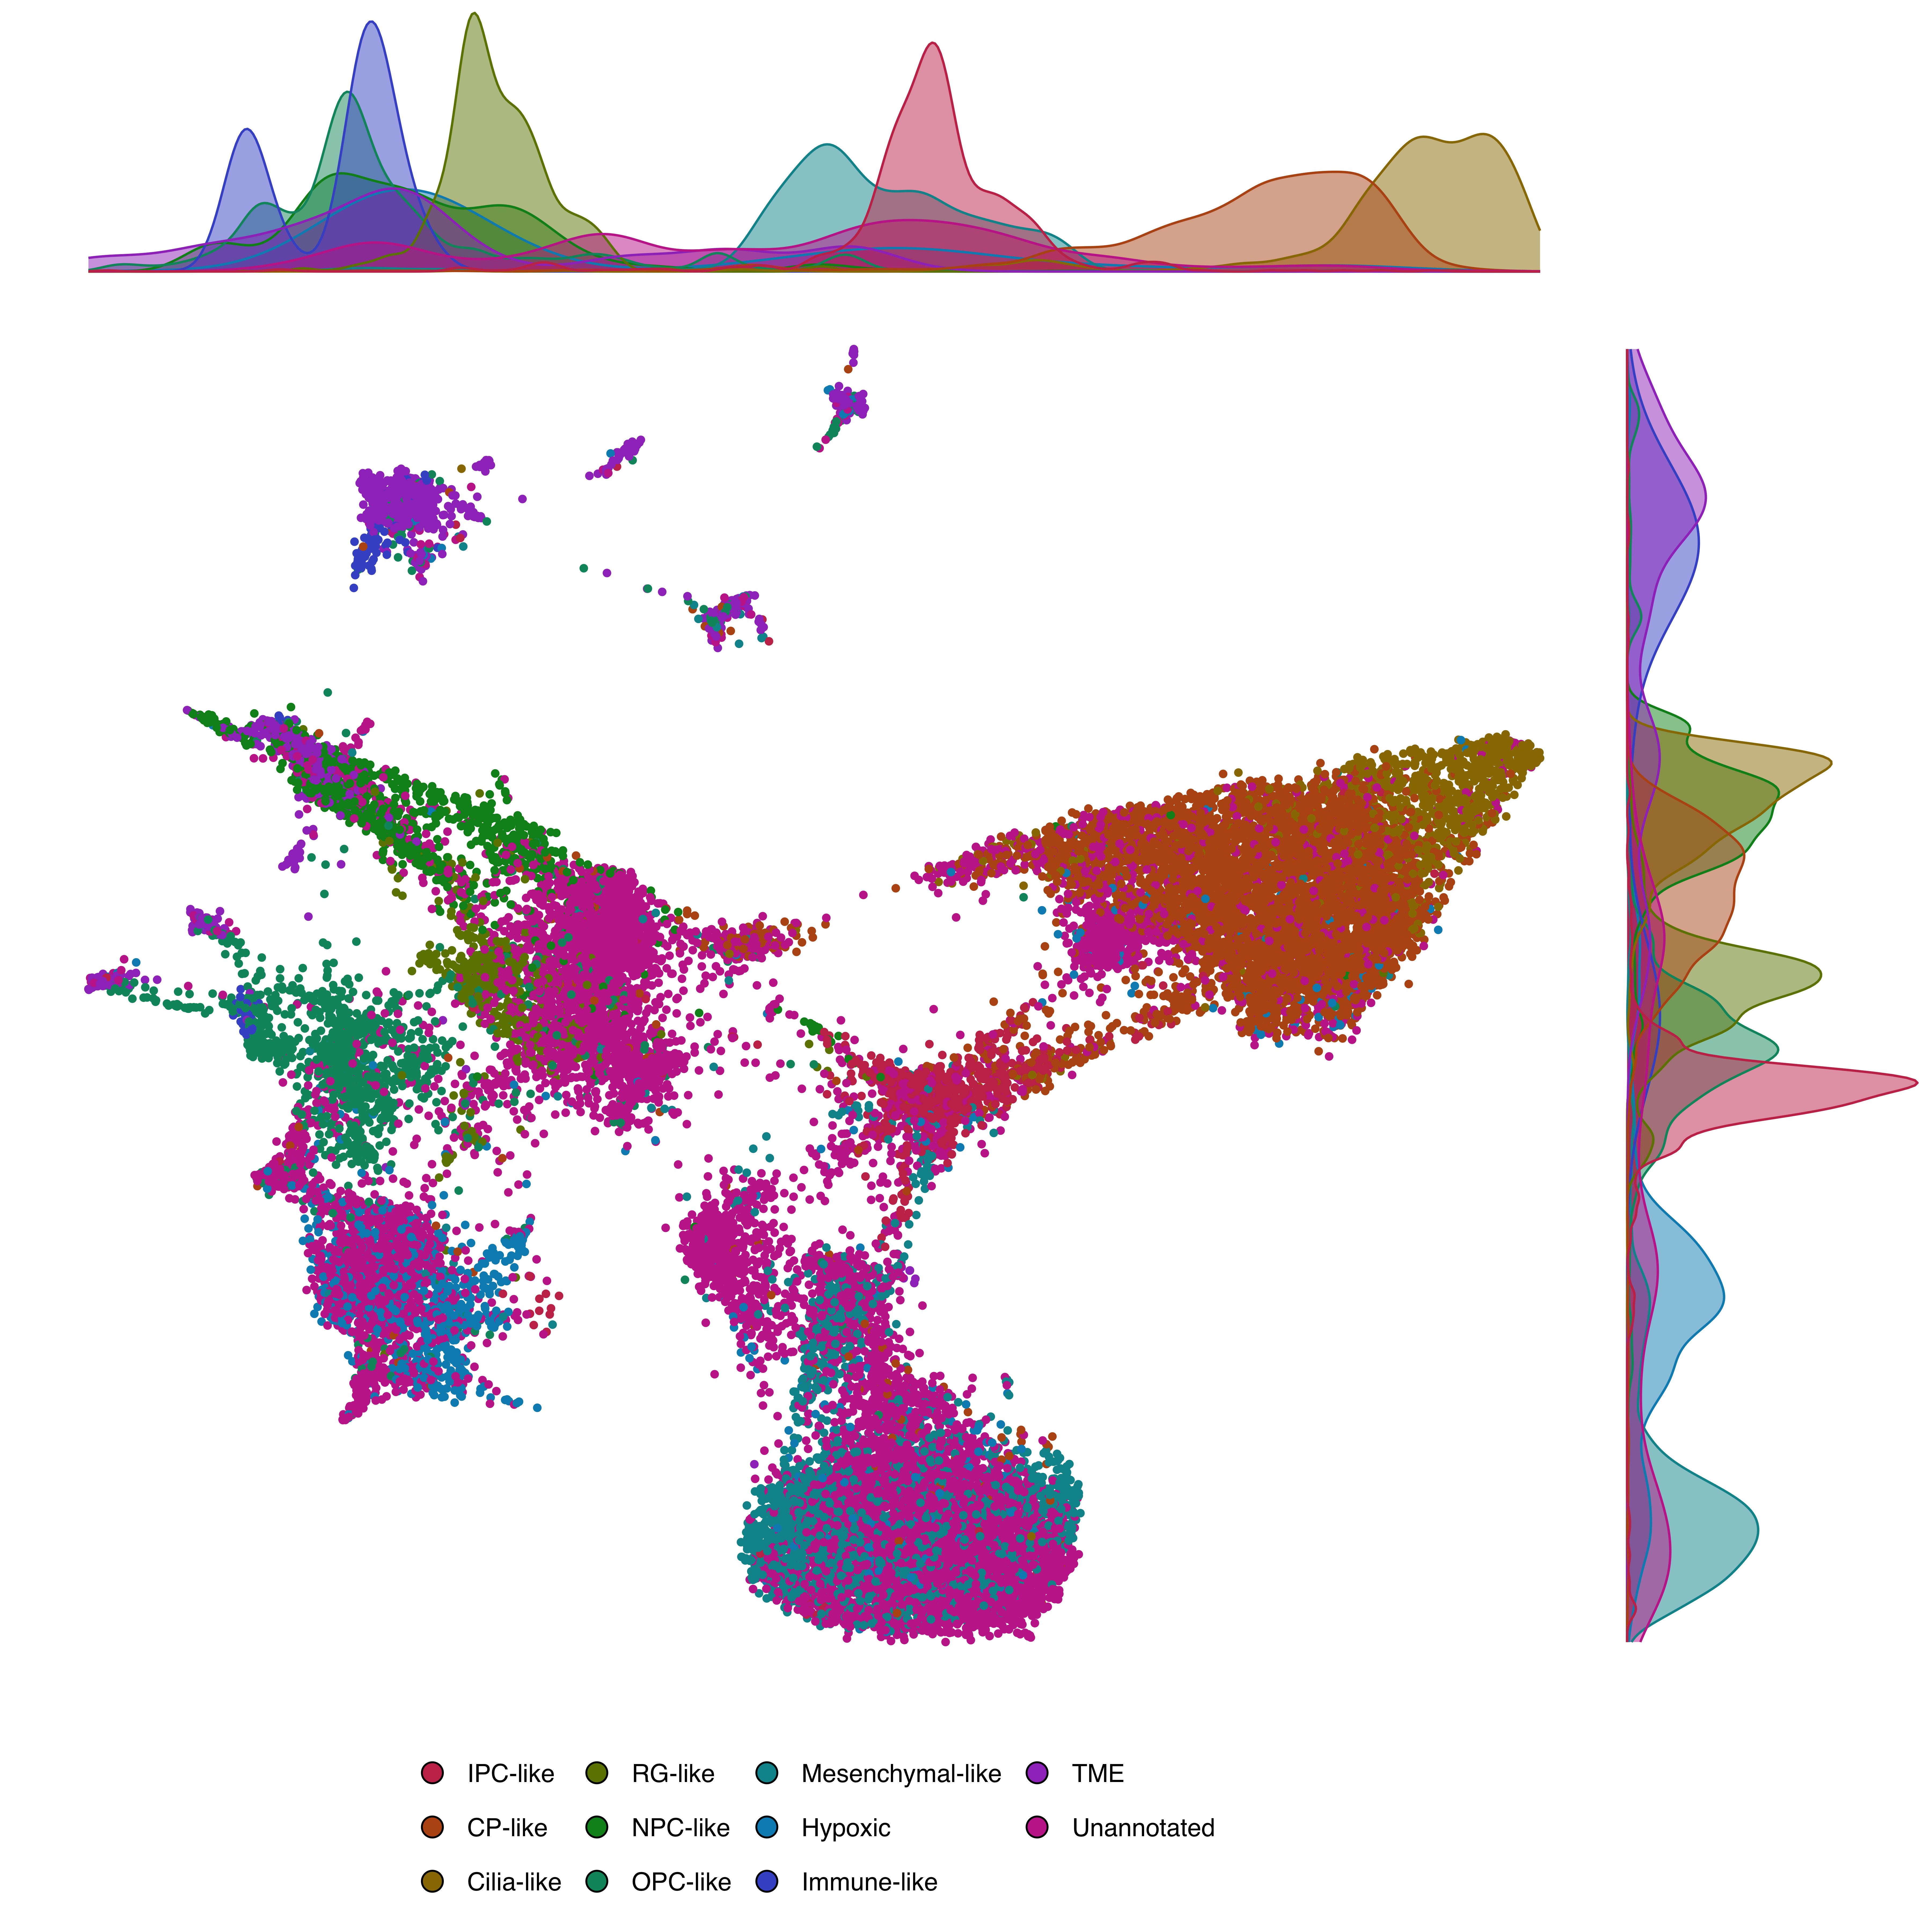
marginal.type values |
Description |
|---|---|
"density" |
Density curves |
"histogram" |
Histograms |
"boxplot" |
Box plots |
"violin" |
Violin plots |
"densigram" |
Density + histogram |
Marginal distributions cannot be used with split.by, plot_cell_borders, or cells.highlight.
Provide a named vector of colors:
colors <- c("ATRT-TYR" = "#E63946", "ATRT-SHH" = "#457B9D", "ATRT-MYC" = "#1D3557")

p <- SCpubr::do_DimPlot(sample = sample,
                        group.by = "subtype",
                        colors.use = colors)
p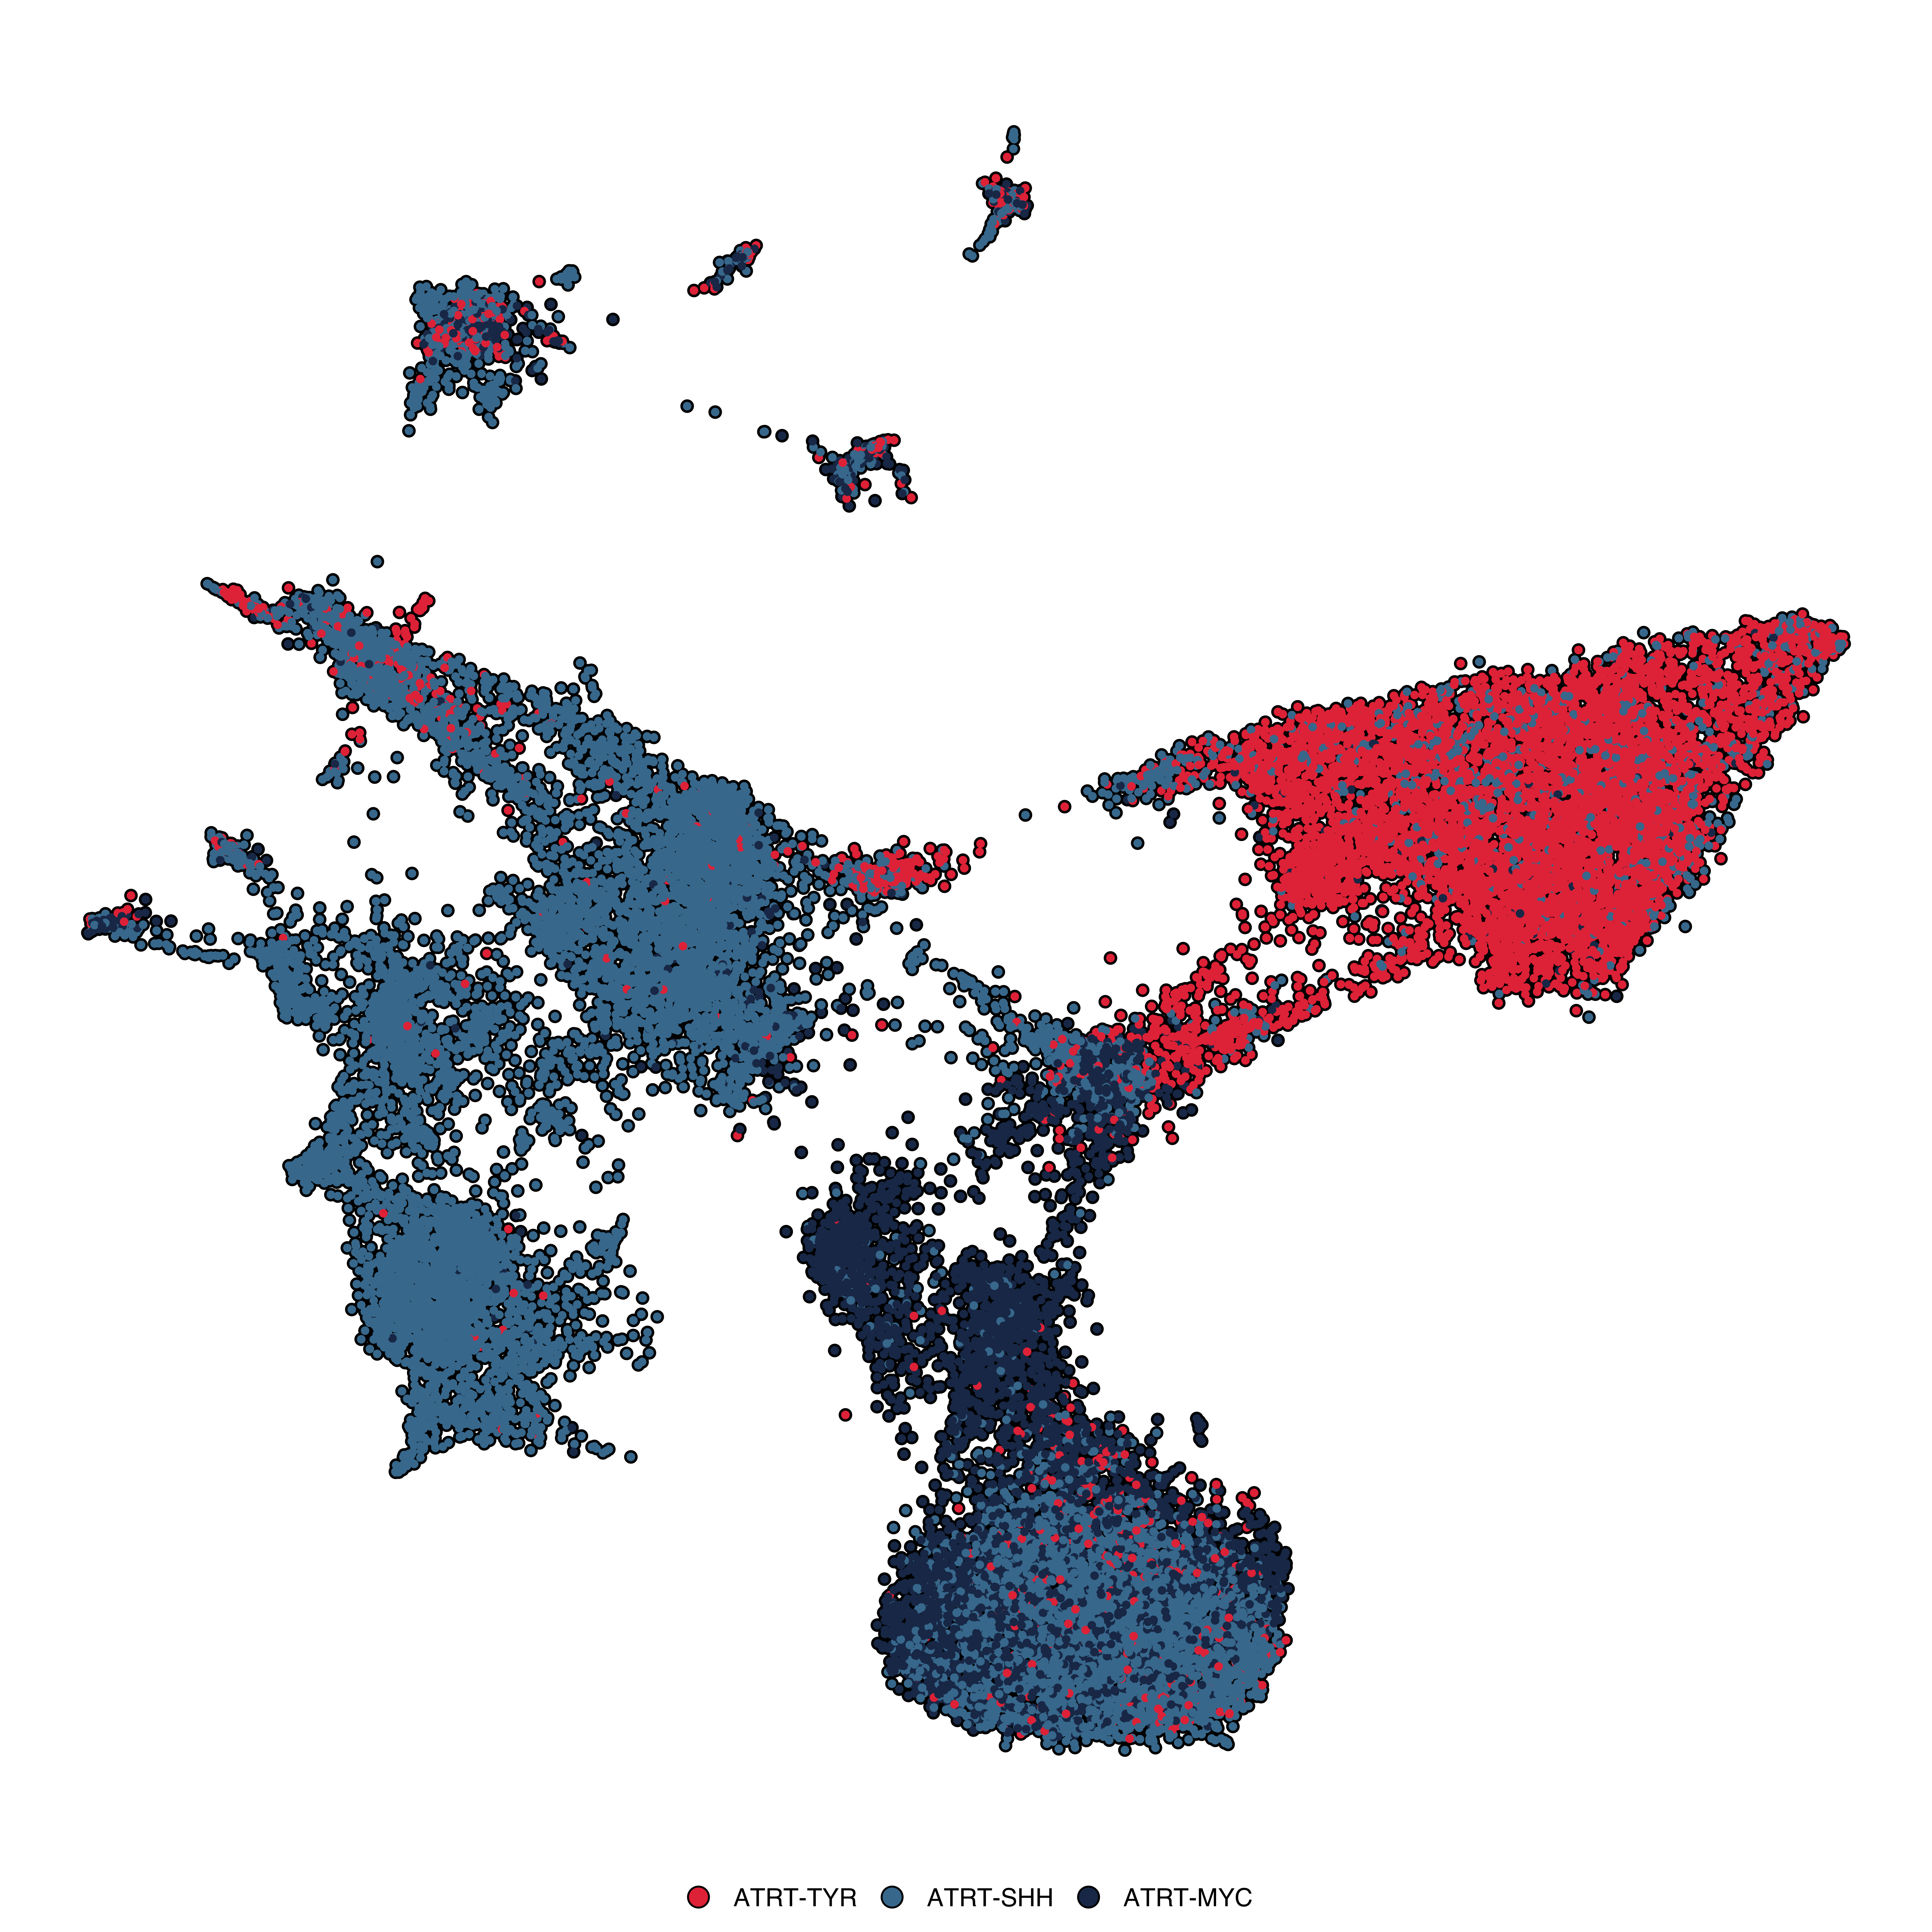
p <- SCpubr::do_DimPlot(sample = sample,
                        colorblind = TRUE)
p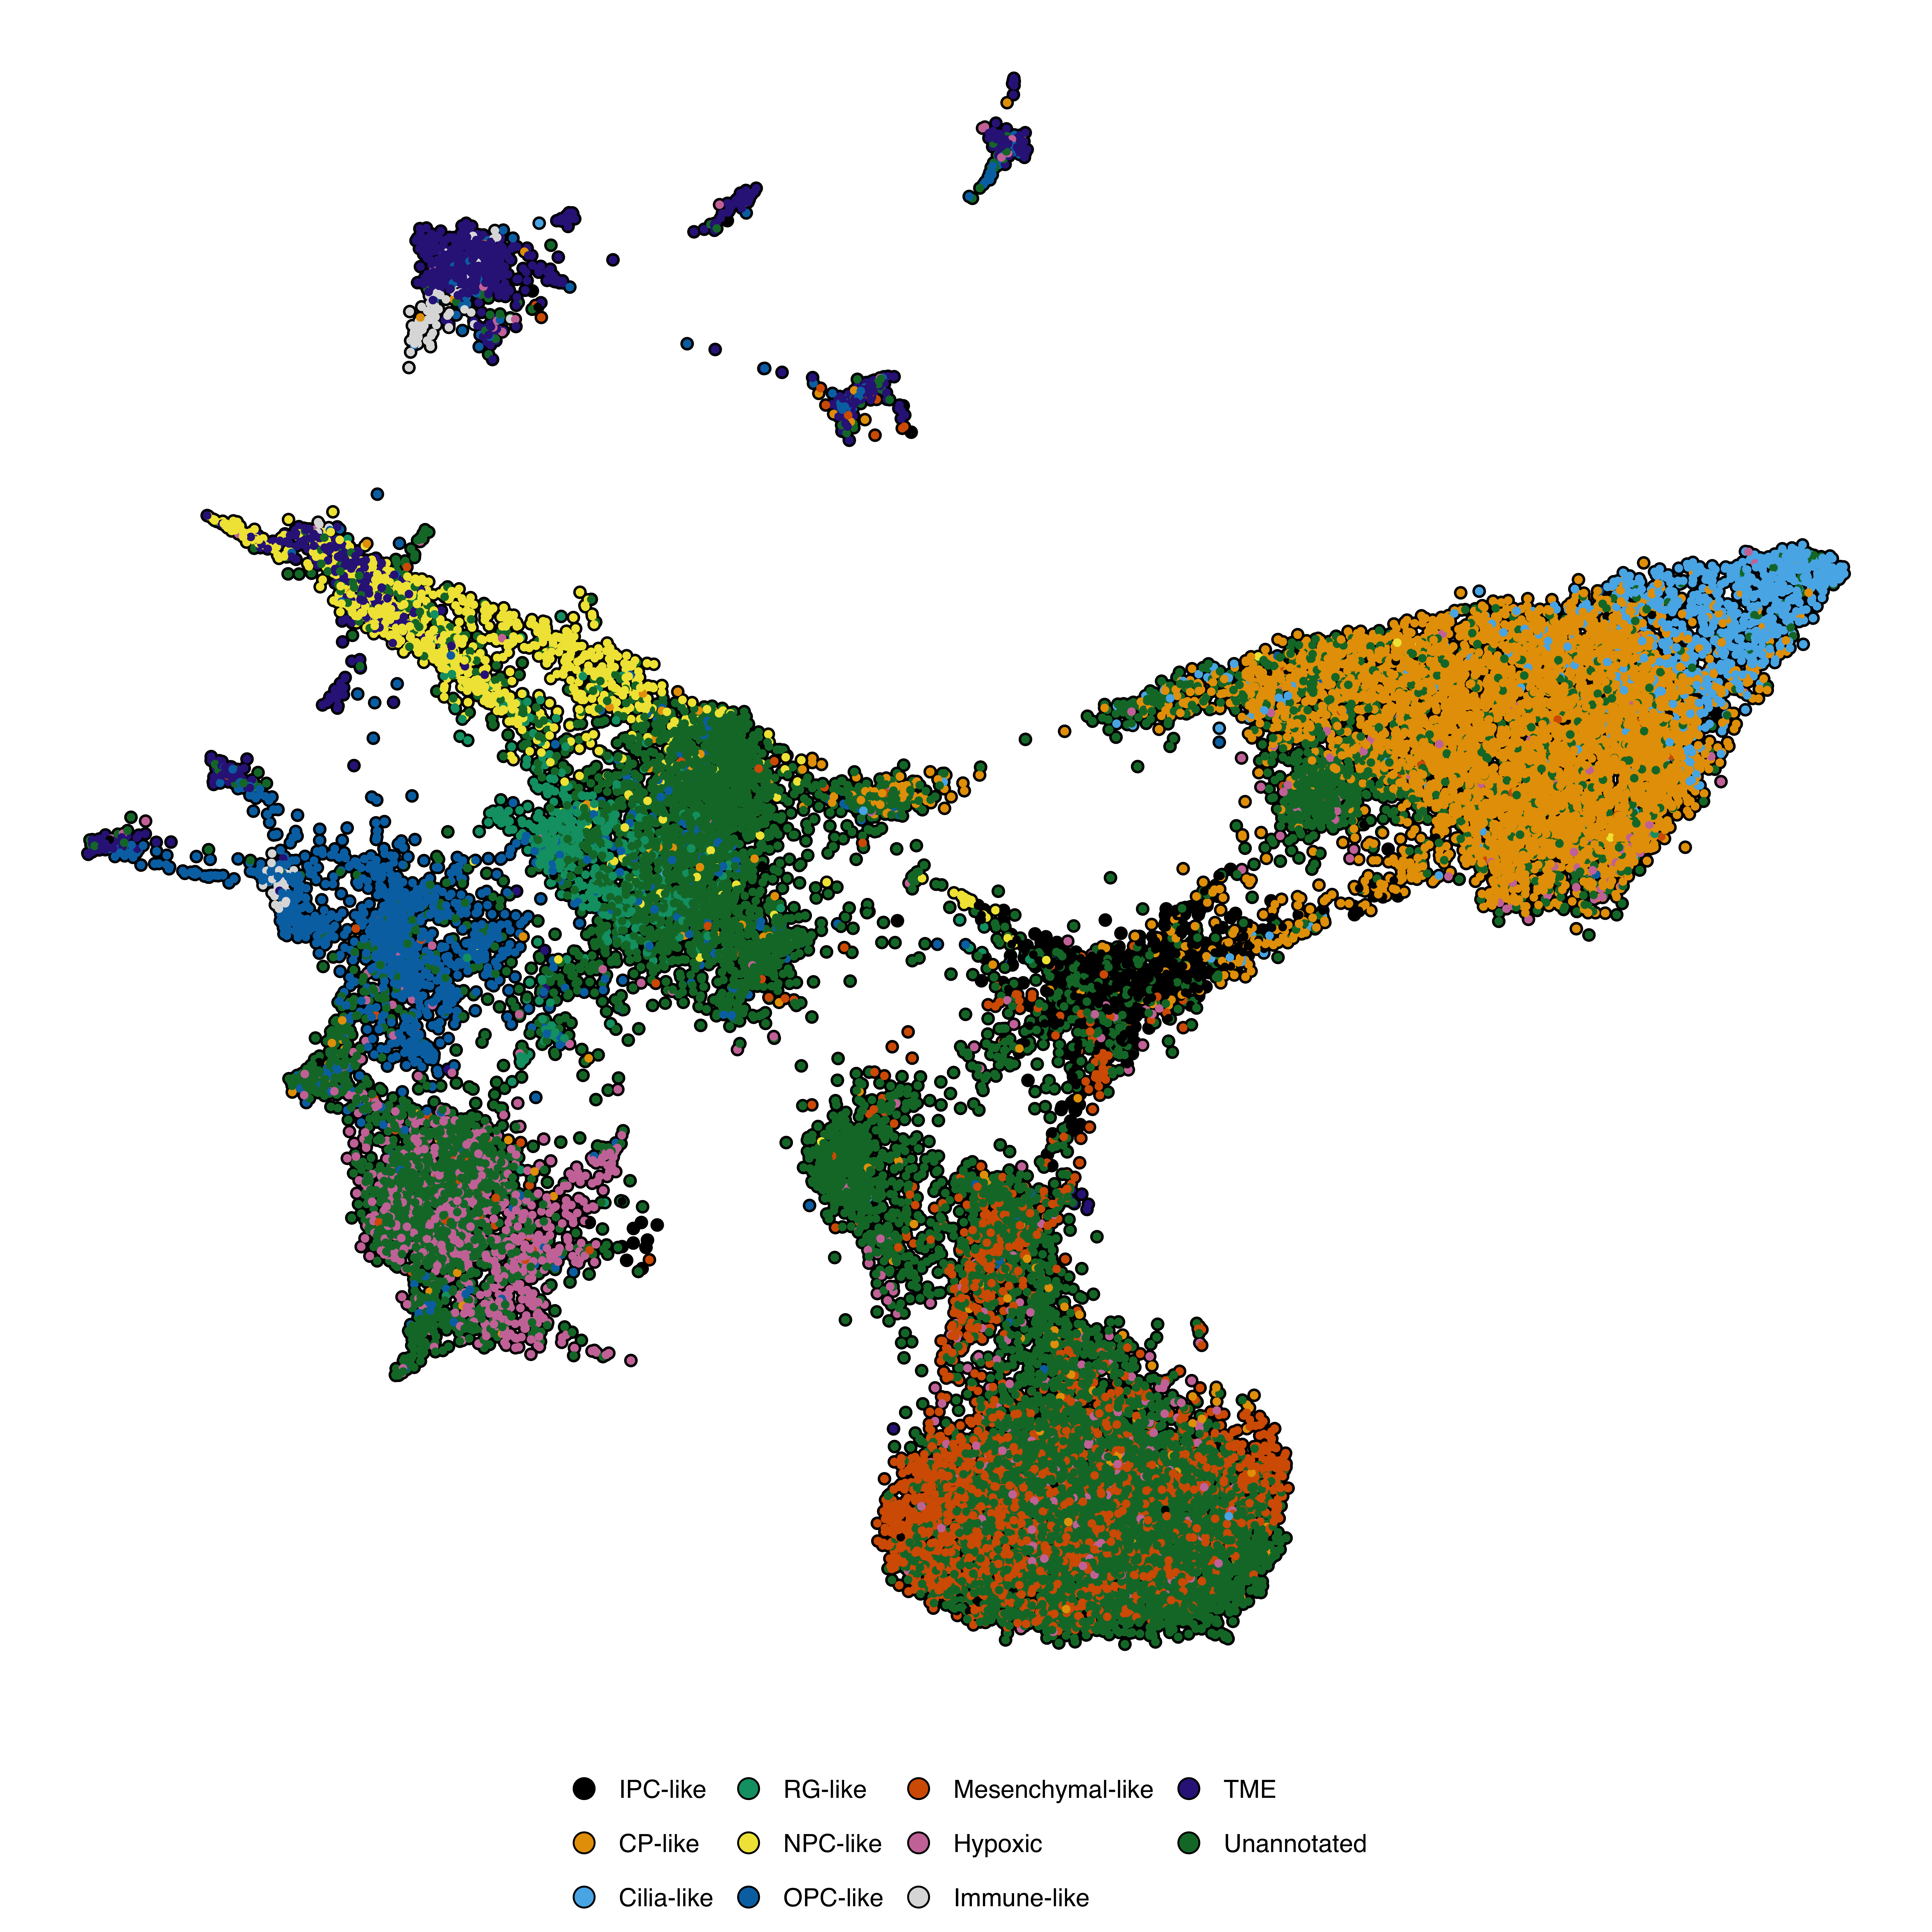
Control the color for cells set to NA via na.value:
p <- SCpubr::do_DimPlot(sample = sample,
                        idents.keep = c("IPC-like"),
                        na.value = "grey25")
p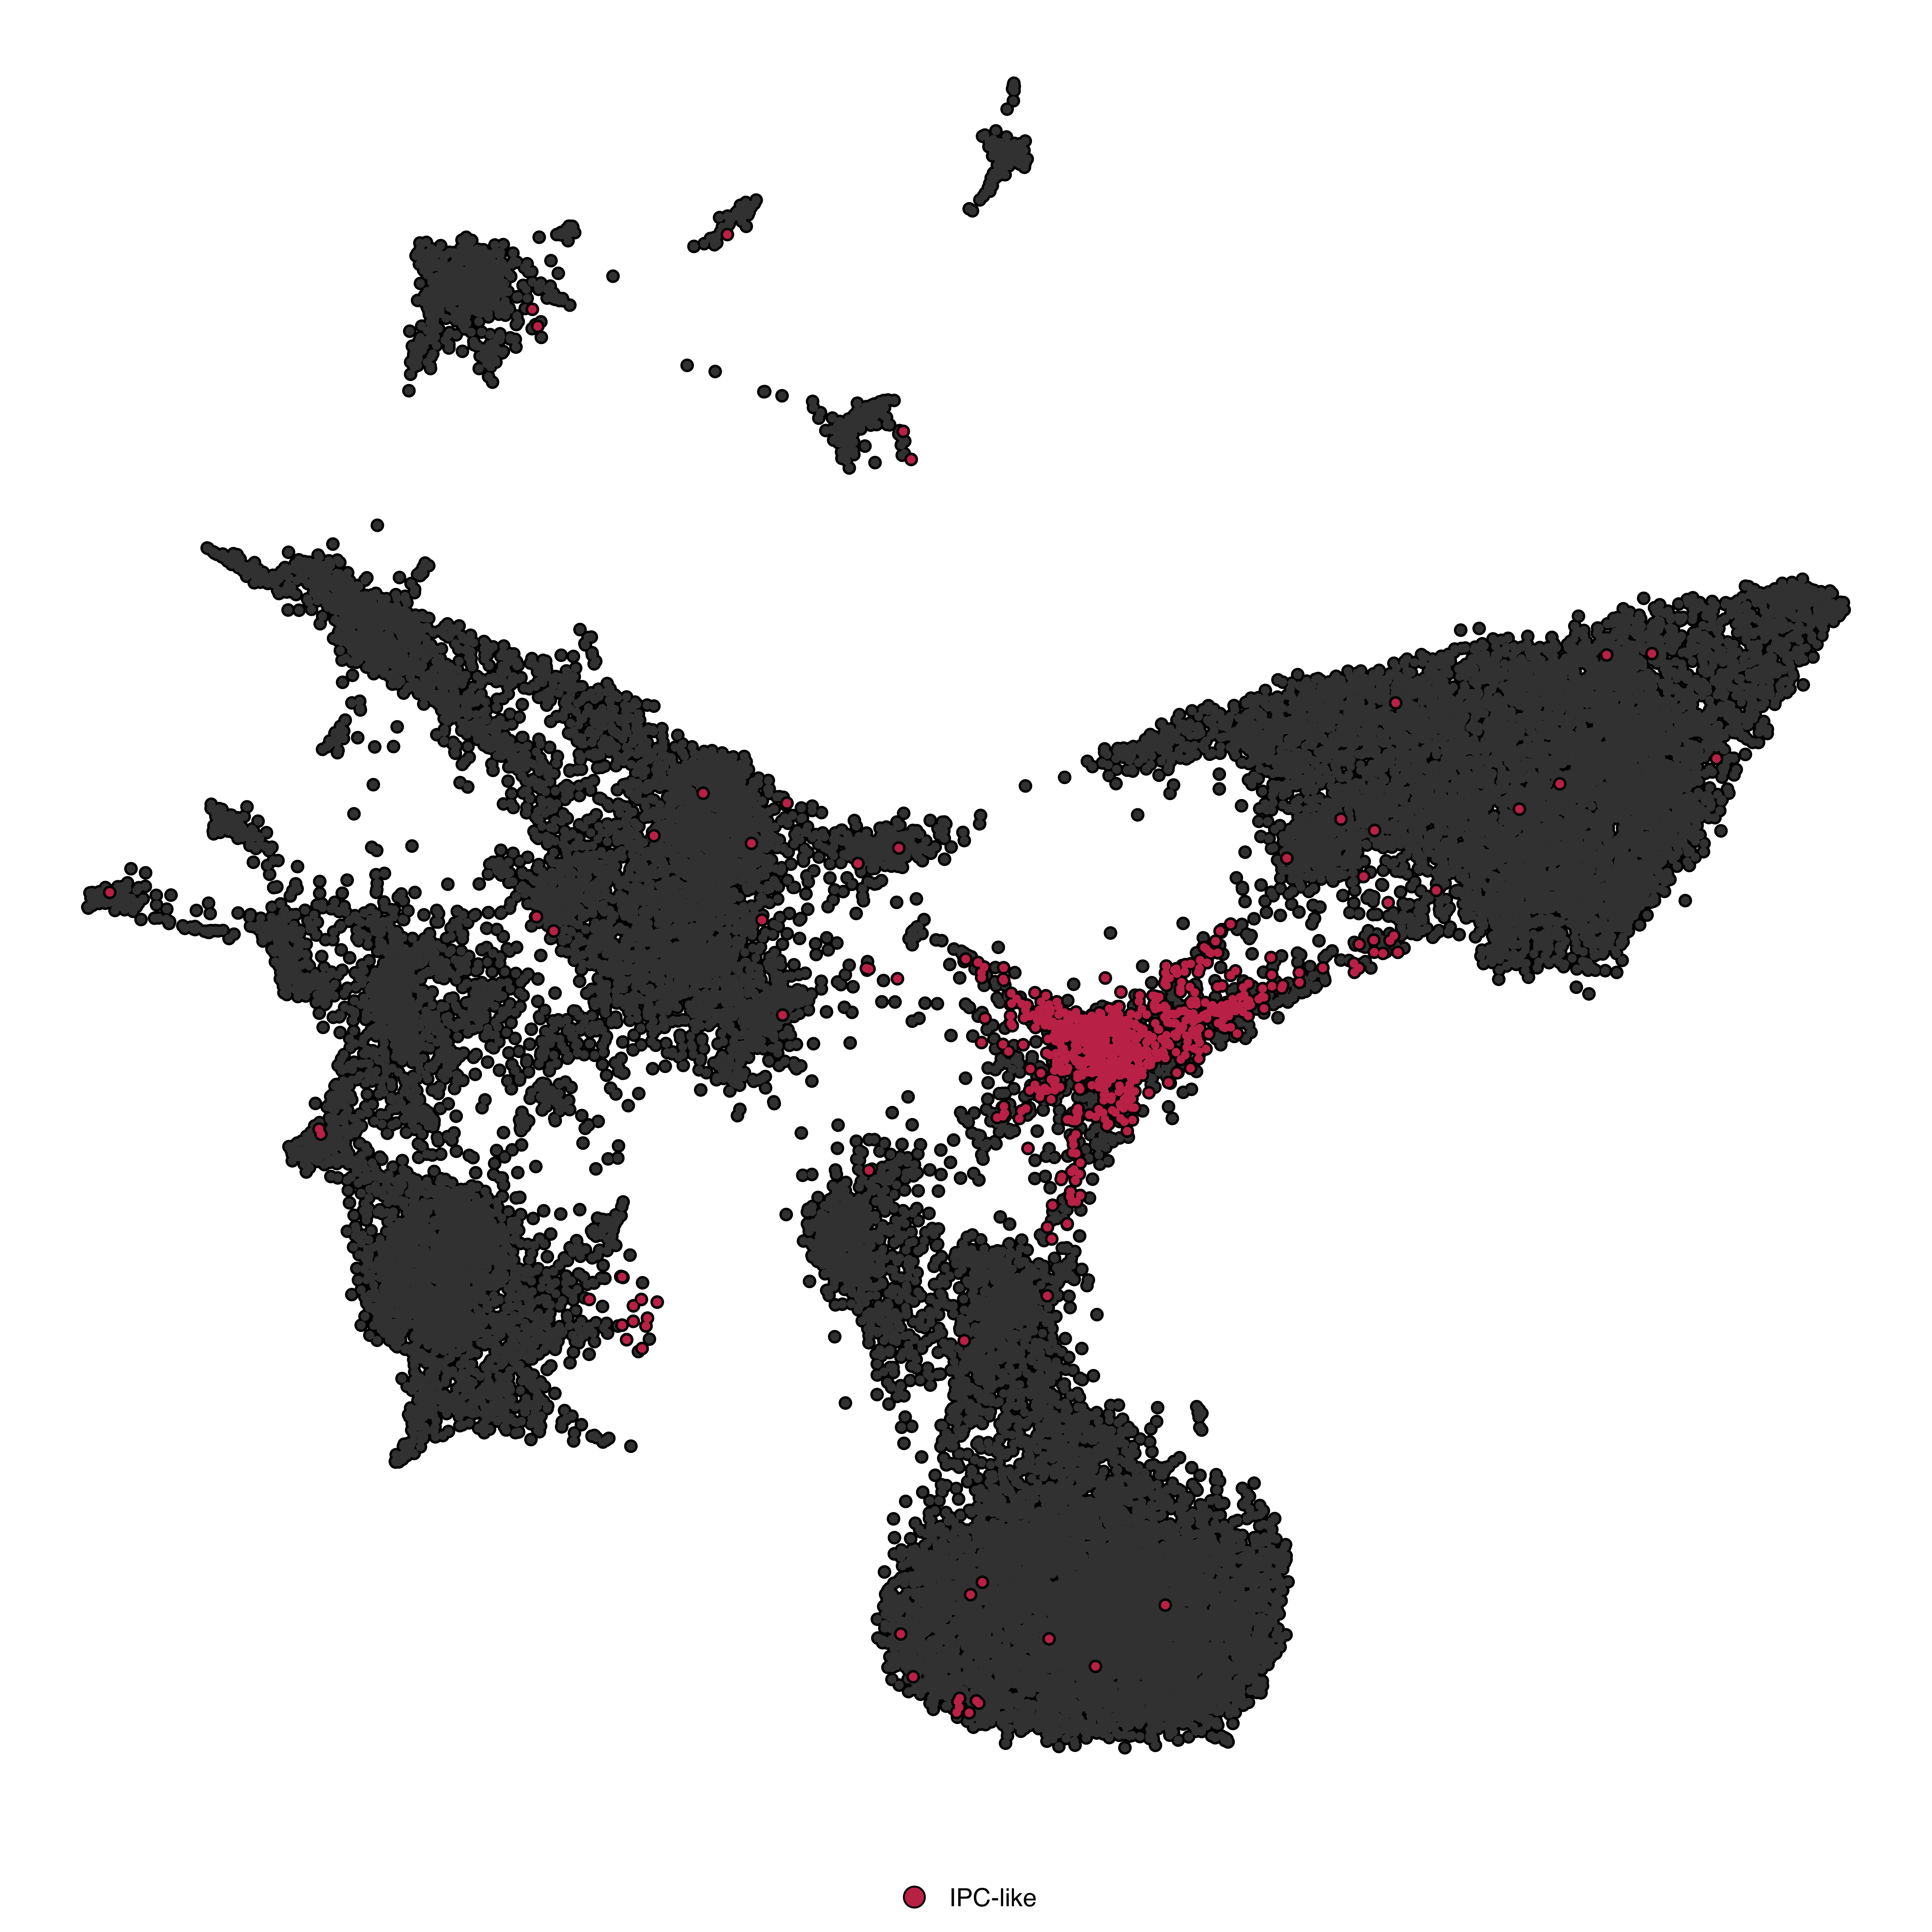
For large datasets, rasterize to reduce file size:
p <- SCpubr::do_DimPlot(sample = sample,
                        raster = TRUE,
                        raster.dpi = 2048,
                        pt.size = 8)
p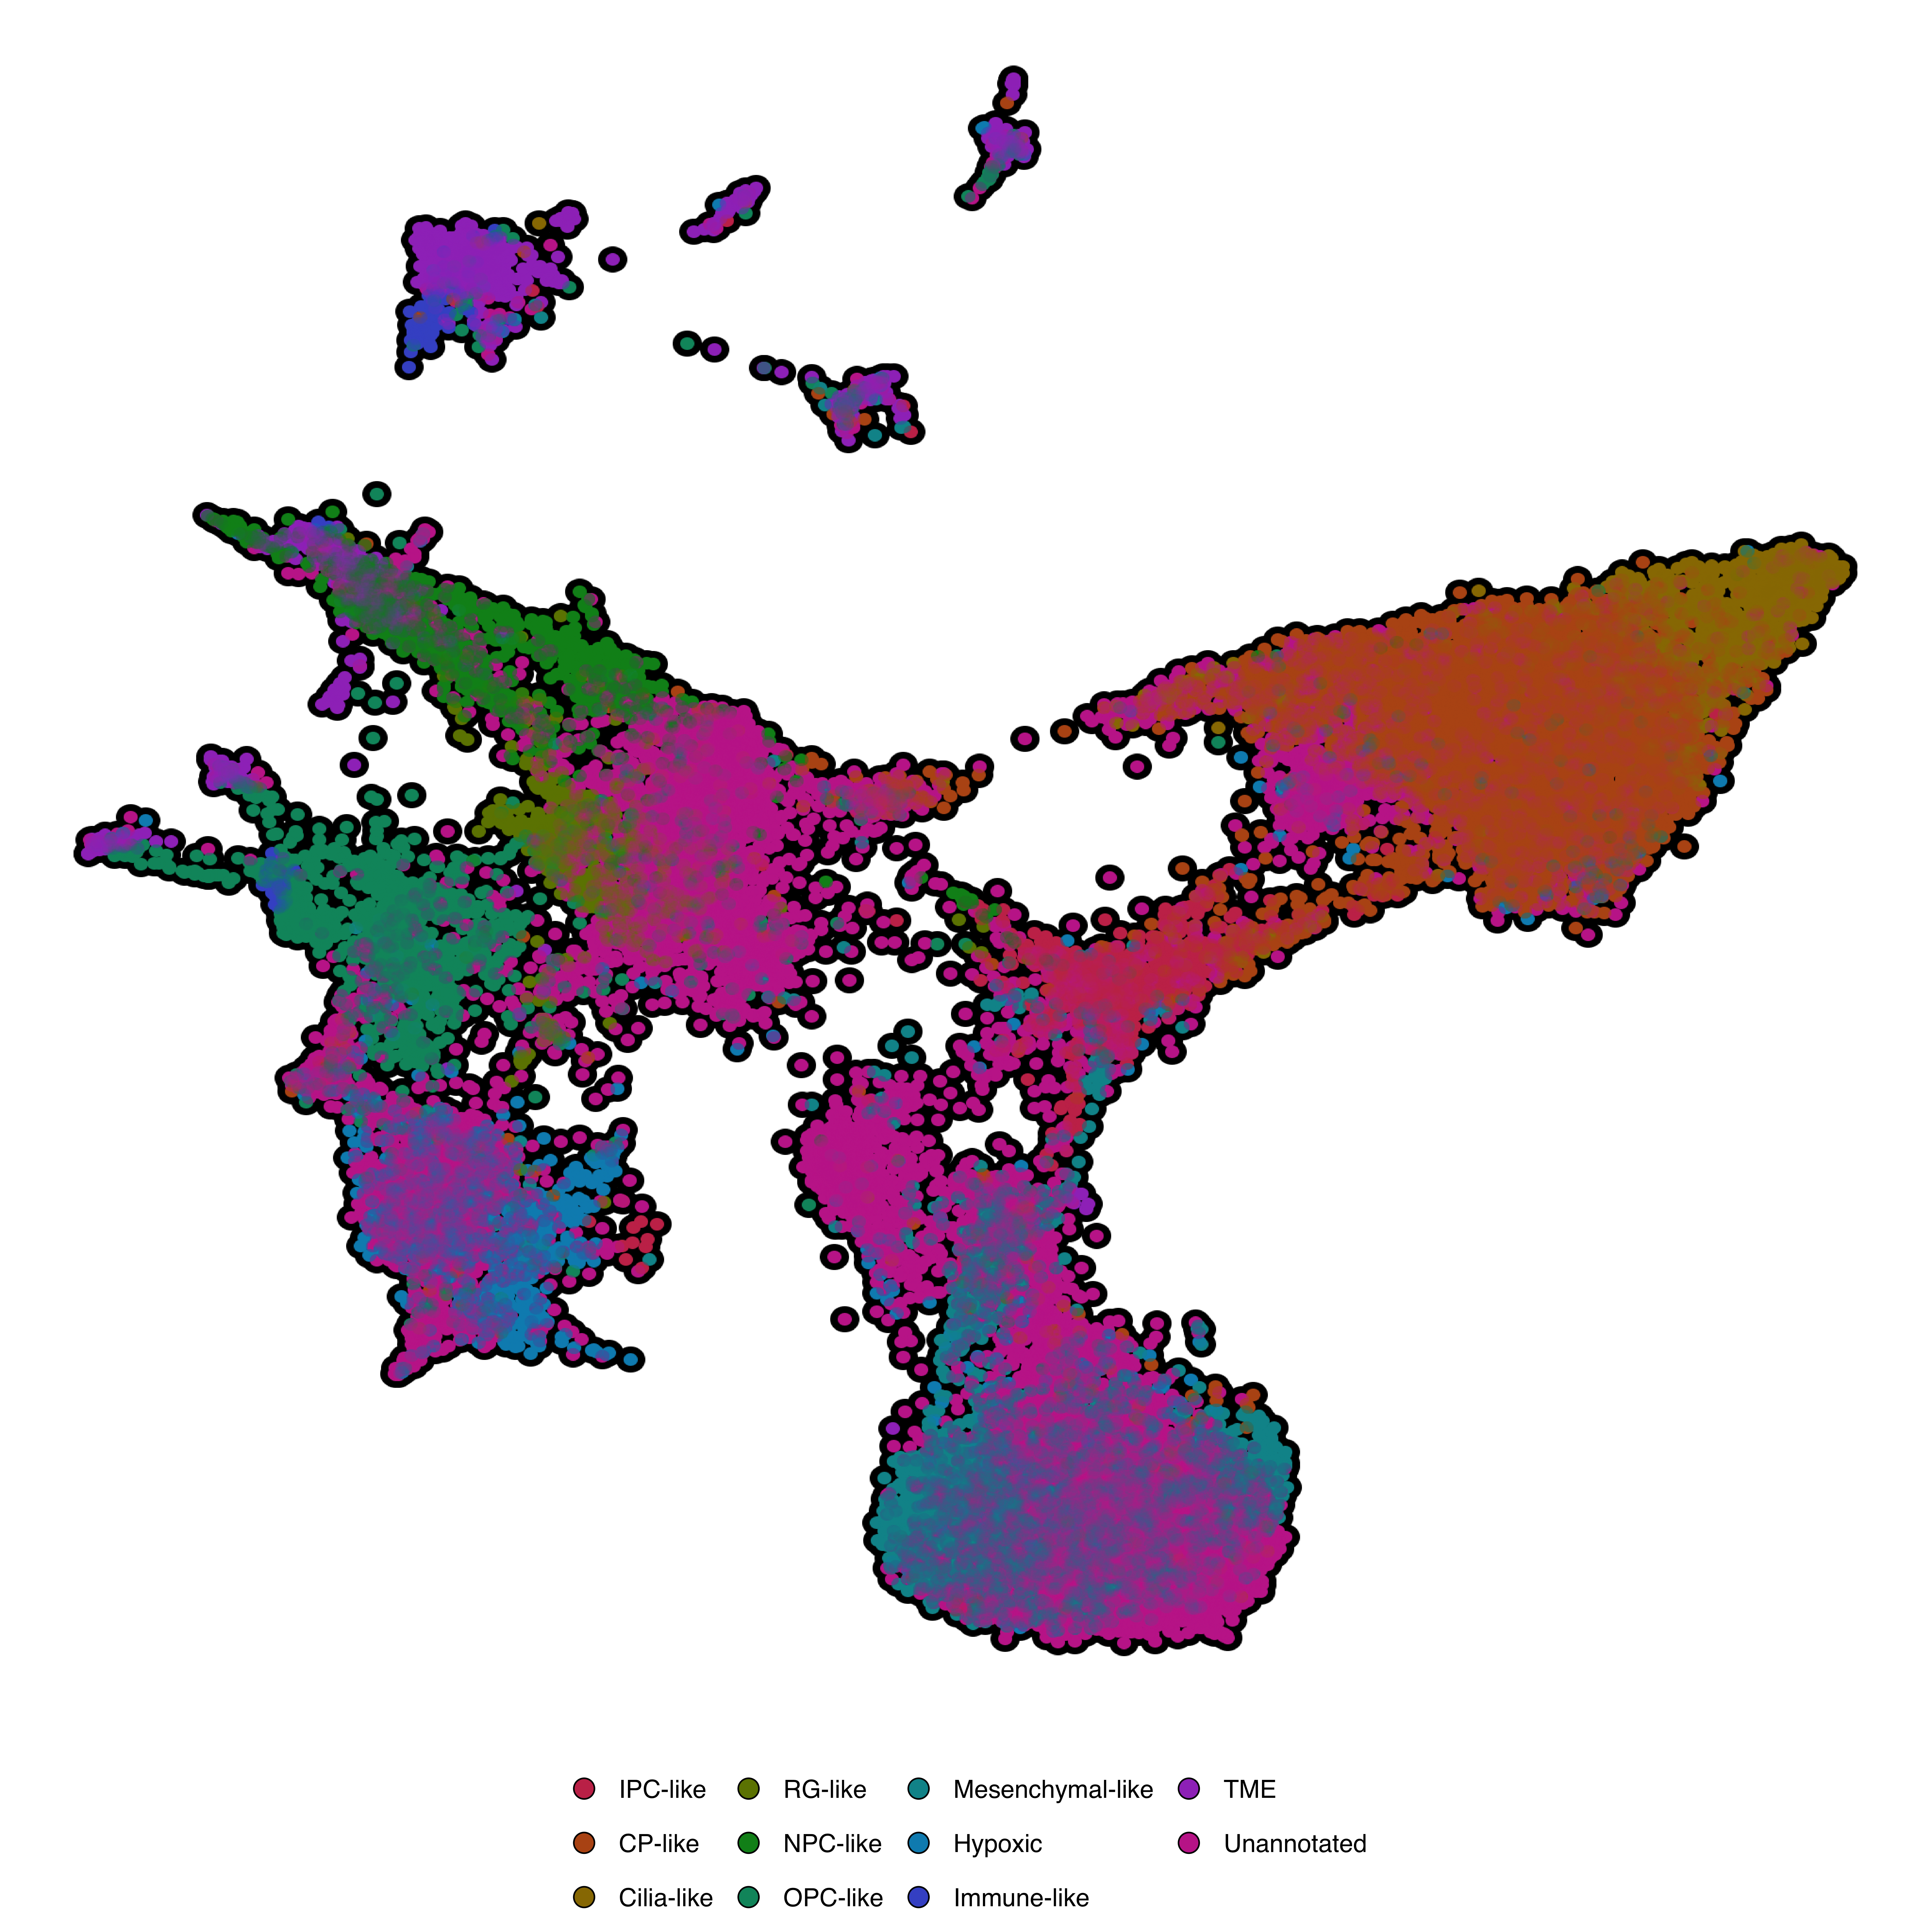
If pt.size < 1 with raster = TRUE, cells appear as crosses. Use pt.size >= 1.
For parameters shared across many functions (color palettes, typography, legend styling, titles, cell borders, density contours, marginal distributions, rendering), see Shared features.
| Parameter | Description | Default |
|---|---|---|
sample |
Seurat object | — |
reduction |
Dimensional reduction to use | Auto-detected |
group.by |
Metadata column to color by | Active idents |
split.by |
Metadata column to facet by | NULL |
split.by.combined |
Add combined overview panel | TRUE |
dims |
Which dimensions to plot | c(1, 2) |
ncol |
Number of columns for faceted plots | NULL |
| Parameter | Description | Default |
|---|---|---|
pt.size |
Point size | 1 |
colors.use |
Named vector of colors | Auto-generated |
colorblind |
Use colorblind-safe palette | FALSE |
shuffle |
Randomize plotting order | TRUE |
order |
Identities to plot last (on top) | NULL |
plot.axes |
Show axis lines and labels | FALSE |
| Parameter | Description | Default |
|---|---|---|
label |
Show cluster labels | FALSE |
label.box |
Draw box around labels | TRUE |
label.color |
Label text color | "black" |
label.fill |
Label box fill | "white" |
label.size |
Label text size | 4 |
repel |
Repel overlapping labels | FALSE |
| Parameter | Description | Default |
|---|---|---|
cells.highlight |
Cell barcodes to highlight | NULL |
idents.highlight |
Identities to highlight | NULL |
idents.keep |
Identities to display (others → NA) | NULL |
sizes.highlight |
Point size for highlighted cells | 1 |
| Parameter | Description | Default |
|---|---|---|
legend.dot.border |
Add border to legend dots | TRUE |