p <- SCpubr::do_RidgePlot(sample = sample,
                          feature = "nCount_RNA",
                          group.by = "subtype")
p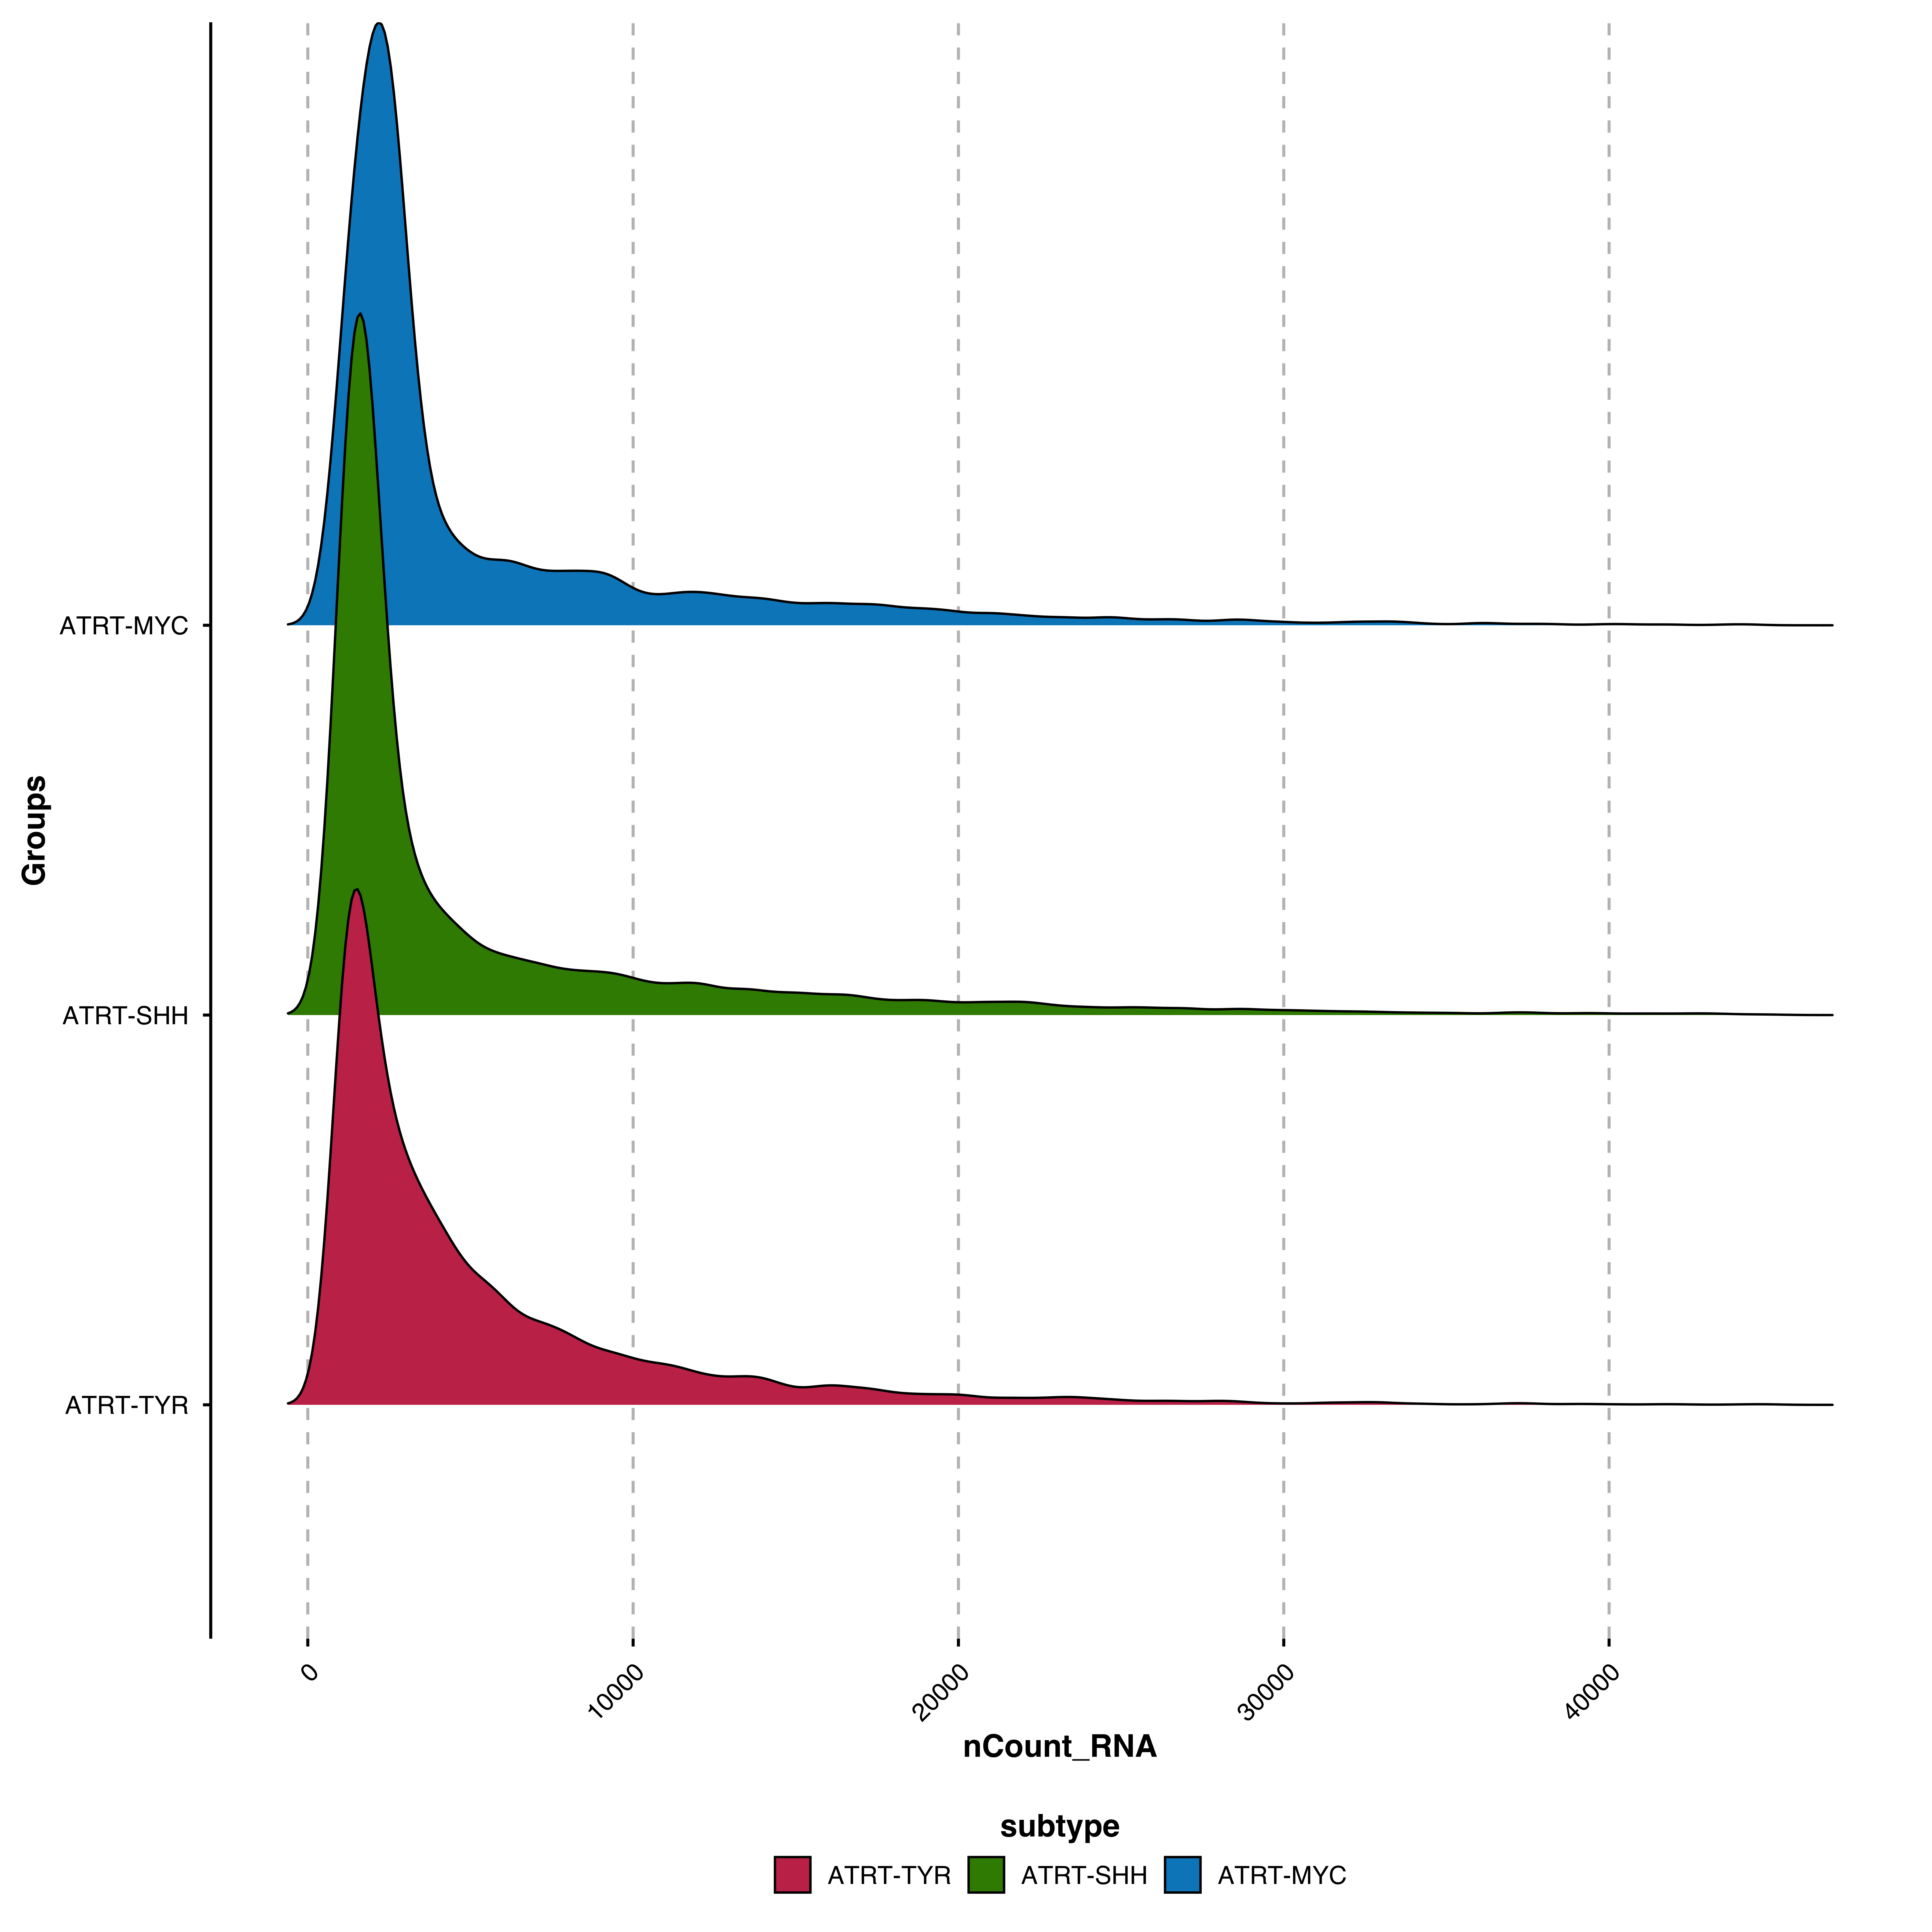
Ridge plots display density distributions stacked vertically, making it easy to compare distributions across many groups. Built on the ggridges package.
p <- SCpubr::do_RidgePlot(sample = sample,
feature = "nCount_RNA",
group.by = "subtype")
p
p <- SCpubr::do_RidgePlot(sample = sample,
                          feature = "nCount_RNA",
                          group.by = "subtype",
                          split.by = "technology")
p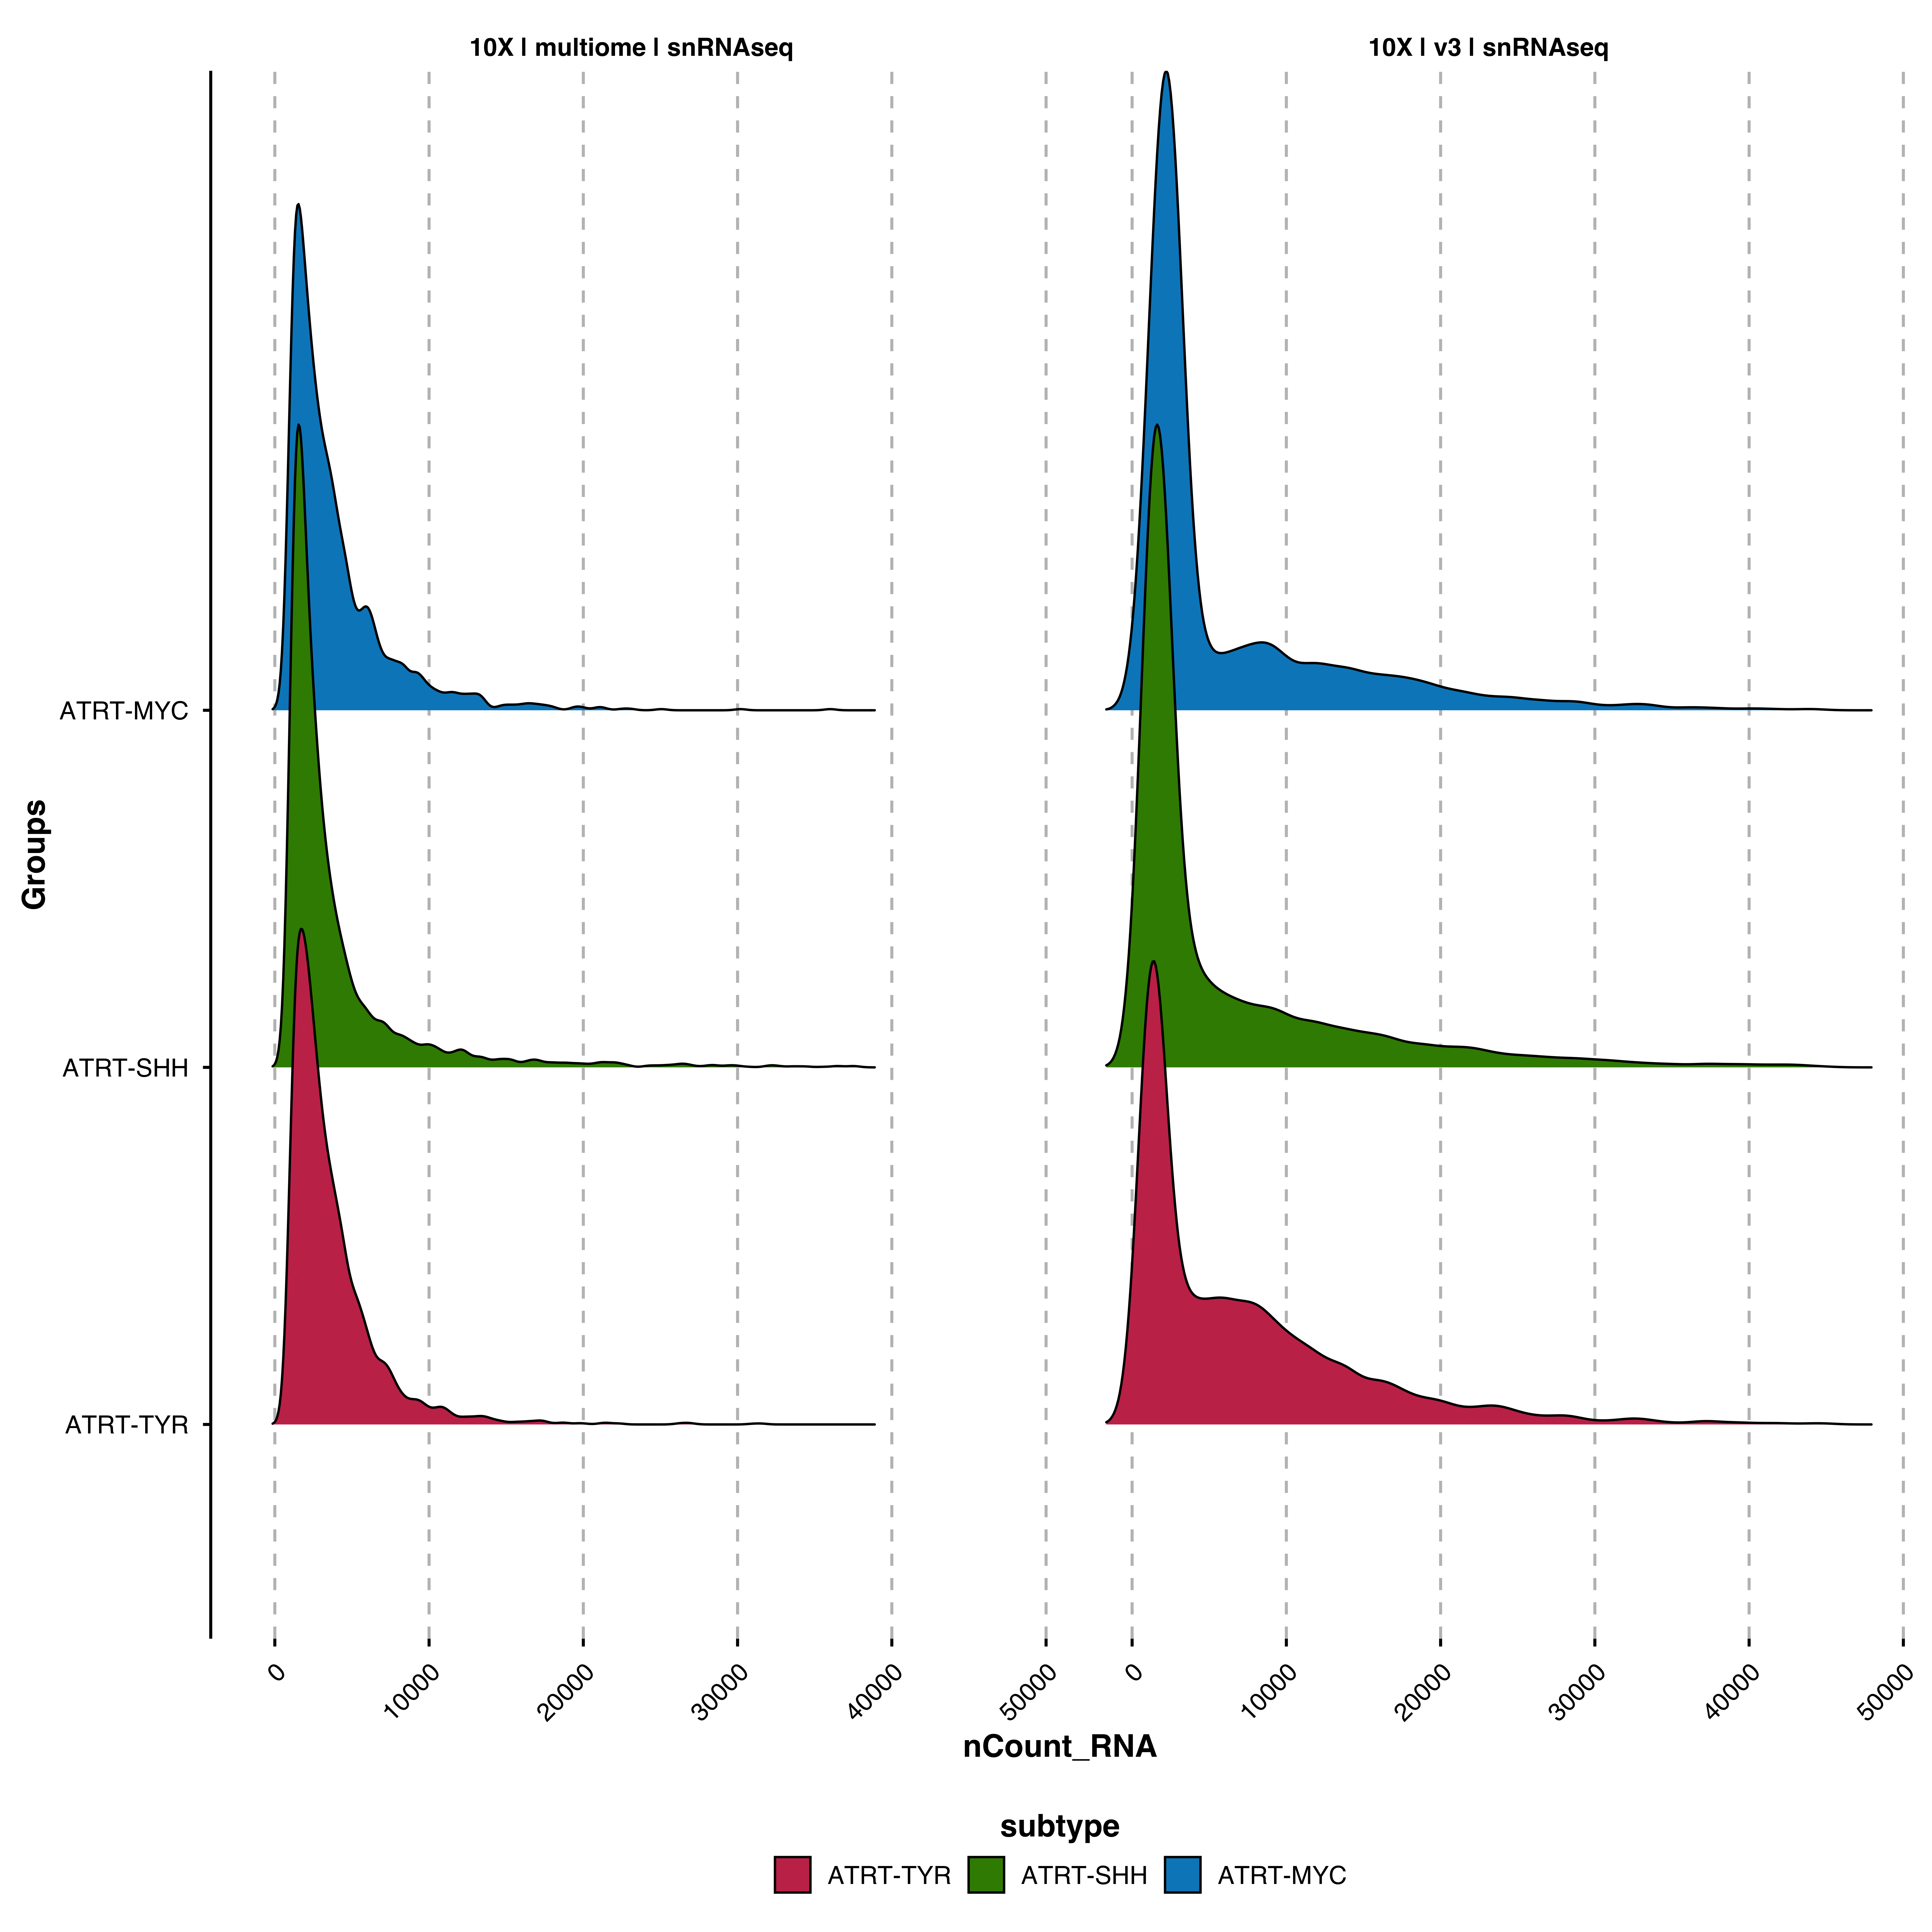
Color ridges by a continuous gradient instead of categorical colors:
p <- SCpubr::do_RidgePlot(sample = sample,
                          feature = "nCount_RNA",
                          group.by = "subtype",
                          continuous_scale = TRUE)
p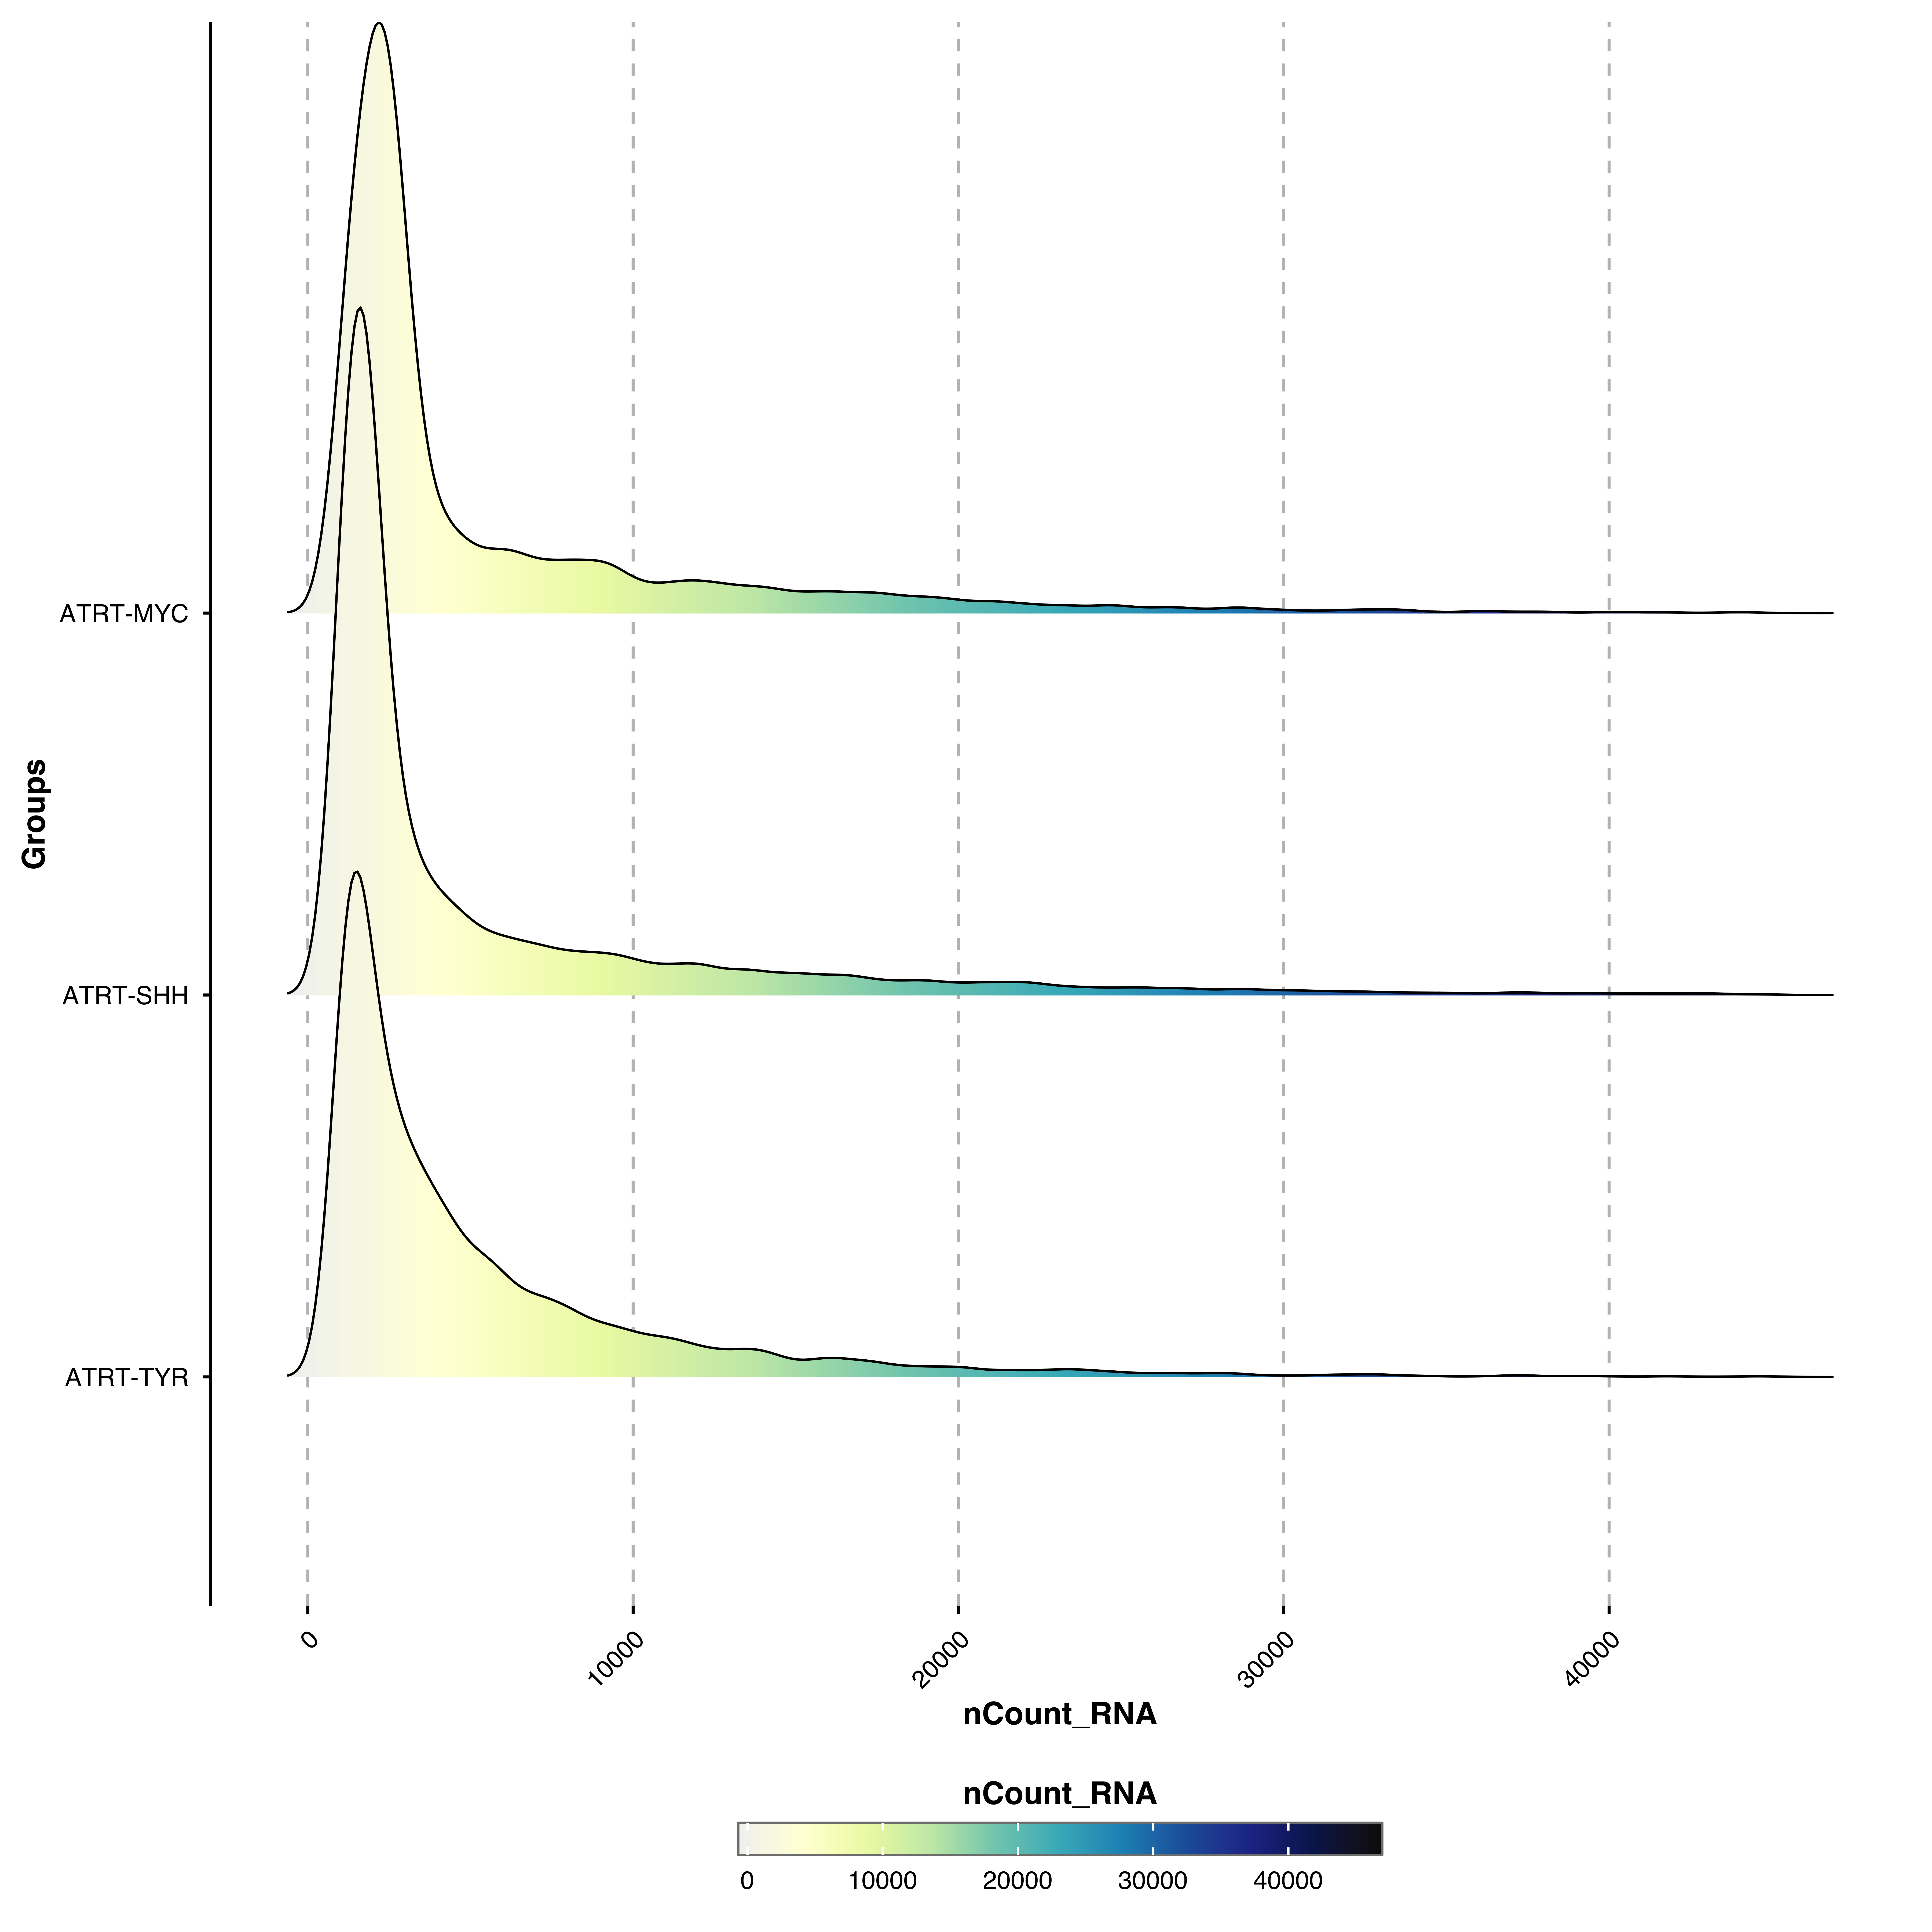
For parameters shared across many functions (color palettes, typography, legend styling, grid), see Shared features.
| Parameter | Description | Default |
|---|---|---|
feature |
Feature to plot | — |
continuous_scale |
Use continuous color scale | FALSE |