p <- SCpubr::do_BoxPlot(sample = sample,
                        feature = "nCount_RNA",
                        flip = TRUE,
                        order = TRUE)
p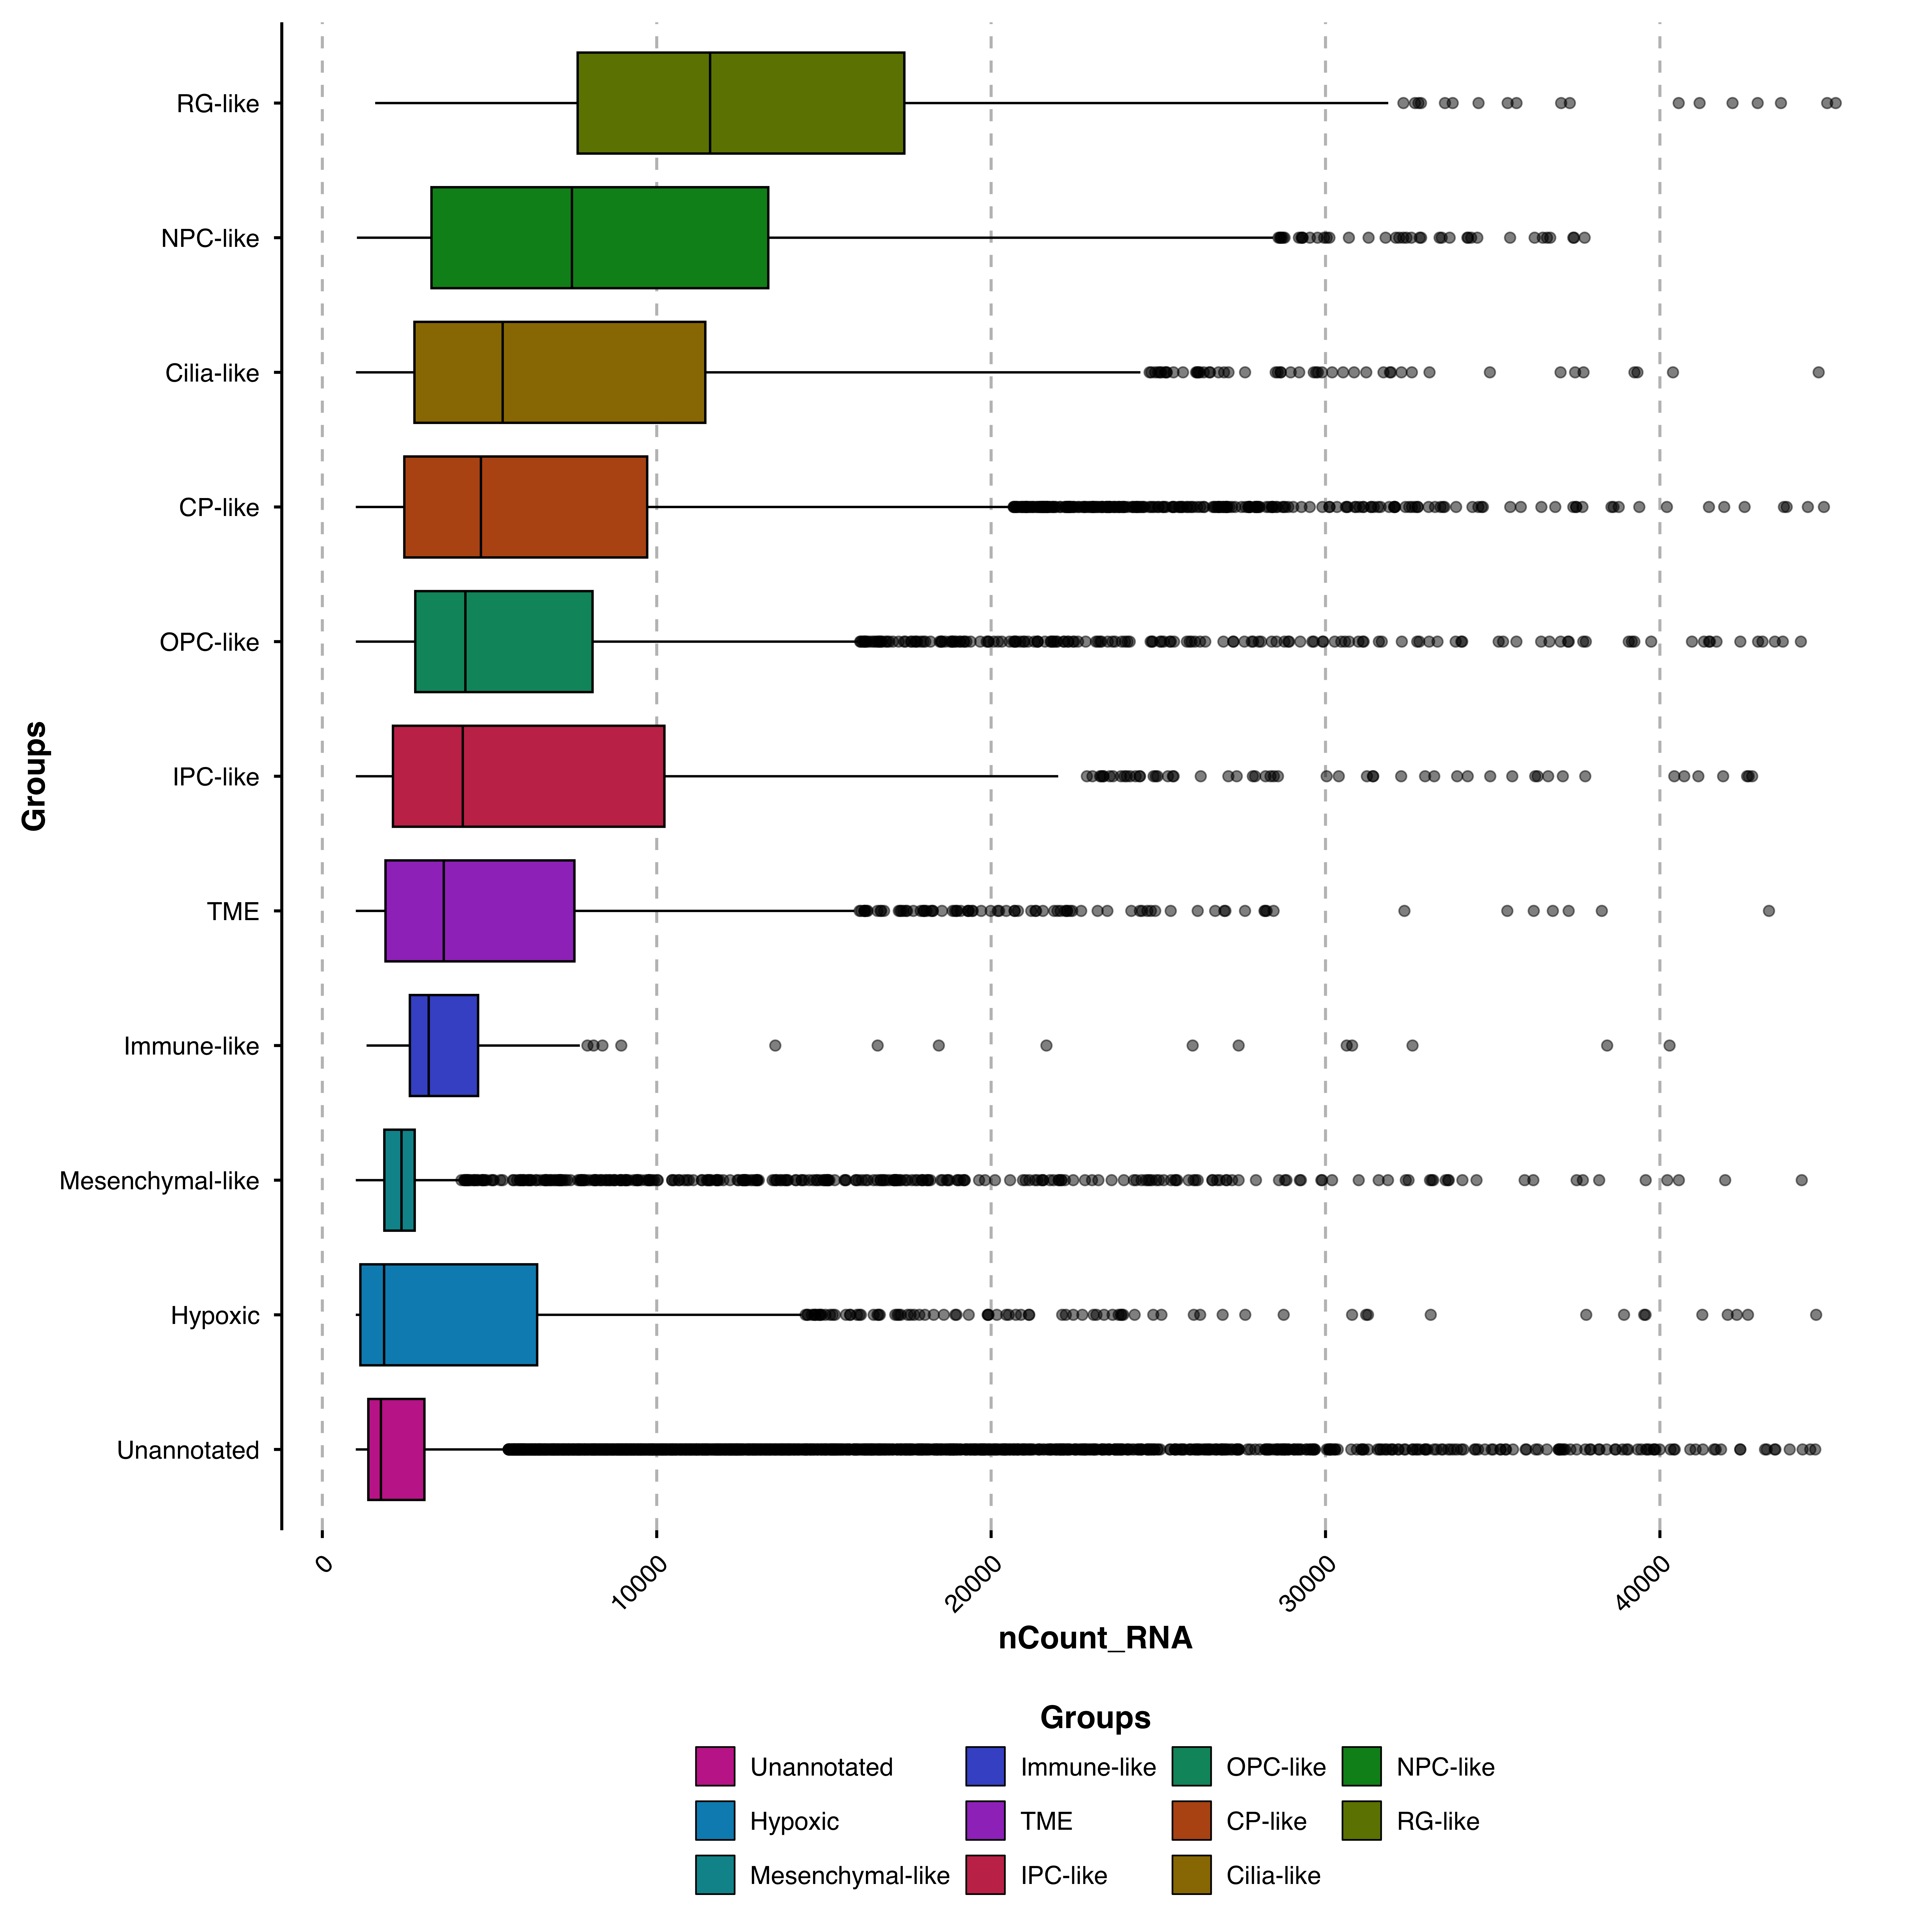
Box plots provide a statistical summary of distributions: median, quartiles, and outliers. Use them to compare gene expression or other continuous values across groups with optional statistical testing.
p <- SCpubr::do_BoxPlot(sample = sample,
feature = "nCount_RNA",
flip = TRUE,
order = TRUE)
p
p <- SCpubr::do_BoxPlot(sample = sample,
                        feature = "nCount_RNA",
                        group.by = "subtype",
                        split.by = "technology",
                        flip = TRUE)
p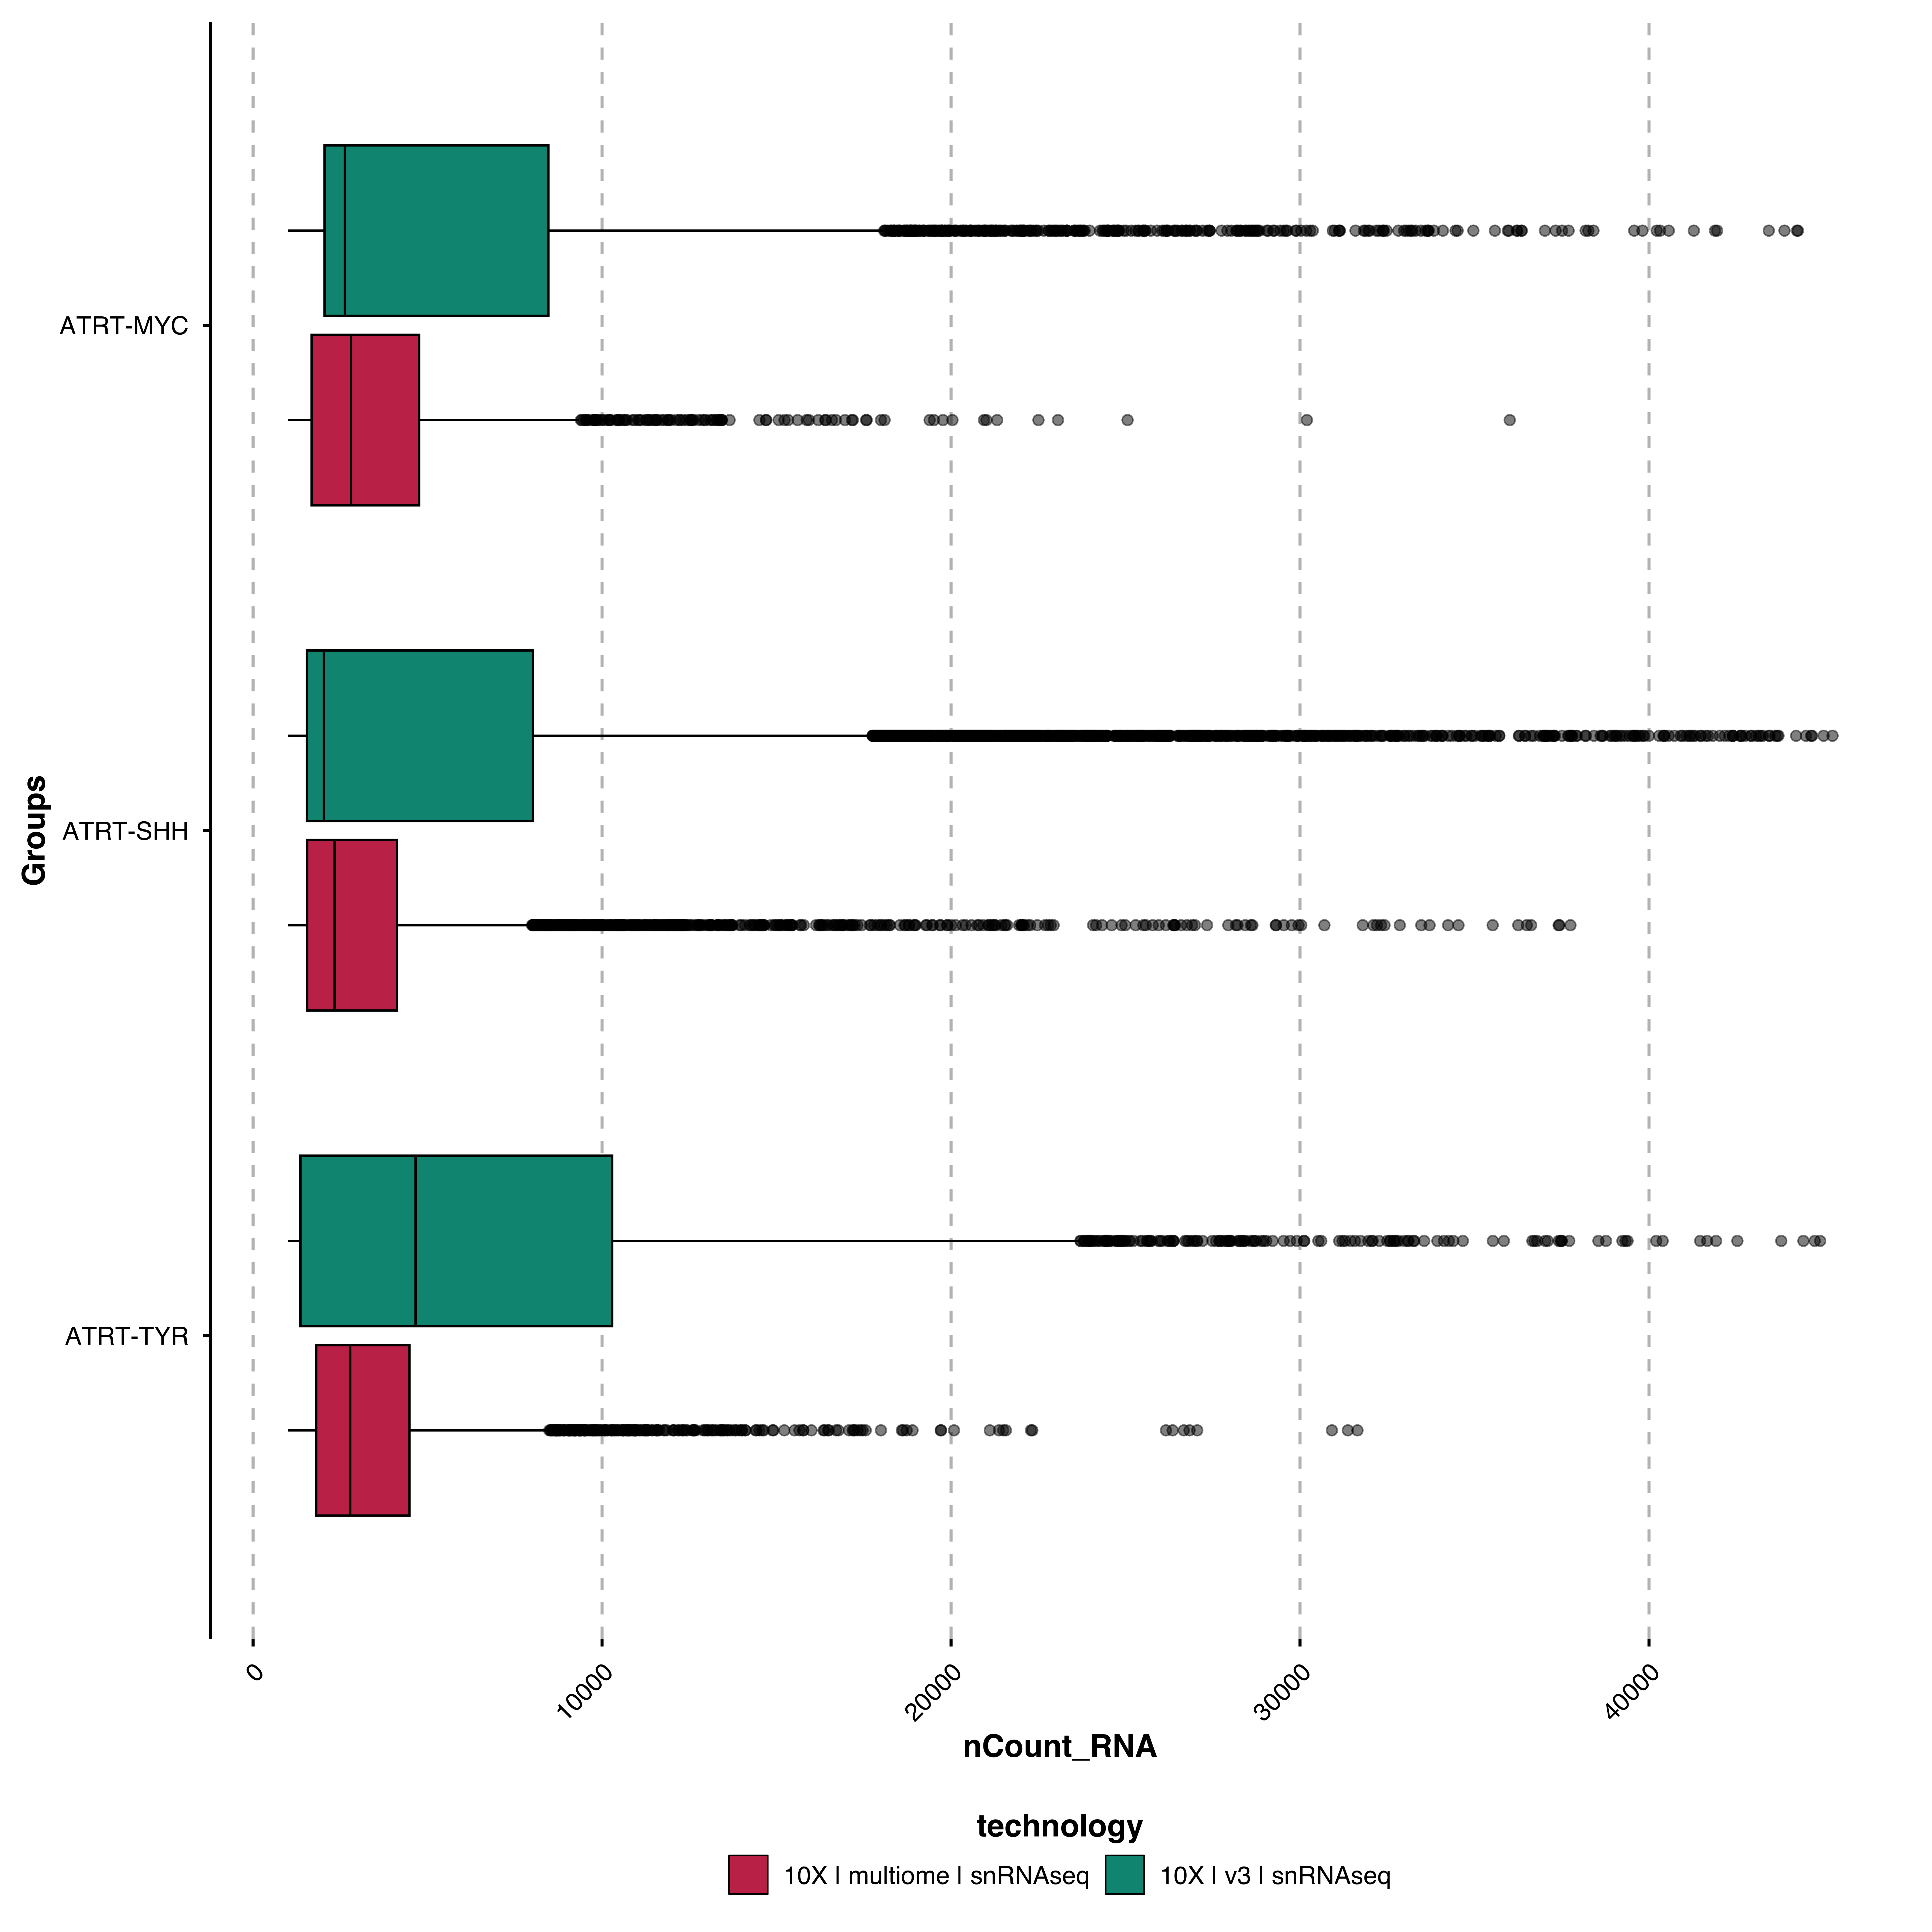
Add significance annotations between groups:
p <- SCpubr::do_BoxPlot(sample = sample,,
                        feature = "nFeature_RNA",
                        group.by = "subtype",
                        flip = TRUE,
                        order = TRUE,
                        use_test = TRUE,
                        comparisons = list(c("ATRT-TYR", "ATRT-SHH")),
                        test = "wilcox.test")
p
use_test cannot be combined with split.by.
p <- SCpubr::do_BoxPlot(sample = sample,
                        feature = "nFeature_RNA",
                        group.by = "subtype",
                        flip = TRUE,
                        order = TRUE,
                        use_test = TRUE,
                        comparisons = list(c("ATRT-TYR", "ATRT-SHH")),
                        test = "wilcox.test",
                        map_signif_level = c("***" = 0.0001,
                                             "**" = 0.001,
                                             "*" = 0.05))
p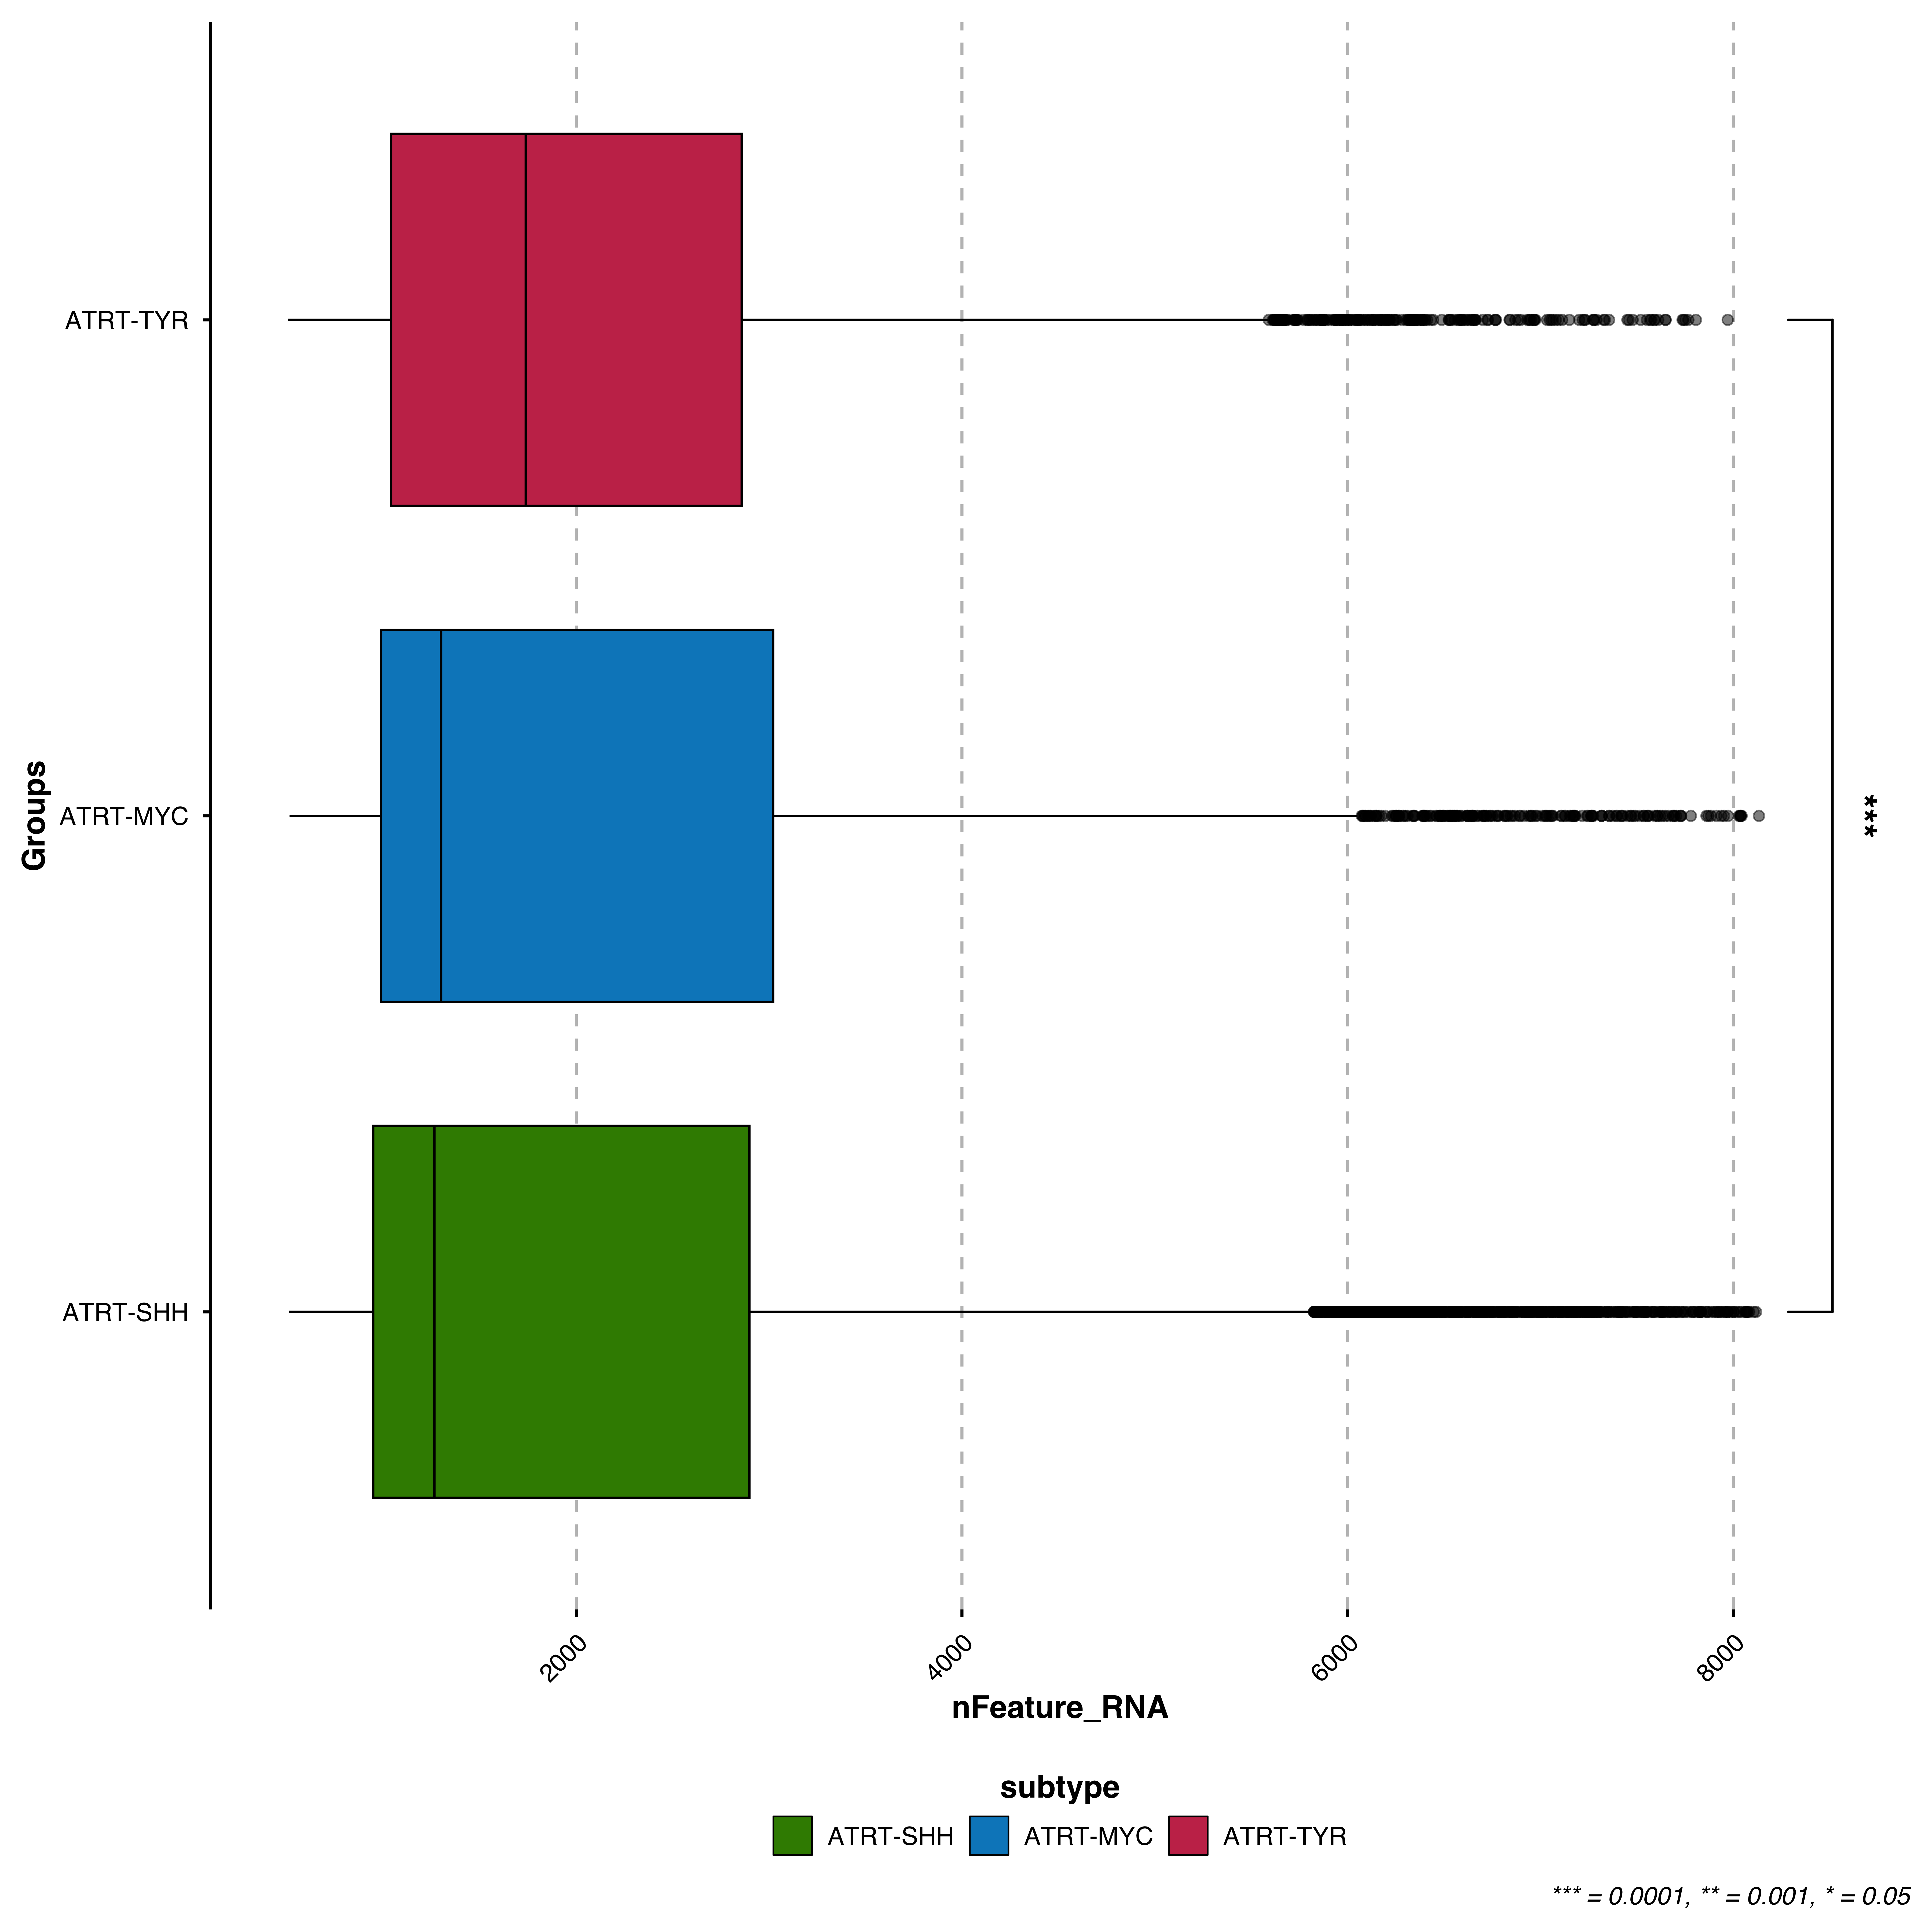
Color borders instead of fill:
p <- SCpubr::do_BoxPlot(sample = sample,
                        feature = "nFeature_RNA",
                        group.by = "subtype",
                        flip = TRUE,
                        use_silhouette = TRUE)
p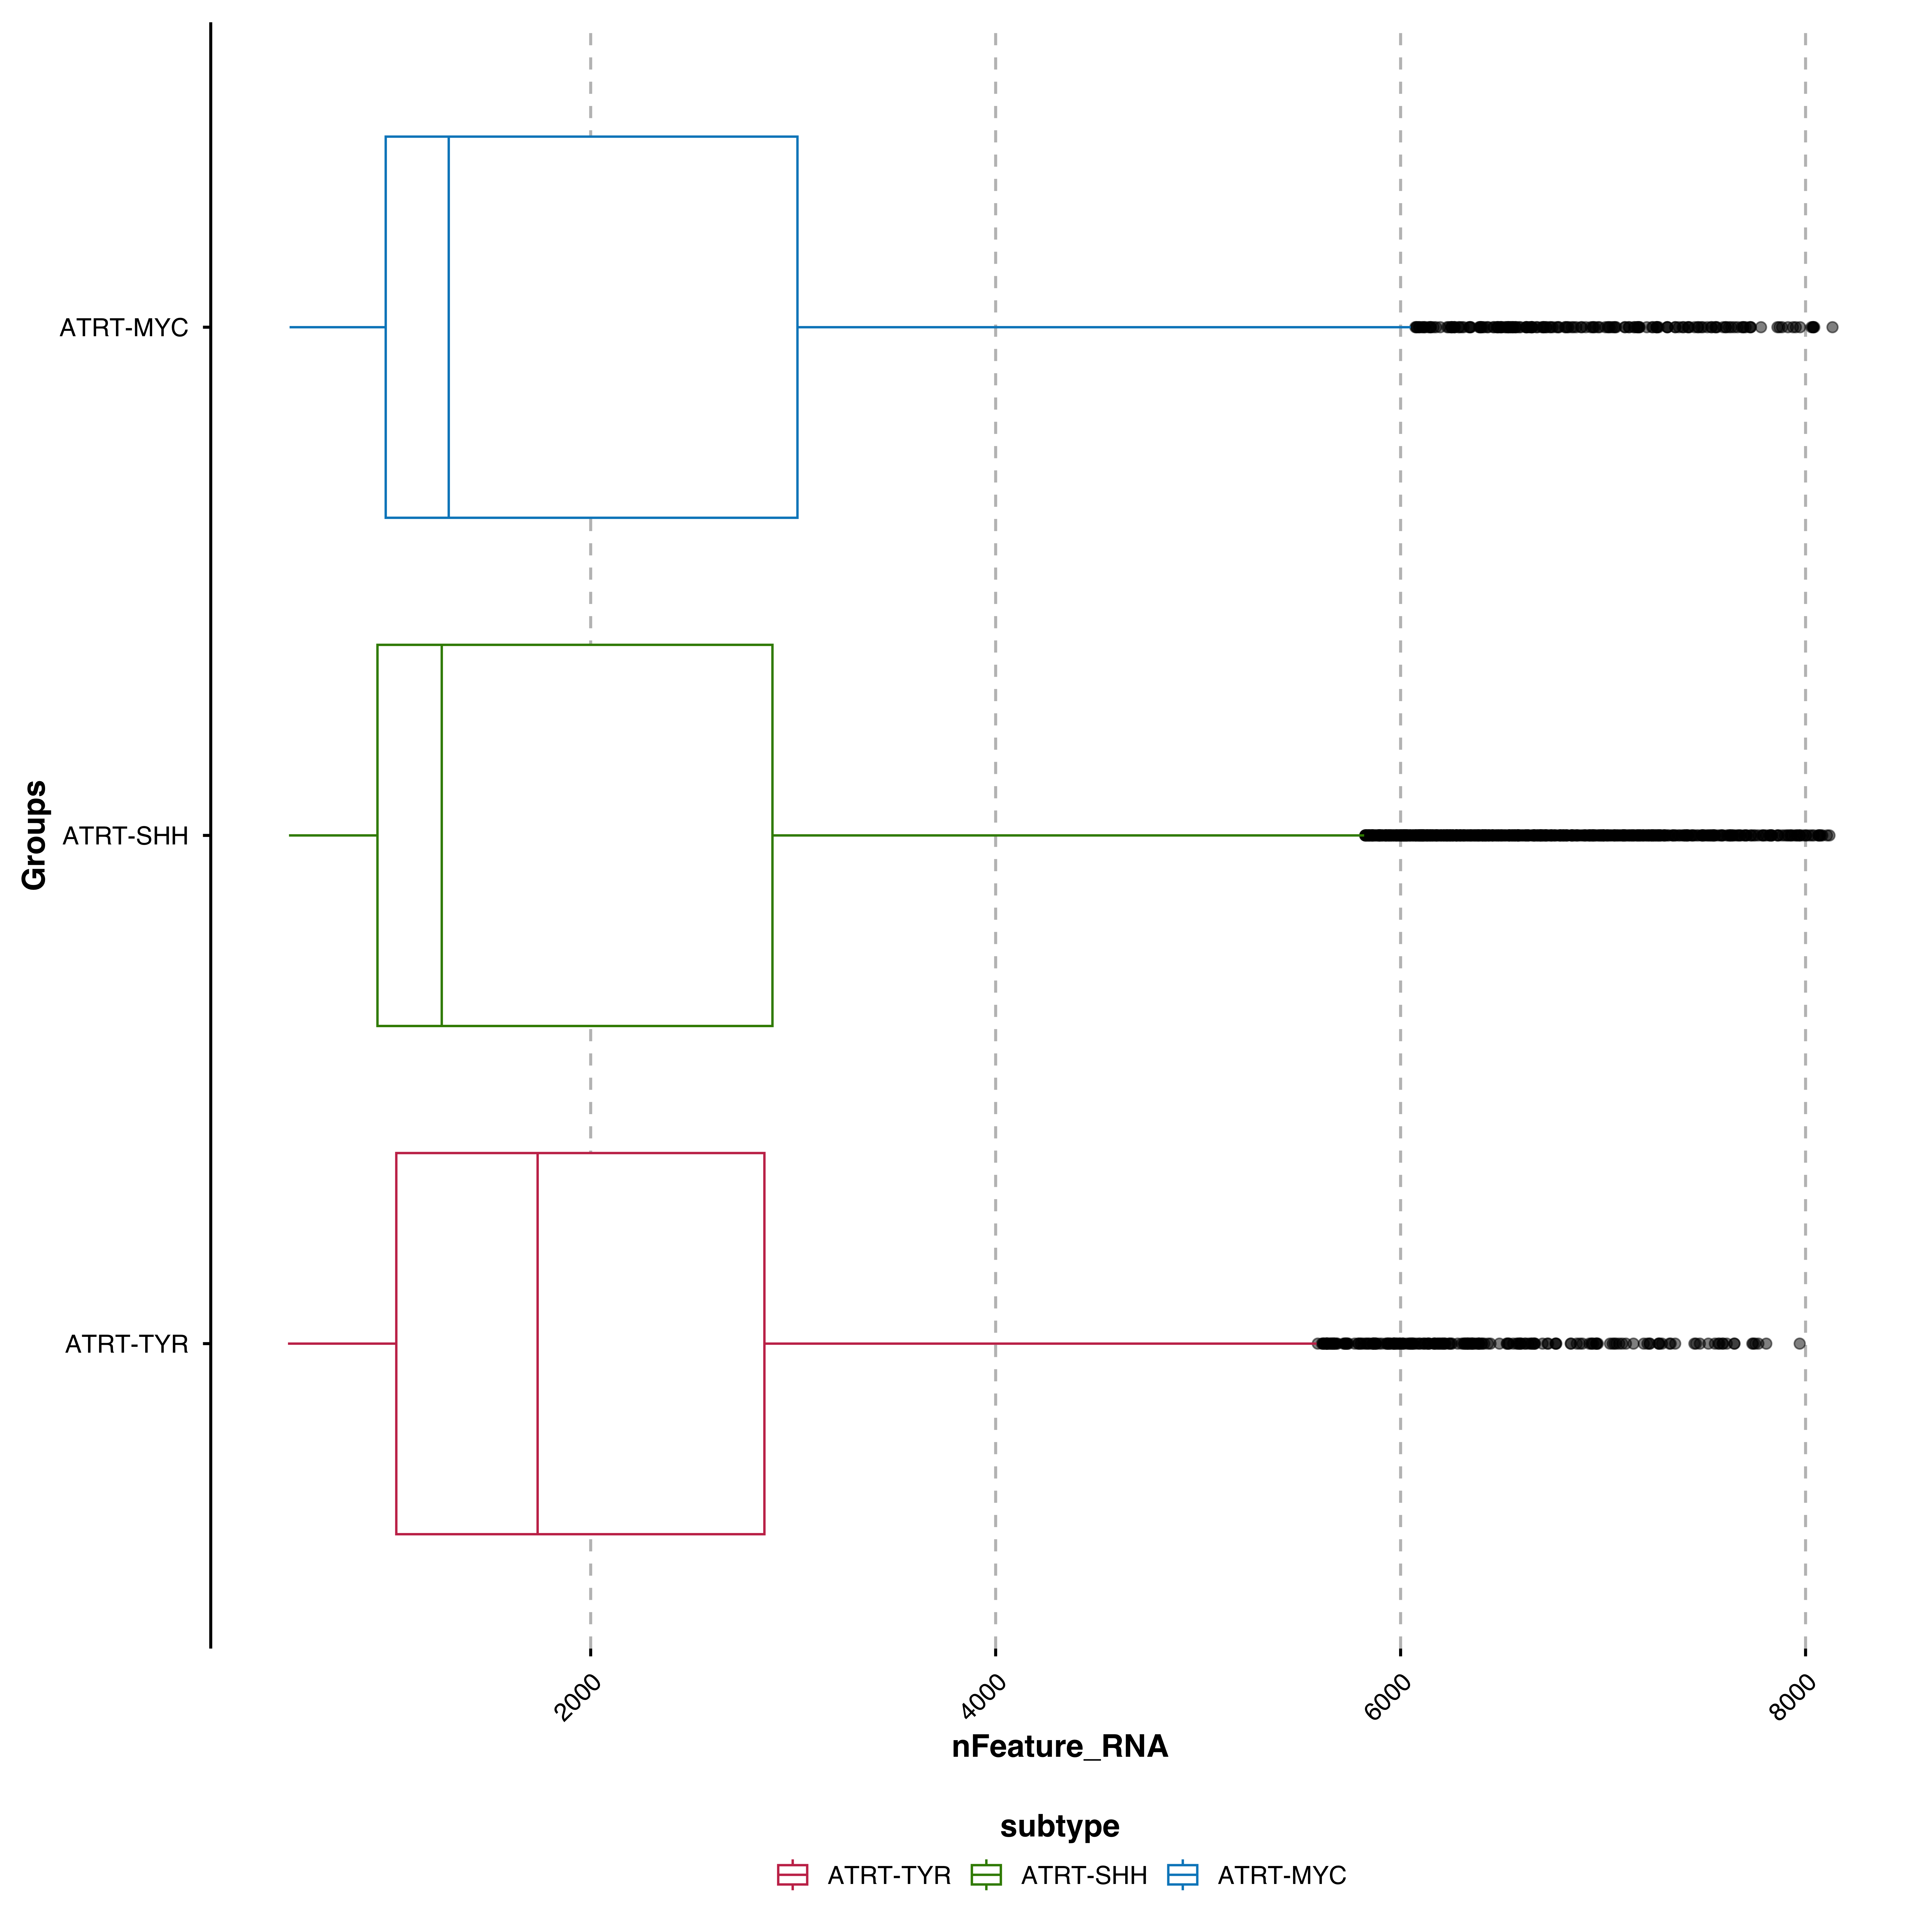
For parameters shared across many functions (color palettes, typography, legend styling, grid), see Shared features.
| Parameter | Description | Default |
|---|---|---|
feature |
Feature to plot | — |
| Parameter | Description | Default |
|---|---|---|
use_test |
Add significance testing | FALSE |
comparisons |
List of group pairs to compare | NULL |
test |
Test method | "wilcox.test" |
map_signif_level |
P-value to symbol mapping | See defaults |
| Parameter | Description | Default |
|---|---|---|
use_silhouette |
Color borders instead of fill | FALSE |
boxplot.line.color |
Border color | "black" |
boxplot.linewidth |
Border width | 0.5 |
boxplot.width |
Box width | NULL |
outlier.color |
Outlier dot color | "black" |
outlier.alpha |
Outlier transparency | 0.5 |
order |
Order groups by median | FALSE |