p <- SCpubr::do_ViolinPlot(sample = sample,
                           features = "nFeature_RNA",
                           group.by = "subtype")
p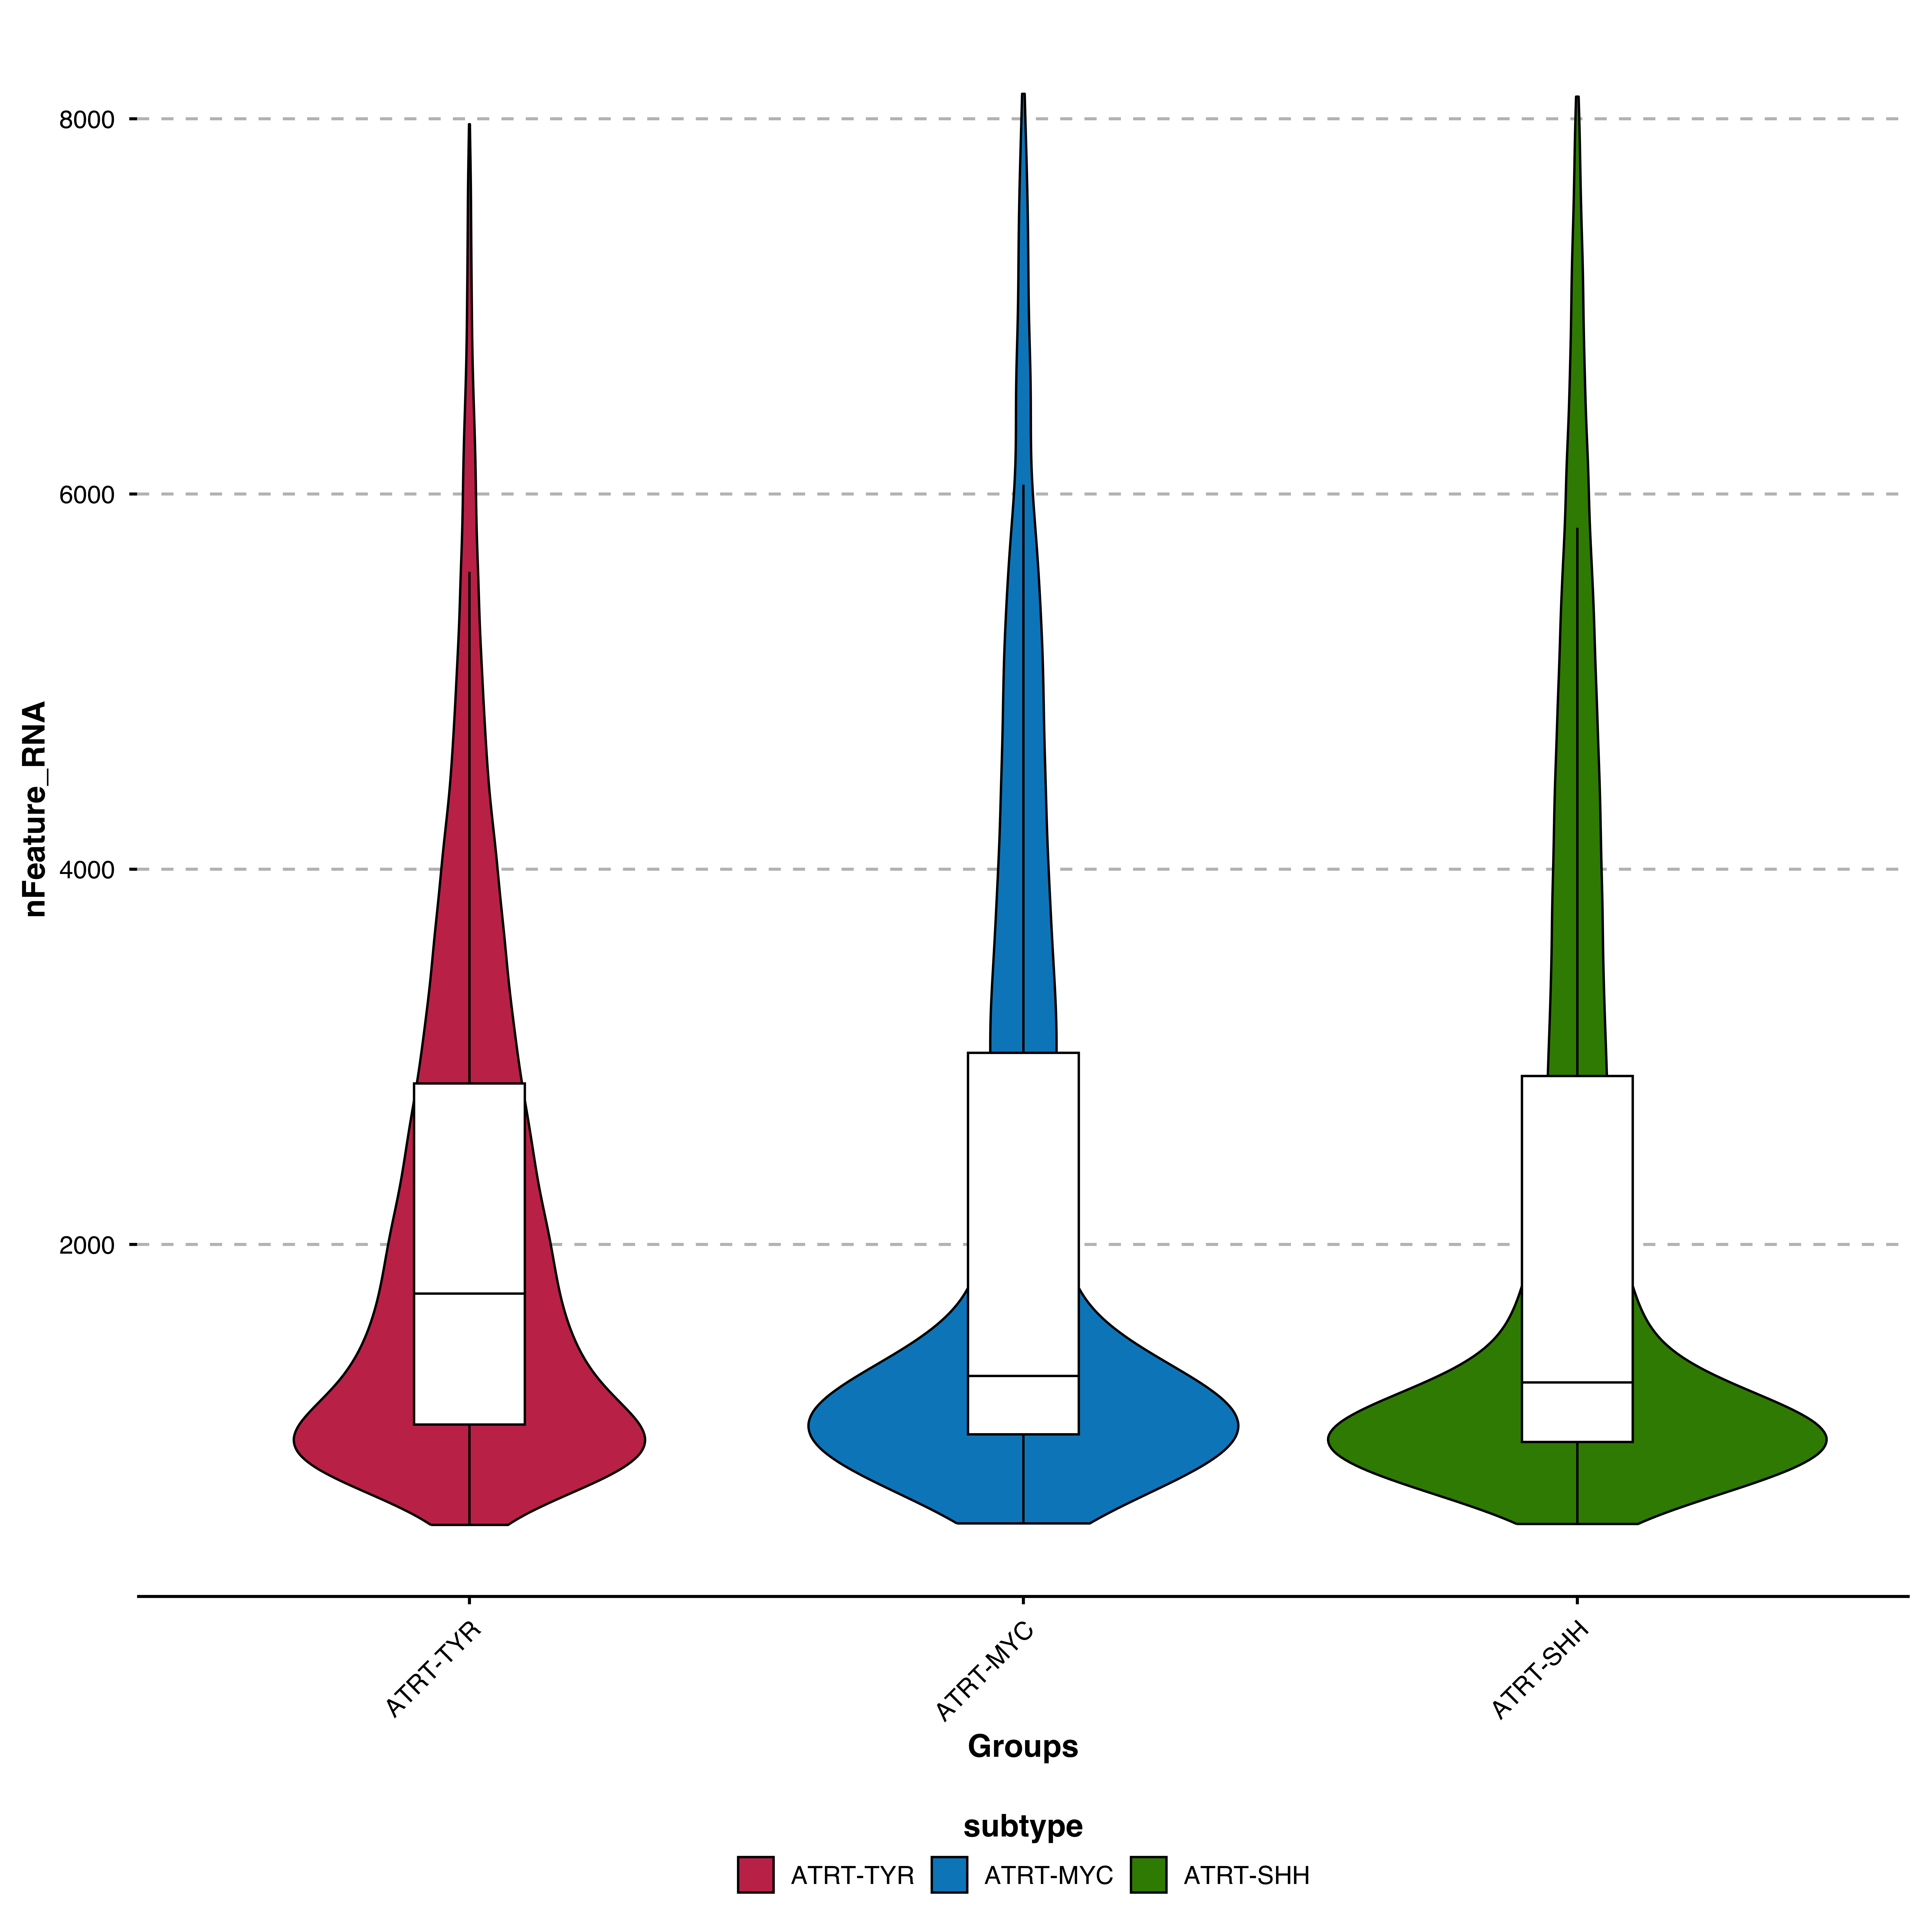
Violin plots show the full distribution shape of gene expression across groups. They combine the benefits of box plots and kernel density plots.
p <- SCpubr::do_ViolinPlot(sample = sample,
features = "nFeature_RNA",
group.by = "subtype")
p
p <- SCpubr::do_ViolinPlot(sample = sample,
                           features = c("nCount_RNA", "nFeature_RNA"),
                           group.by = "subtype",
                           ncol = 2)
p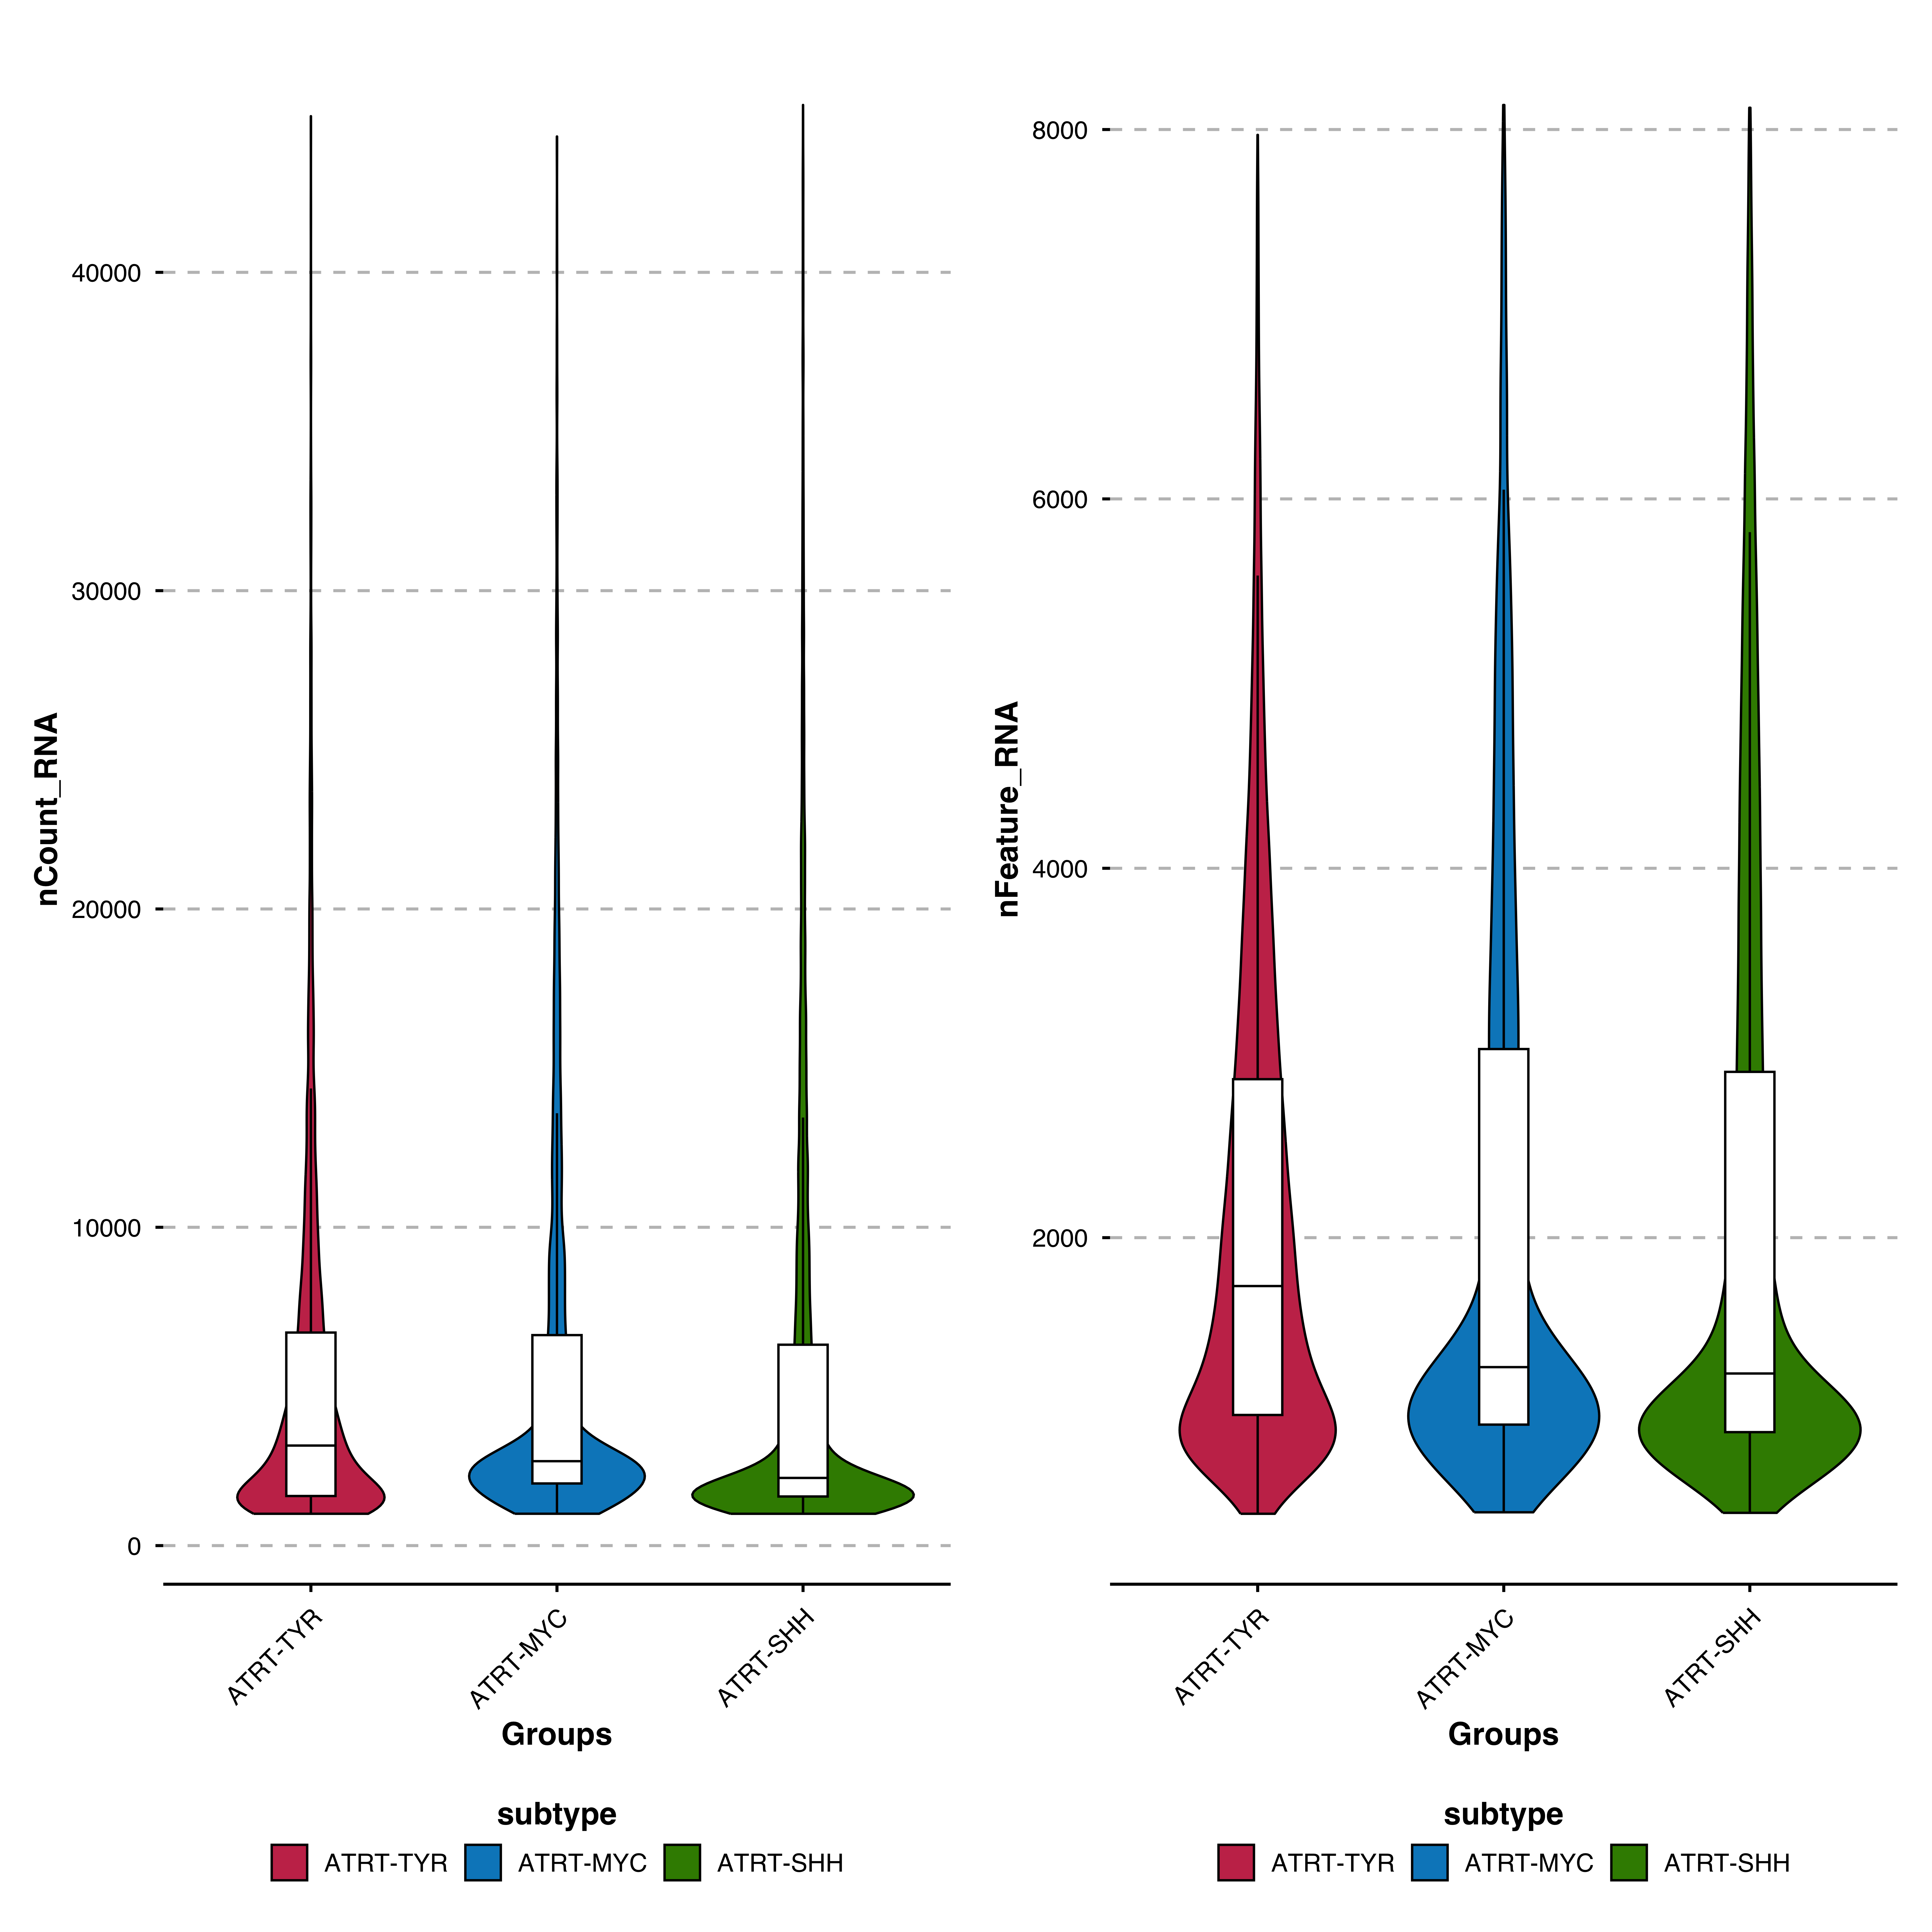
Force all features to use the same Y-axis range:
p <- SCpubr::do_ViolinPlot(sample = sample,
                           features = c("nCount_RNA", "nFeature_RNA"),
                           group.by = "subtype",
                           ncol = 2,
                           share.y.lims = TRUE)
p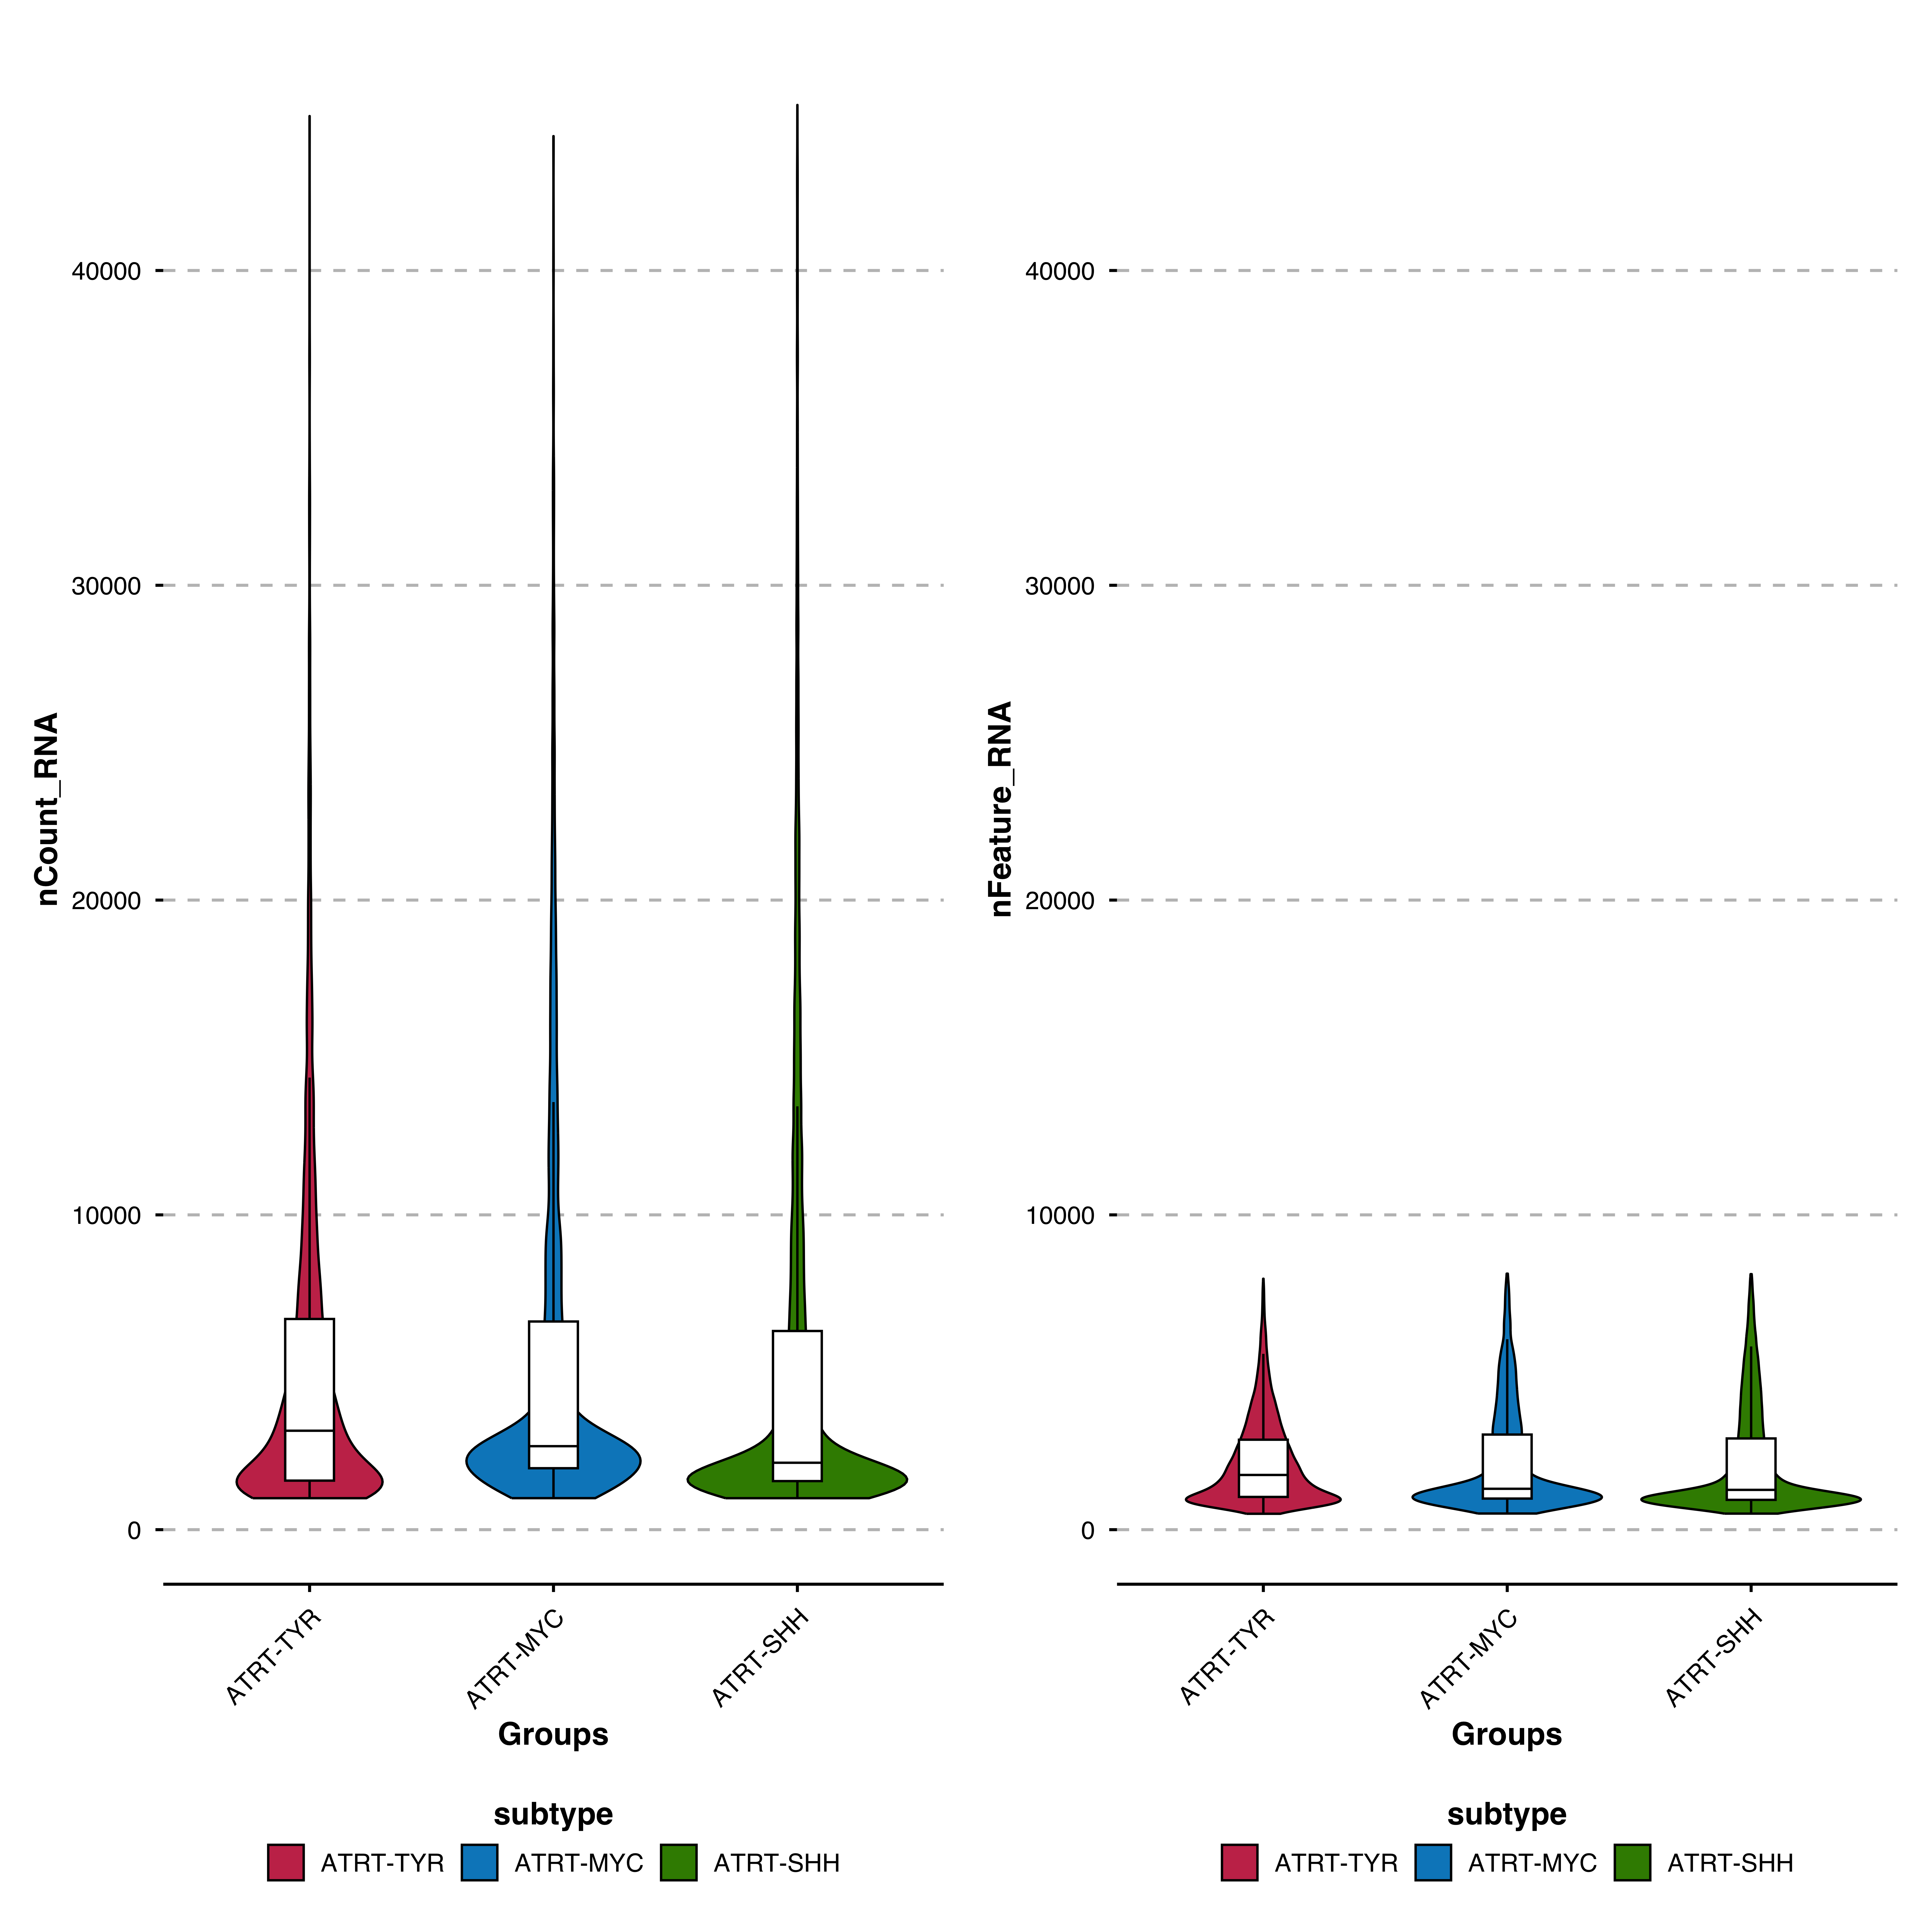
# Without boxplot
p <- SCpubr::do_ViolinPlot(sample = sample,
                           features = "nCount_RNA",
                           group.by = "subtype",
                           plot_boxplot = FALSE)
p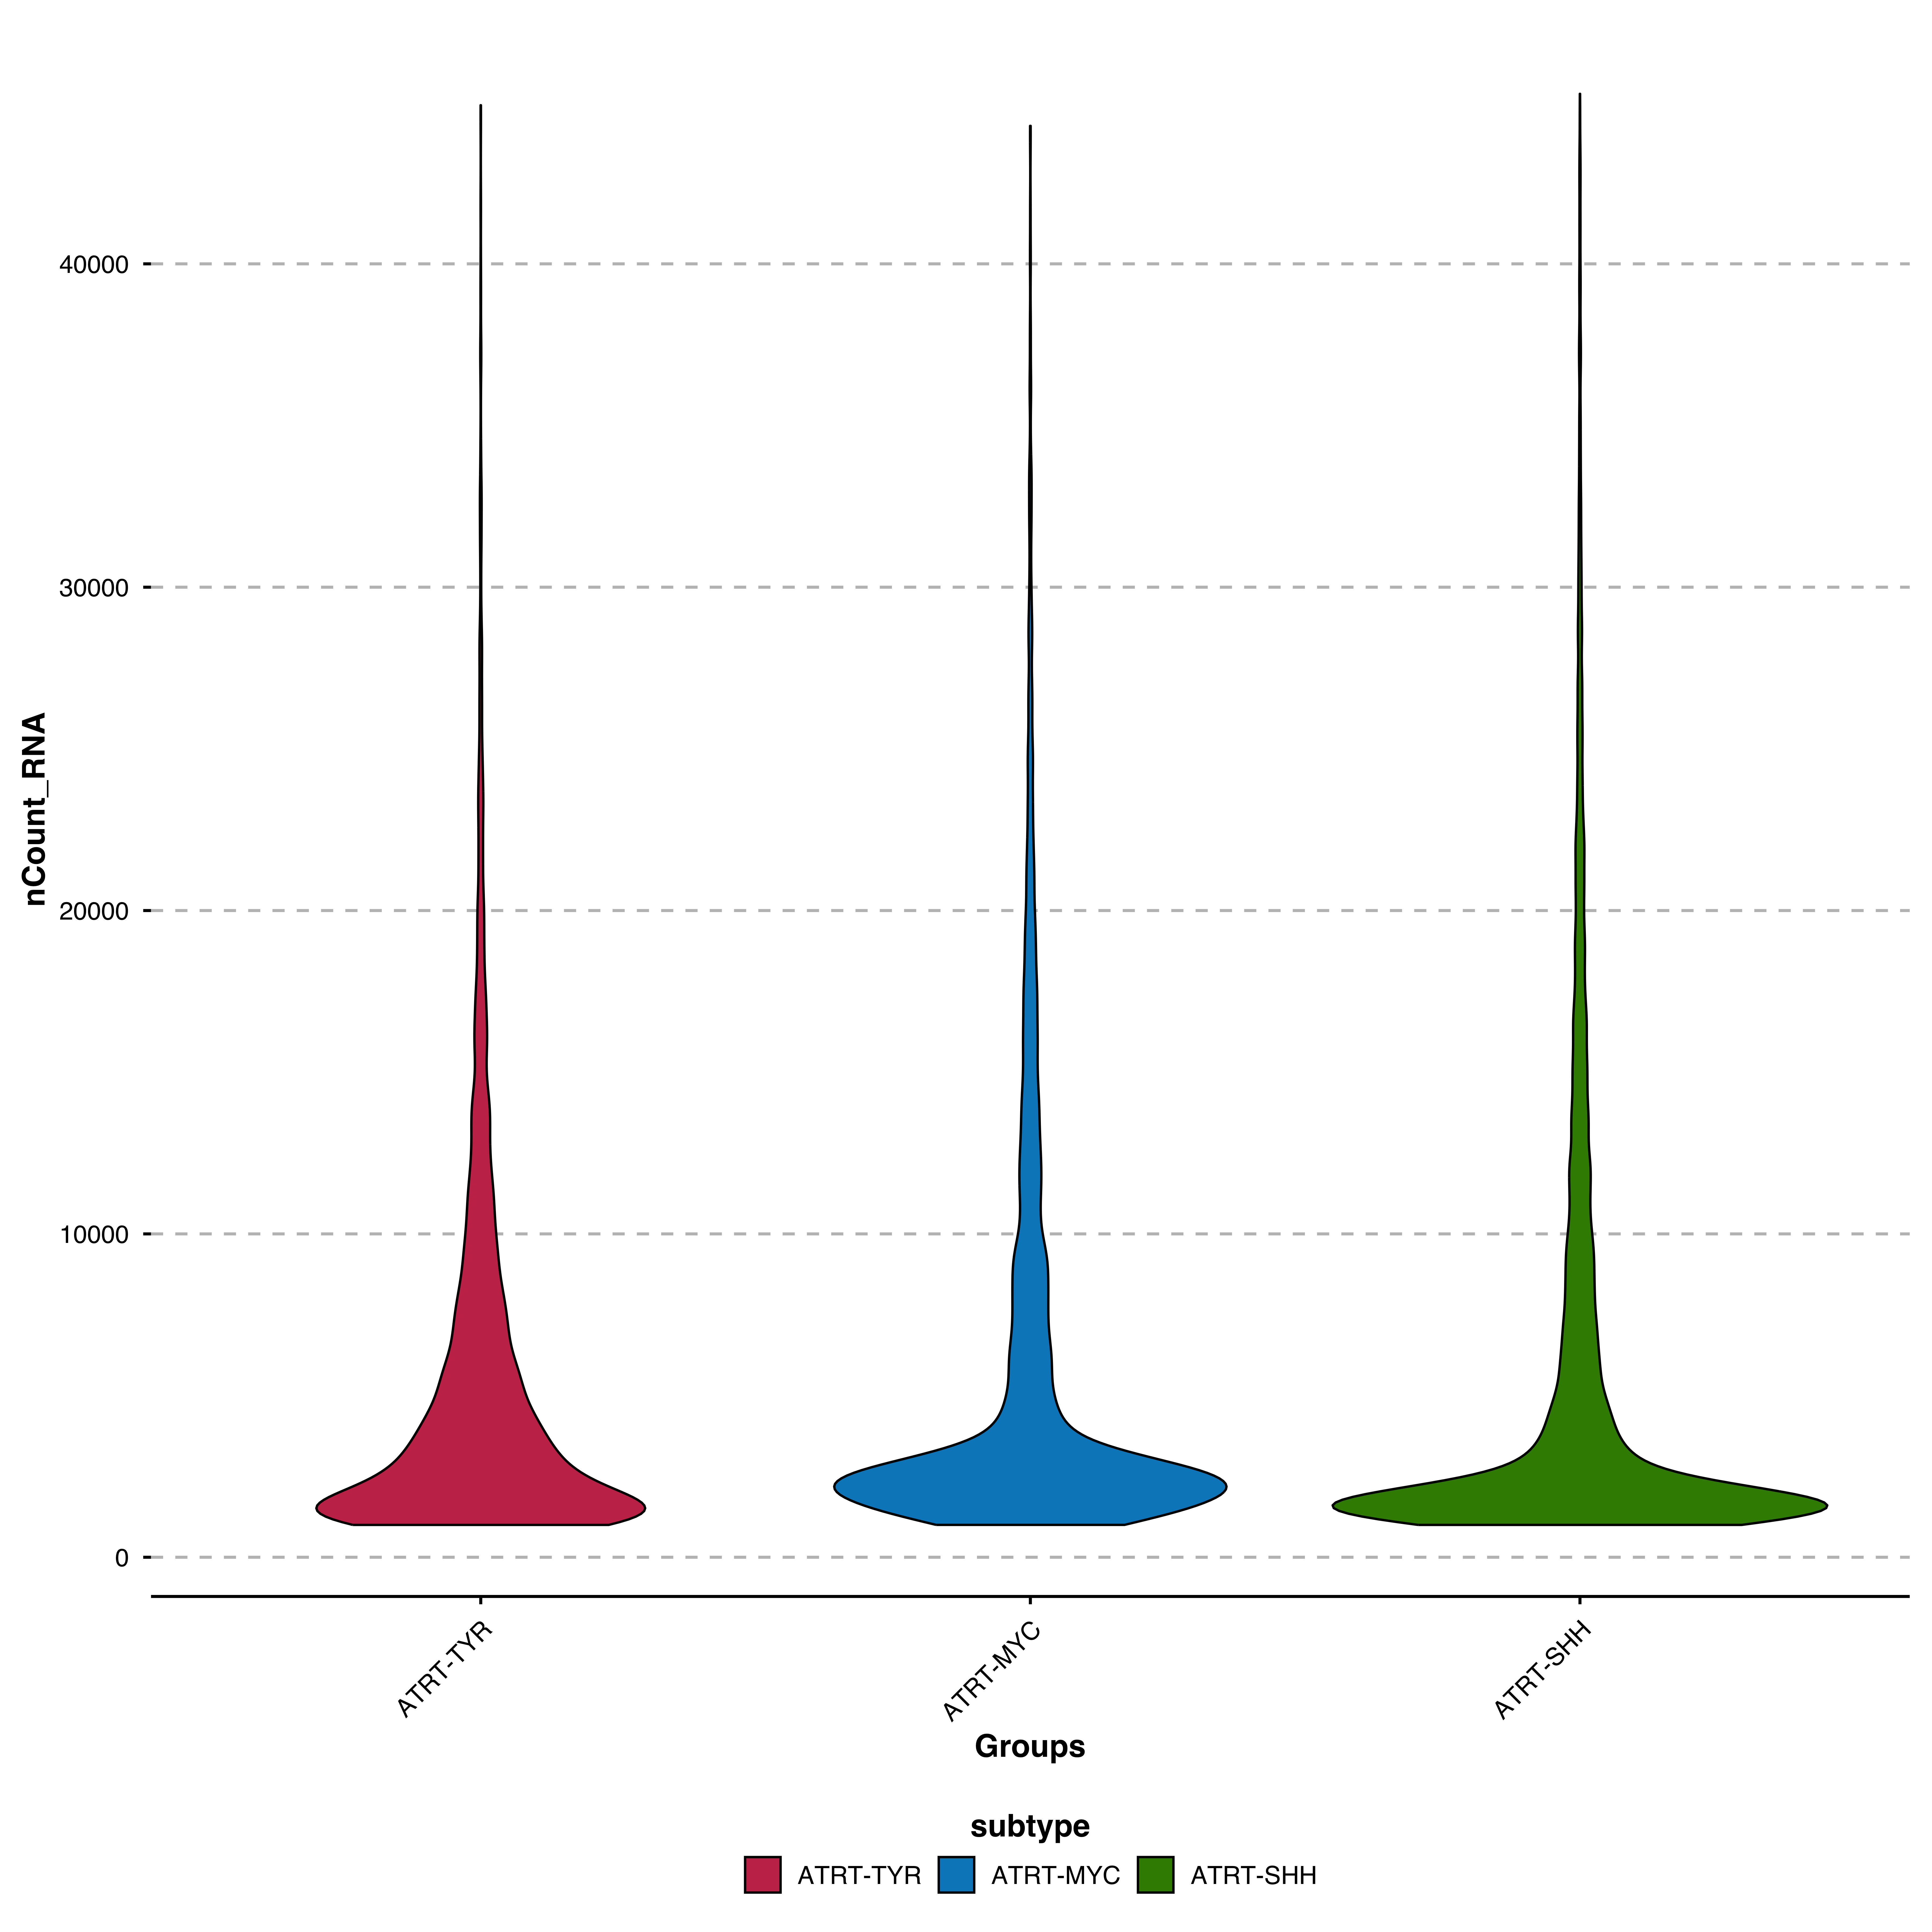
p <- SCpubr::do_ViolinPlot(sample = sample,
                           features = "nCount_RNA",
                           group.by = "subtype",
                           split.by = "technology",
                           plot_boxplot = FALSE,
                           order = FALSE)
p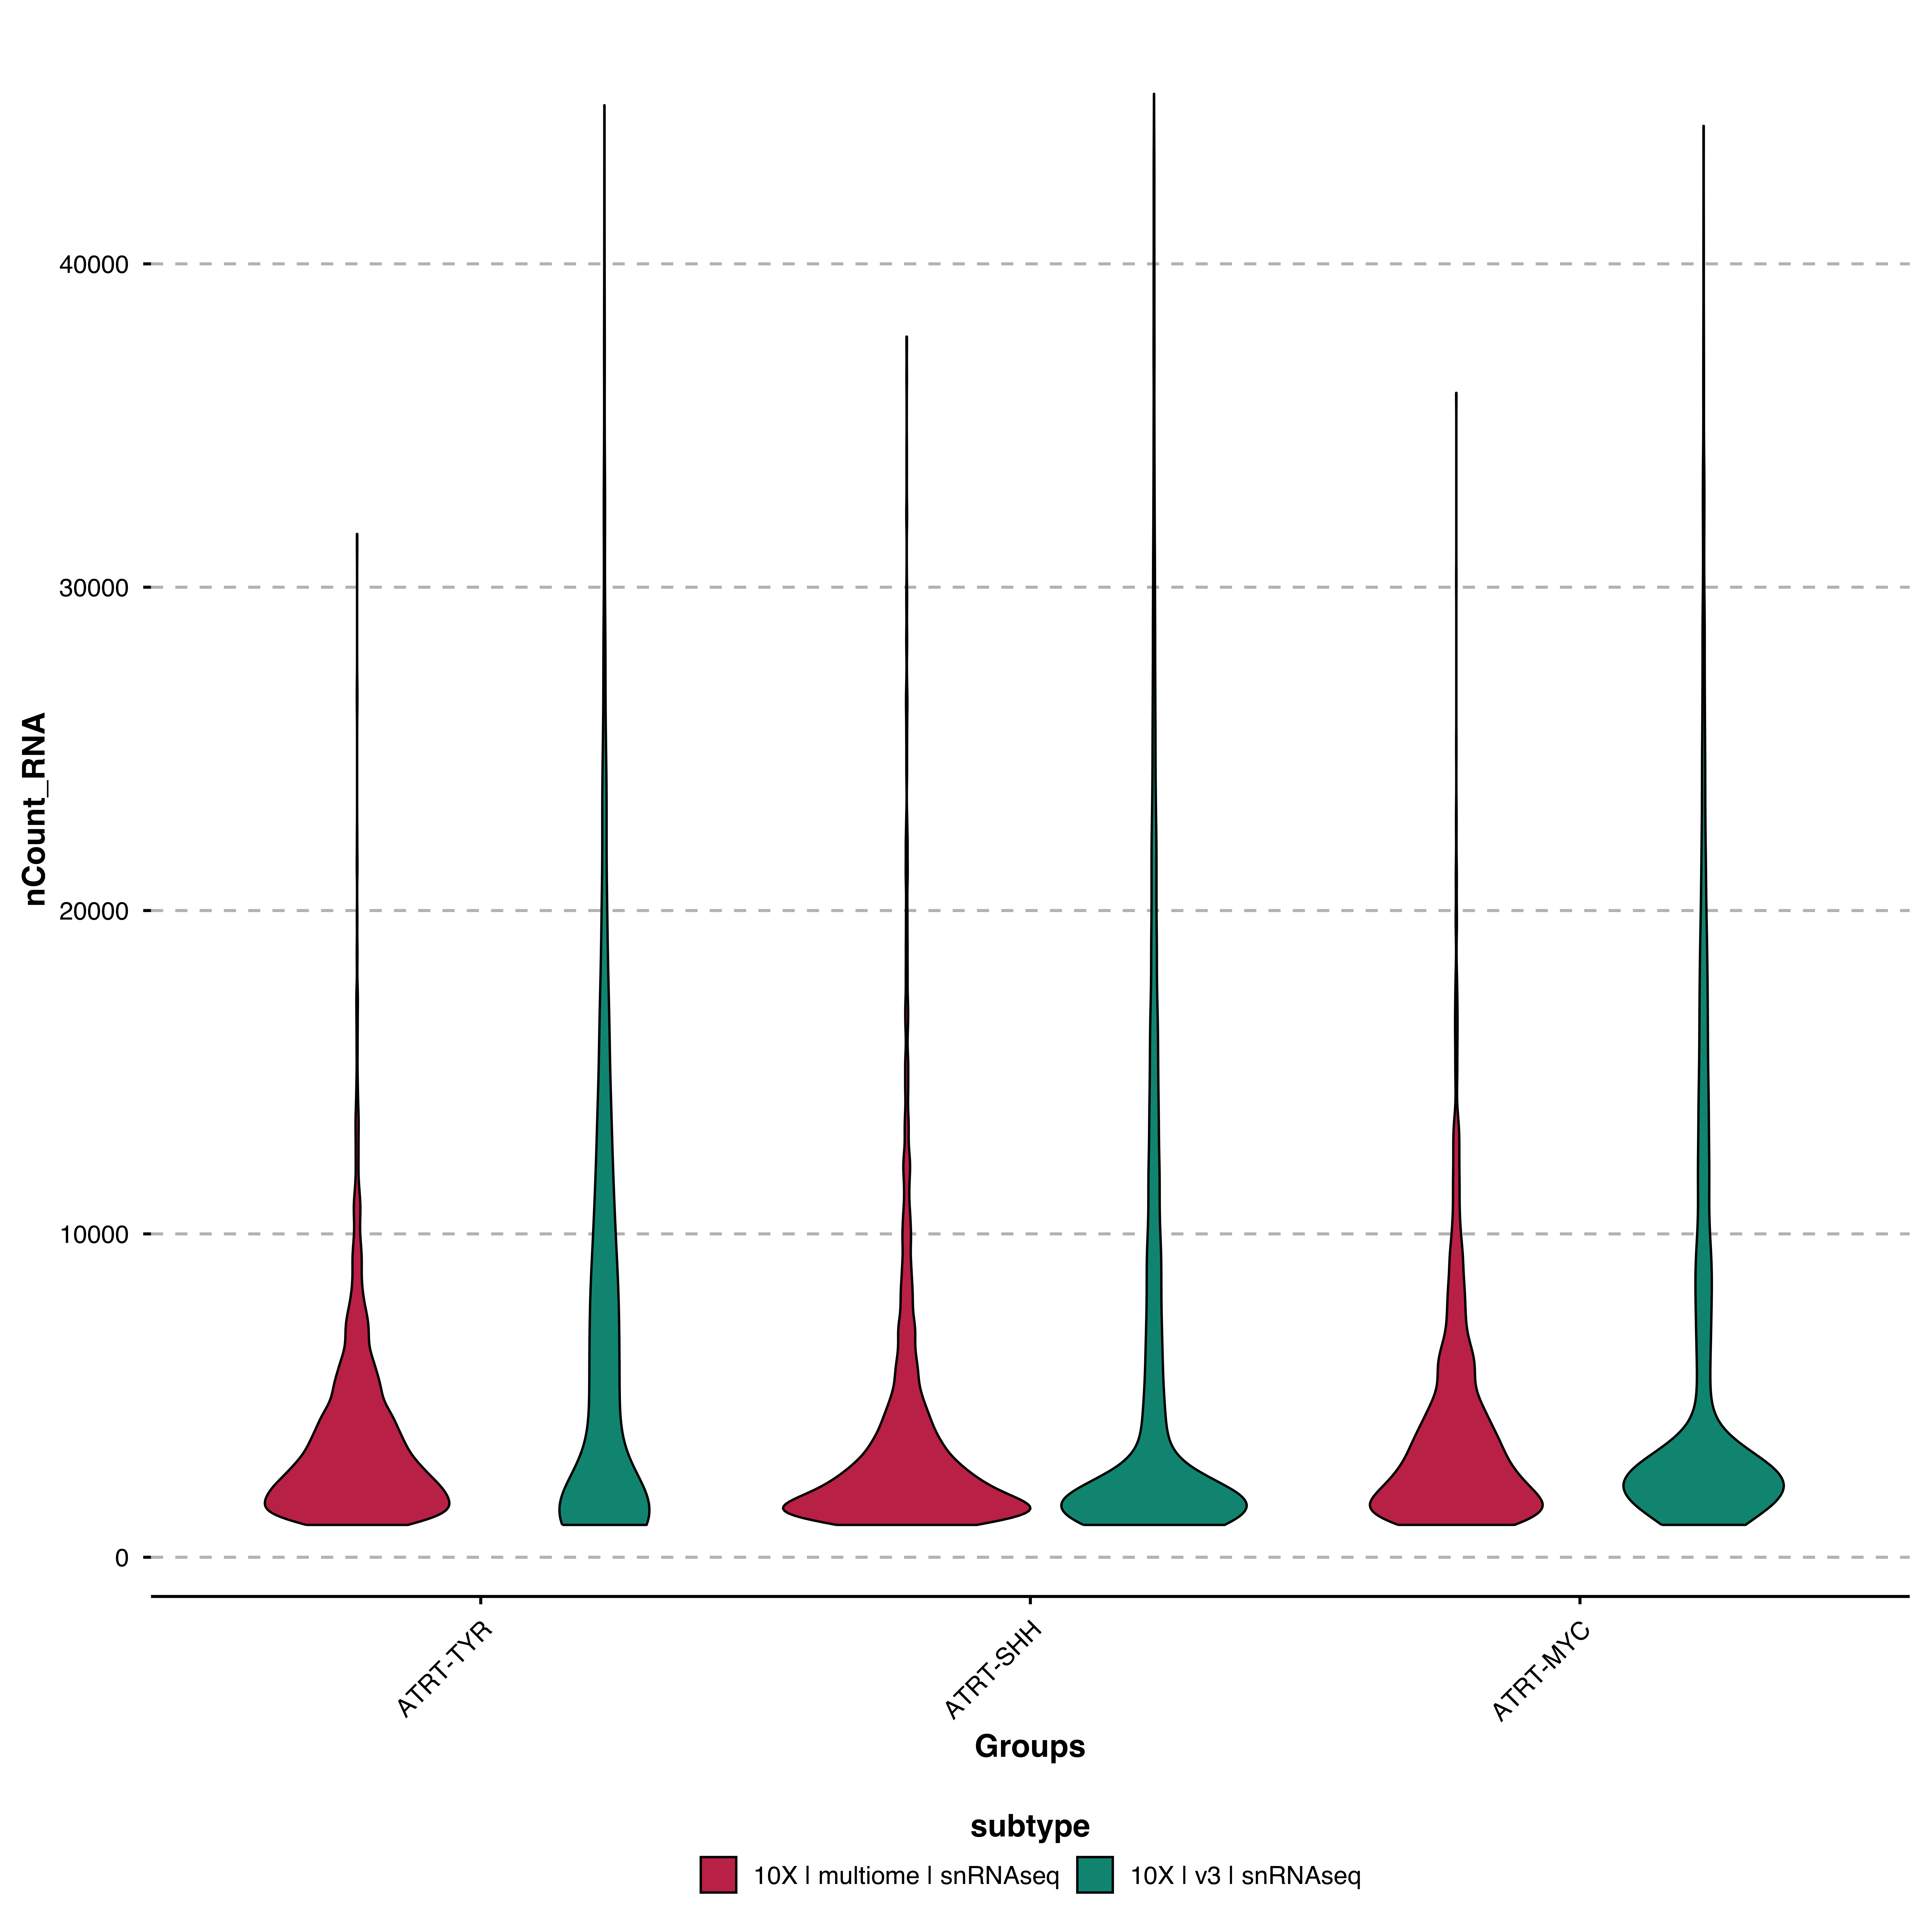
Truncate the Y-axis at a specific value:
p <- SCpubr::do_ViolinPlot(sample = sample,
                           features = "nCount_RNA",
                           group.by = "subtype",
                           y_cut = 25000)
p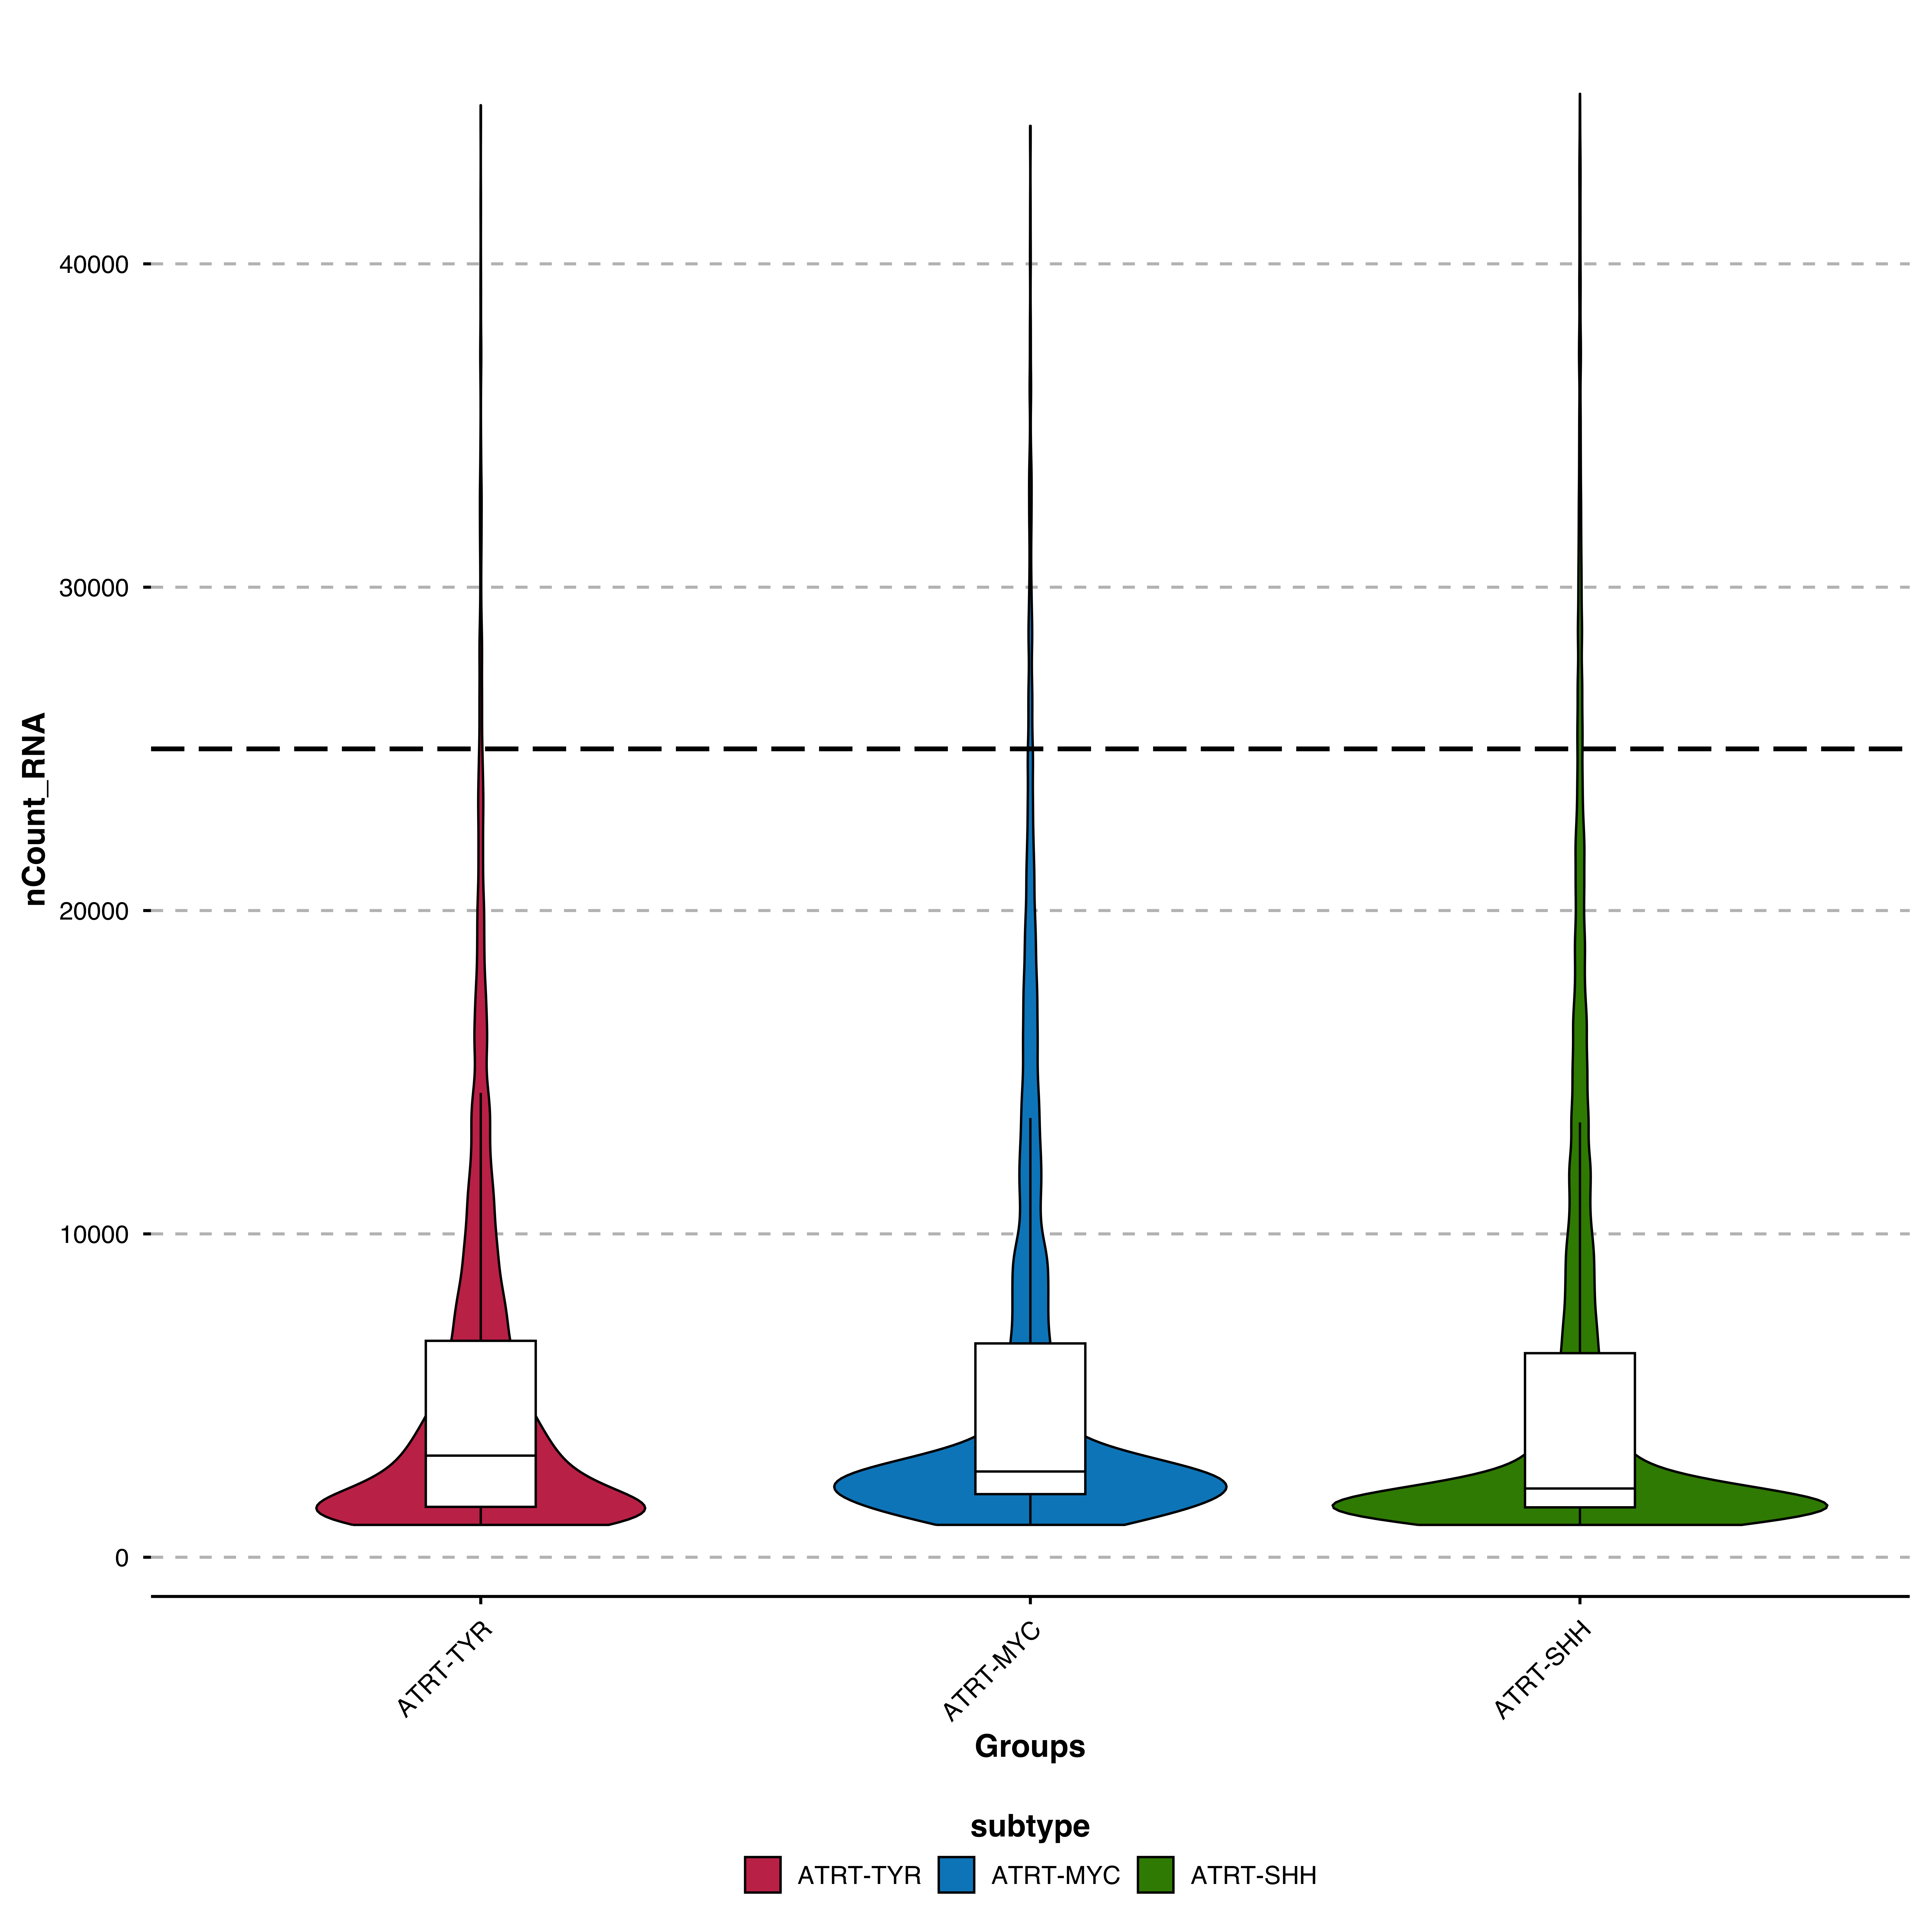
For parameters shared across many functions (color palettes, typography, legend styling, grid), see Shared features.
| Parameter | Description | Default |
|---|---|---|
features |
Features to plot | — |
| Parameter | Description | Default |
|---|---|---|
plot_boxplot |
Show inner boxplot | TRUE |
boxplot_width |
Width of inner boxplot | 0.2 |
line_width |
Violin border width | 0.5 |
y_cut |
Y-axis cutoff per feature | NA |
| Parameter | Description | Default |
|---|---|---|
ncol |
Columns for multiple features | NULL |
share.y.lims |
Same Y-axis for all features | FALSE |
order |
Order groups by median | TRUE |