Expression heatmaps display averaged gene expression across groups. Each cell in the heatmap represents the mean expression of a gene within a group (cluster, condition, etc.), providing a compact summary of expression patterns.
Basic usage
Create an expression heatmap for a set of genes:
genes <- c ( "CDC25C" , "KIF18B" , "KIF14" , "CENPE" , "DNAAF1" , "ADGB" , "CFAP61" , "CFAP157" ,
"KCNQ5" , "MEOX2" , "MBP" , "SNTG1" ,
"S100A1" , "MGP" , "TNNT1" , "H2AFJ" )
p <- SCpubr :: do_ExpressionHeatmap ( sample = sample , features = genes )
p
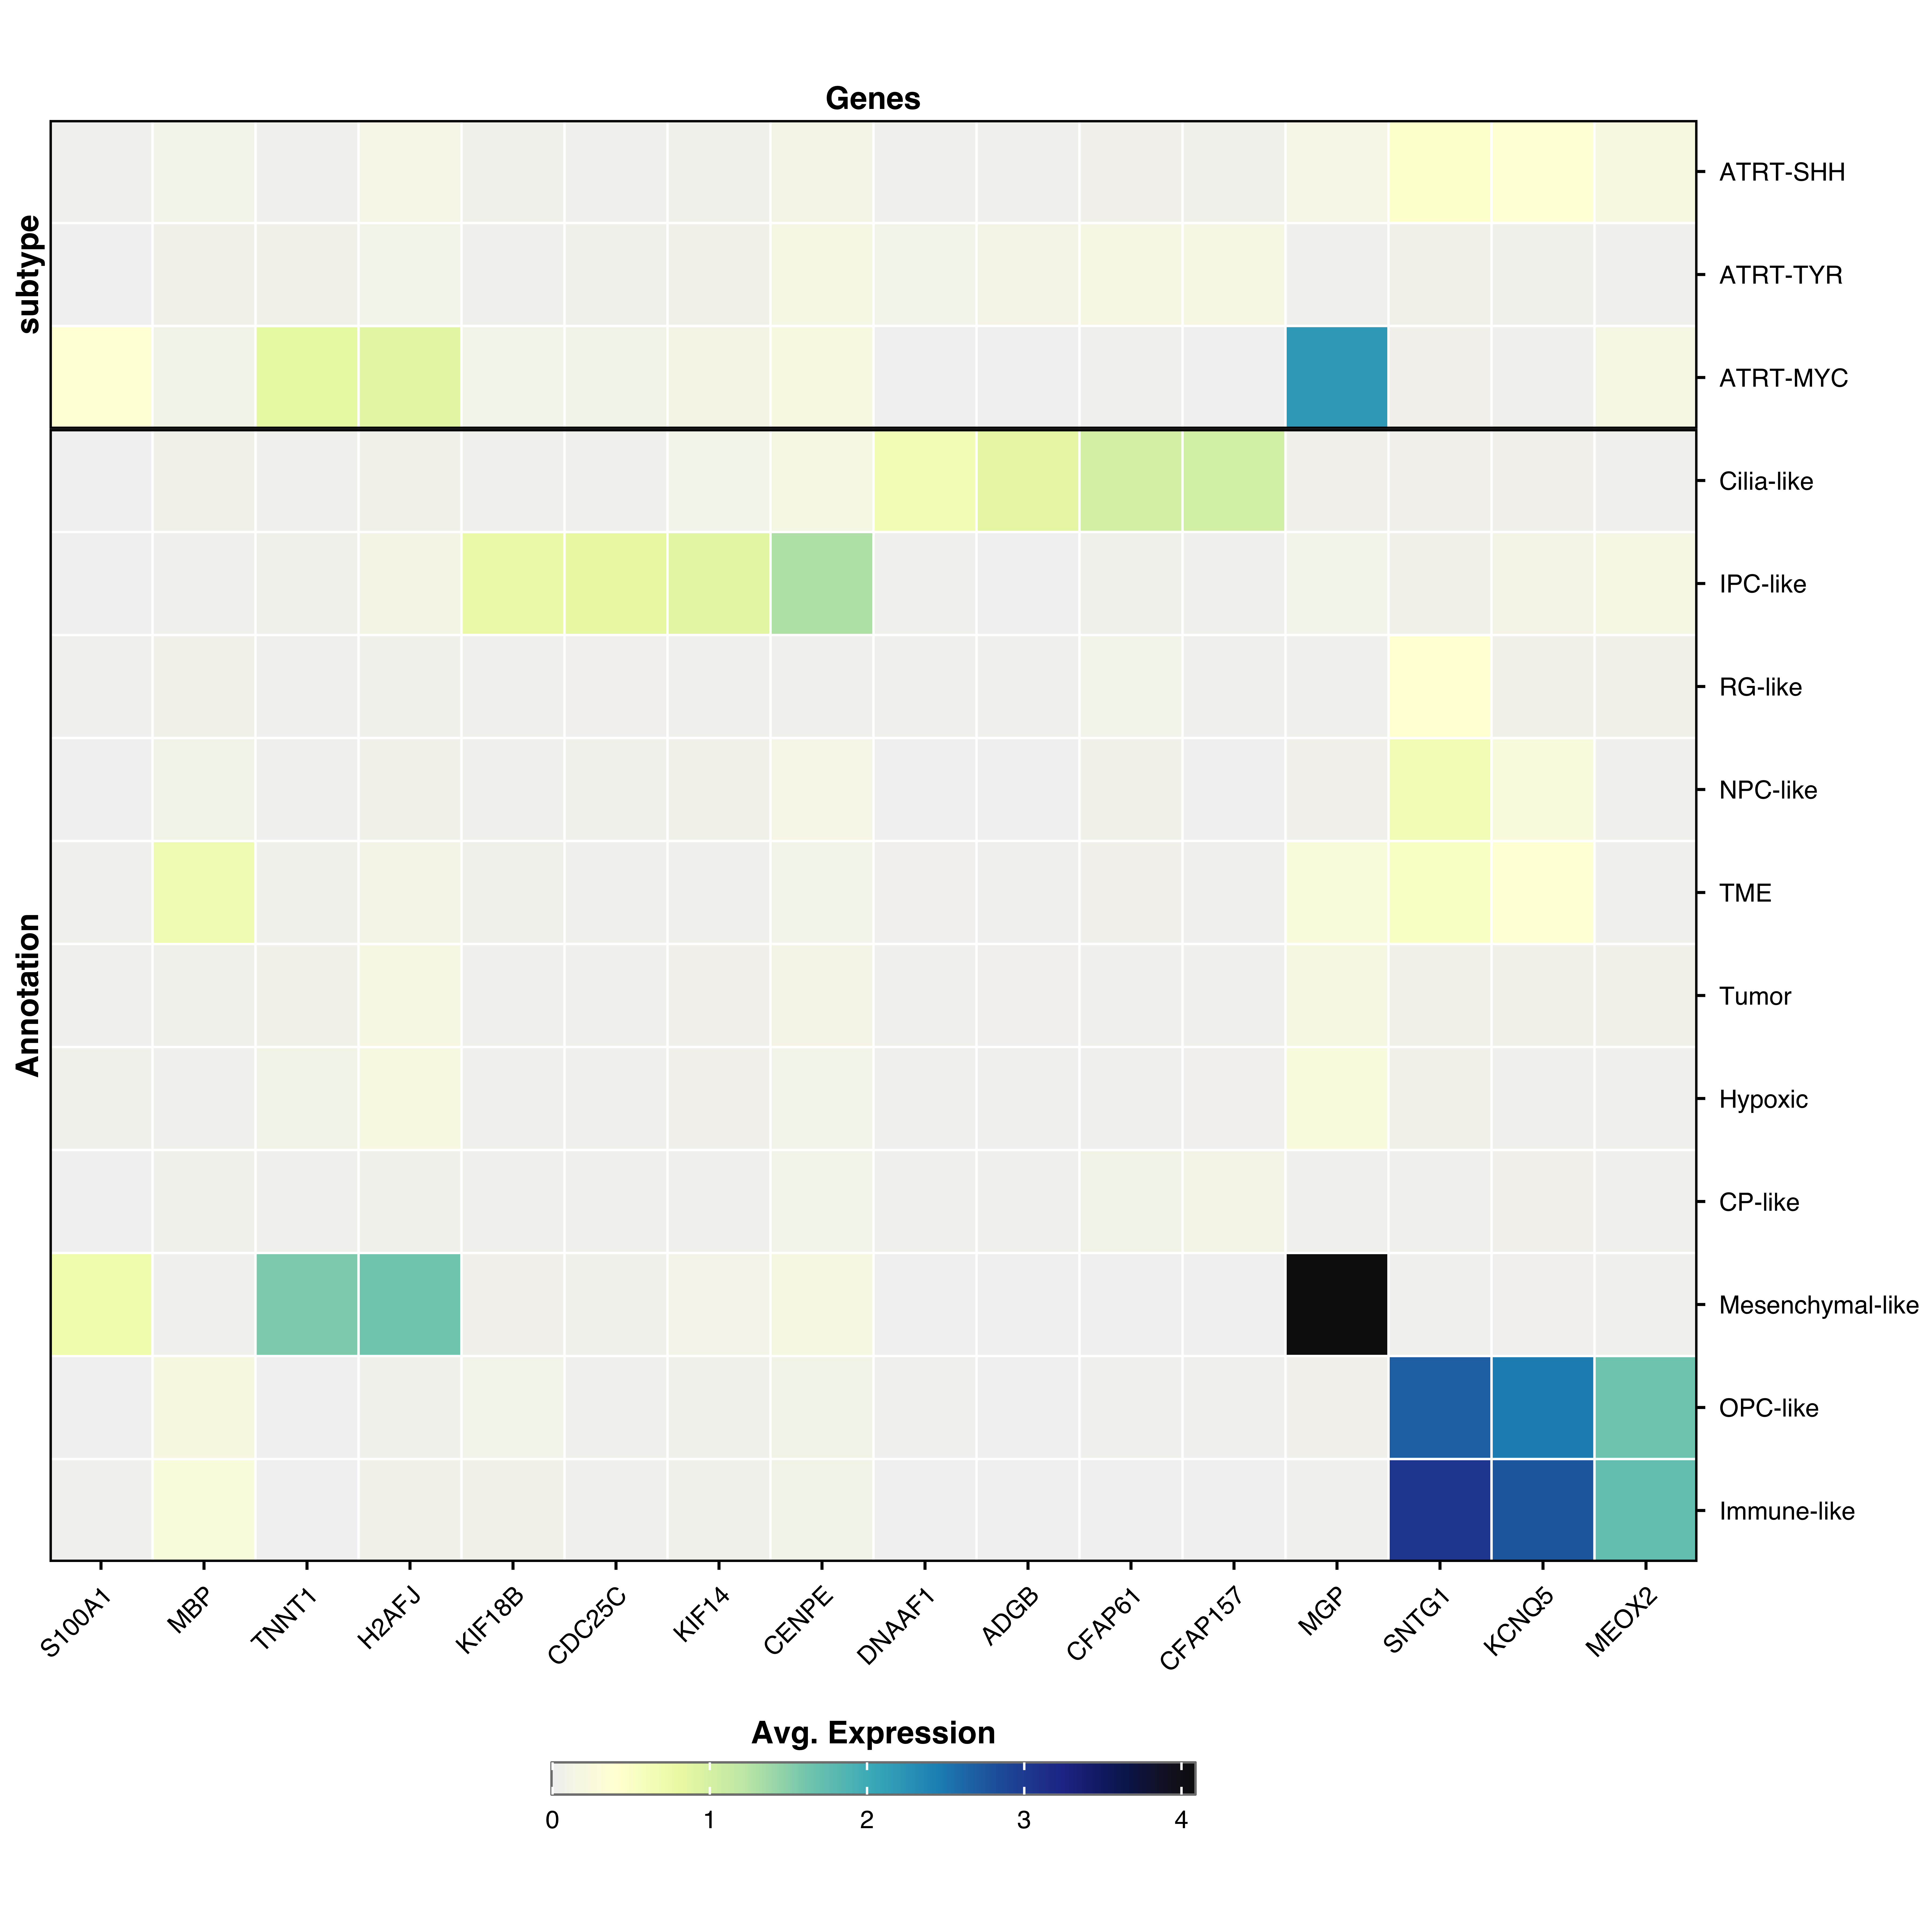
Multiple grouping variables
Group by multiple metadata variables to create stacked heatmaps:
p <- SCpubr :: do_ExpressionHeatmap ( sample = sample , features = genes ,
group.by = c ( "Annotation" , "subtype" ) )
p
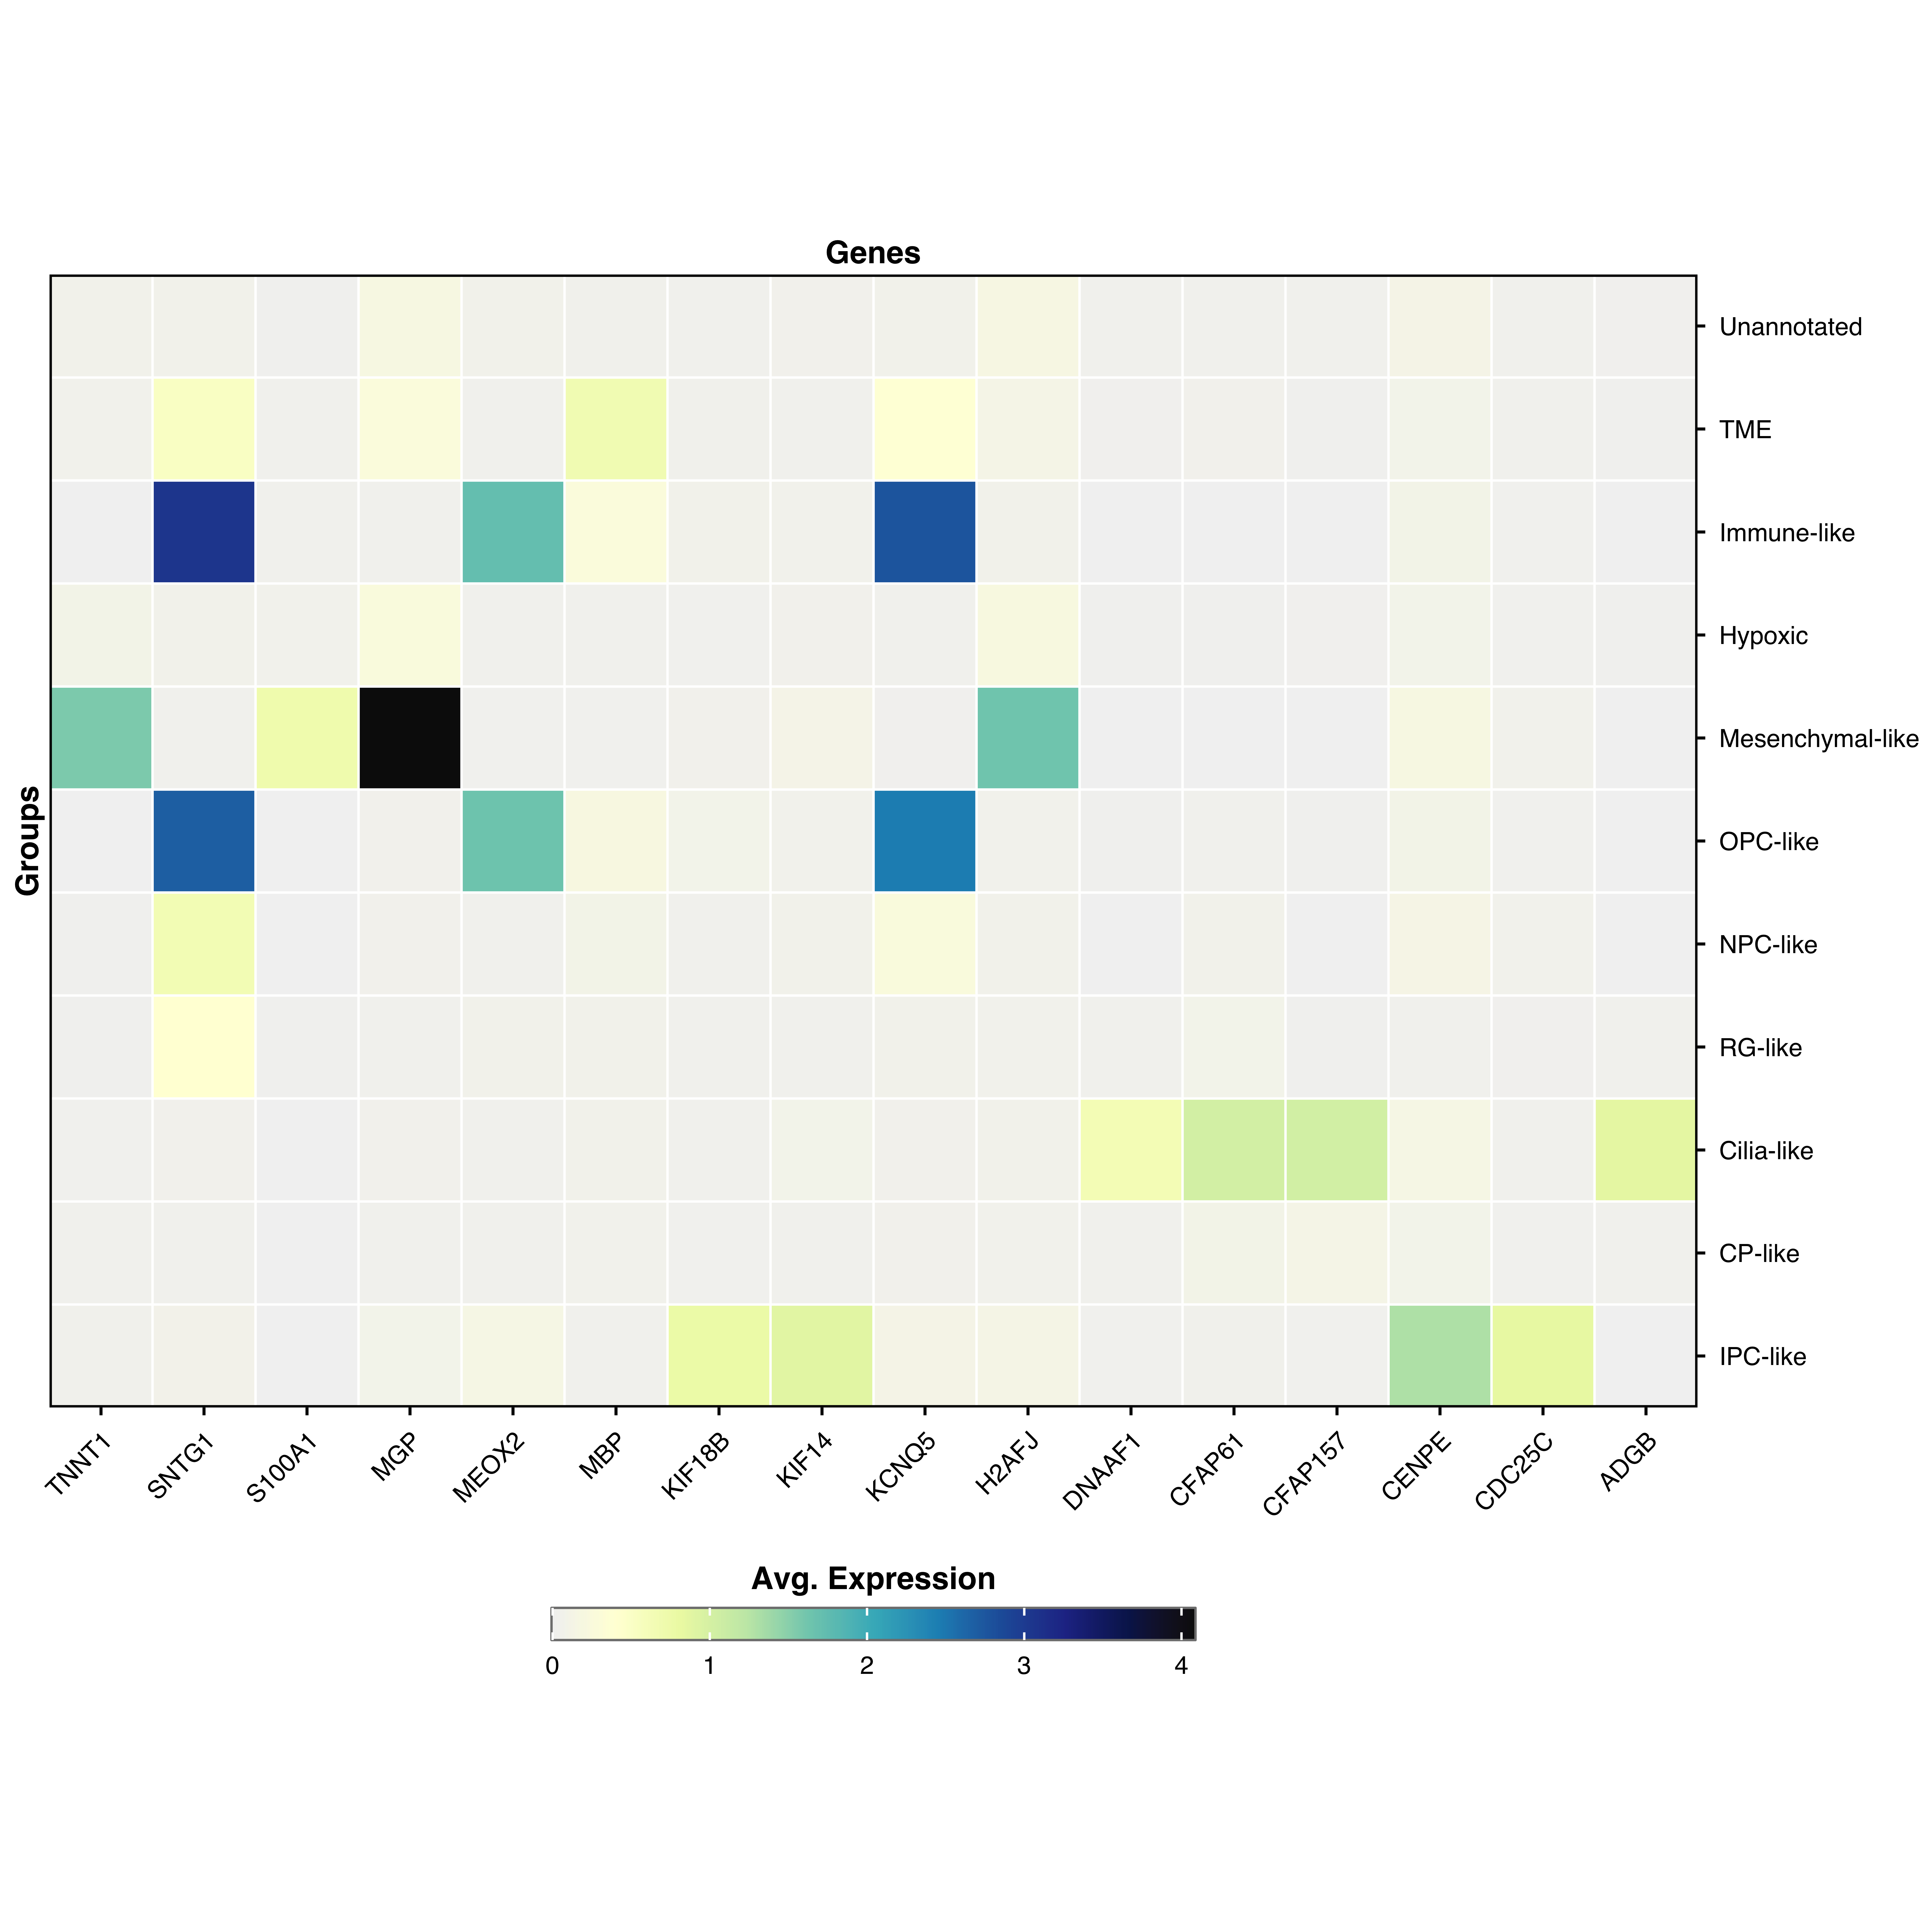
Clustering
Automatic clustering (default)
By default, both genes and groups are hierarchically clustered:
Disable clustering
Preserve the original order:
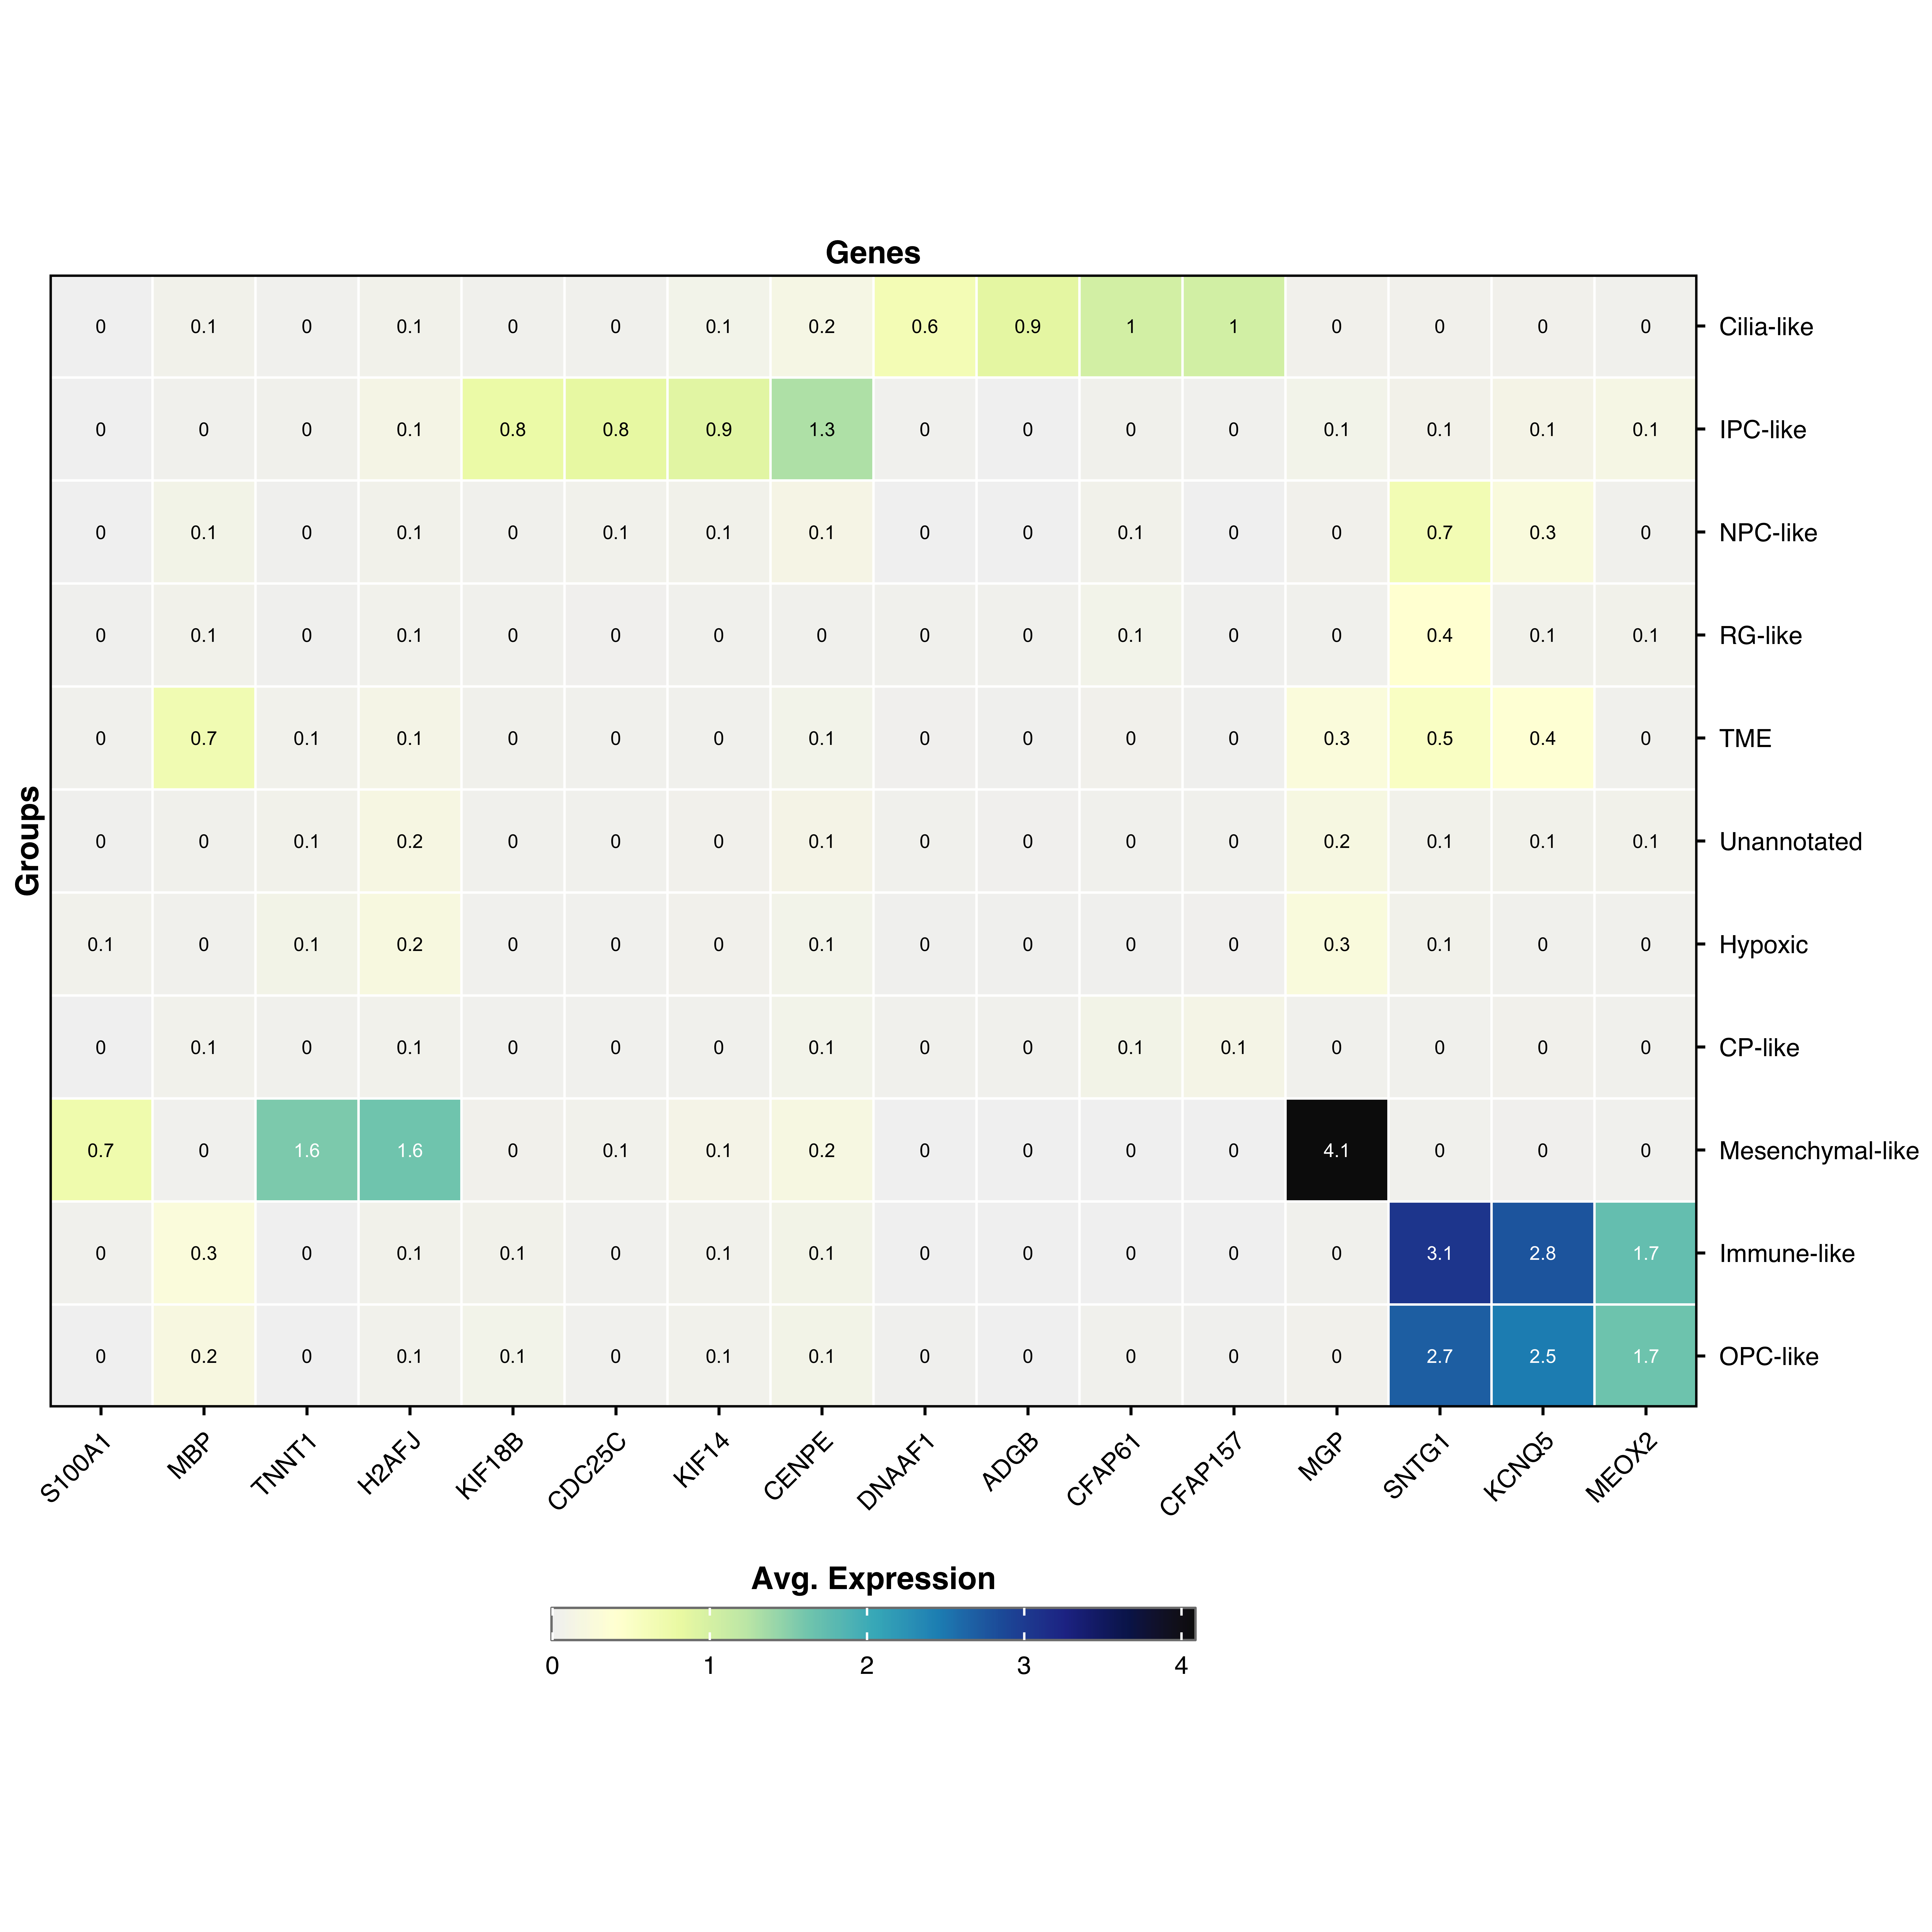
Display values
Show expression values as text overlaid on cells:
p <- SCpubr :: do_ExpressionHeatmap ( sample = sample , features = genes ,
values.show = TRUE ,
values.threshold = 1.5 ,
values.size = 3 ,
values.round = 1 )
p
values.showDisplay numeric values on cells
values.thresholdThreshold for switching text color (white above, black below)
values.sizeText size
values.roundDecimal places to display
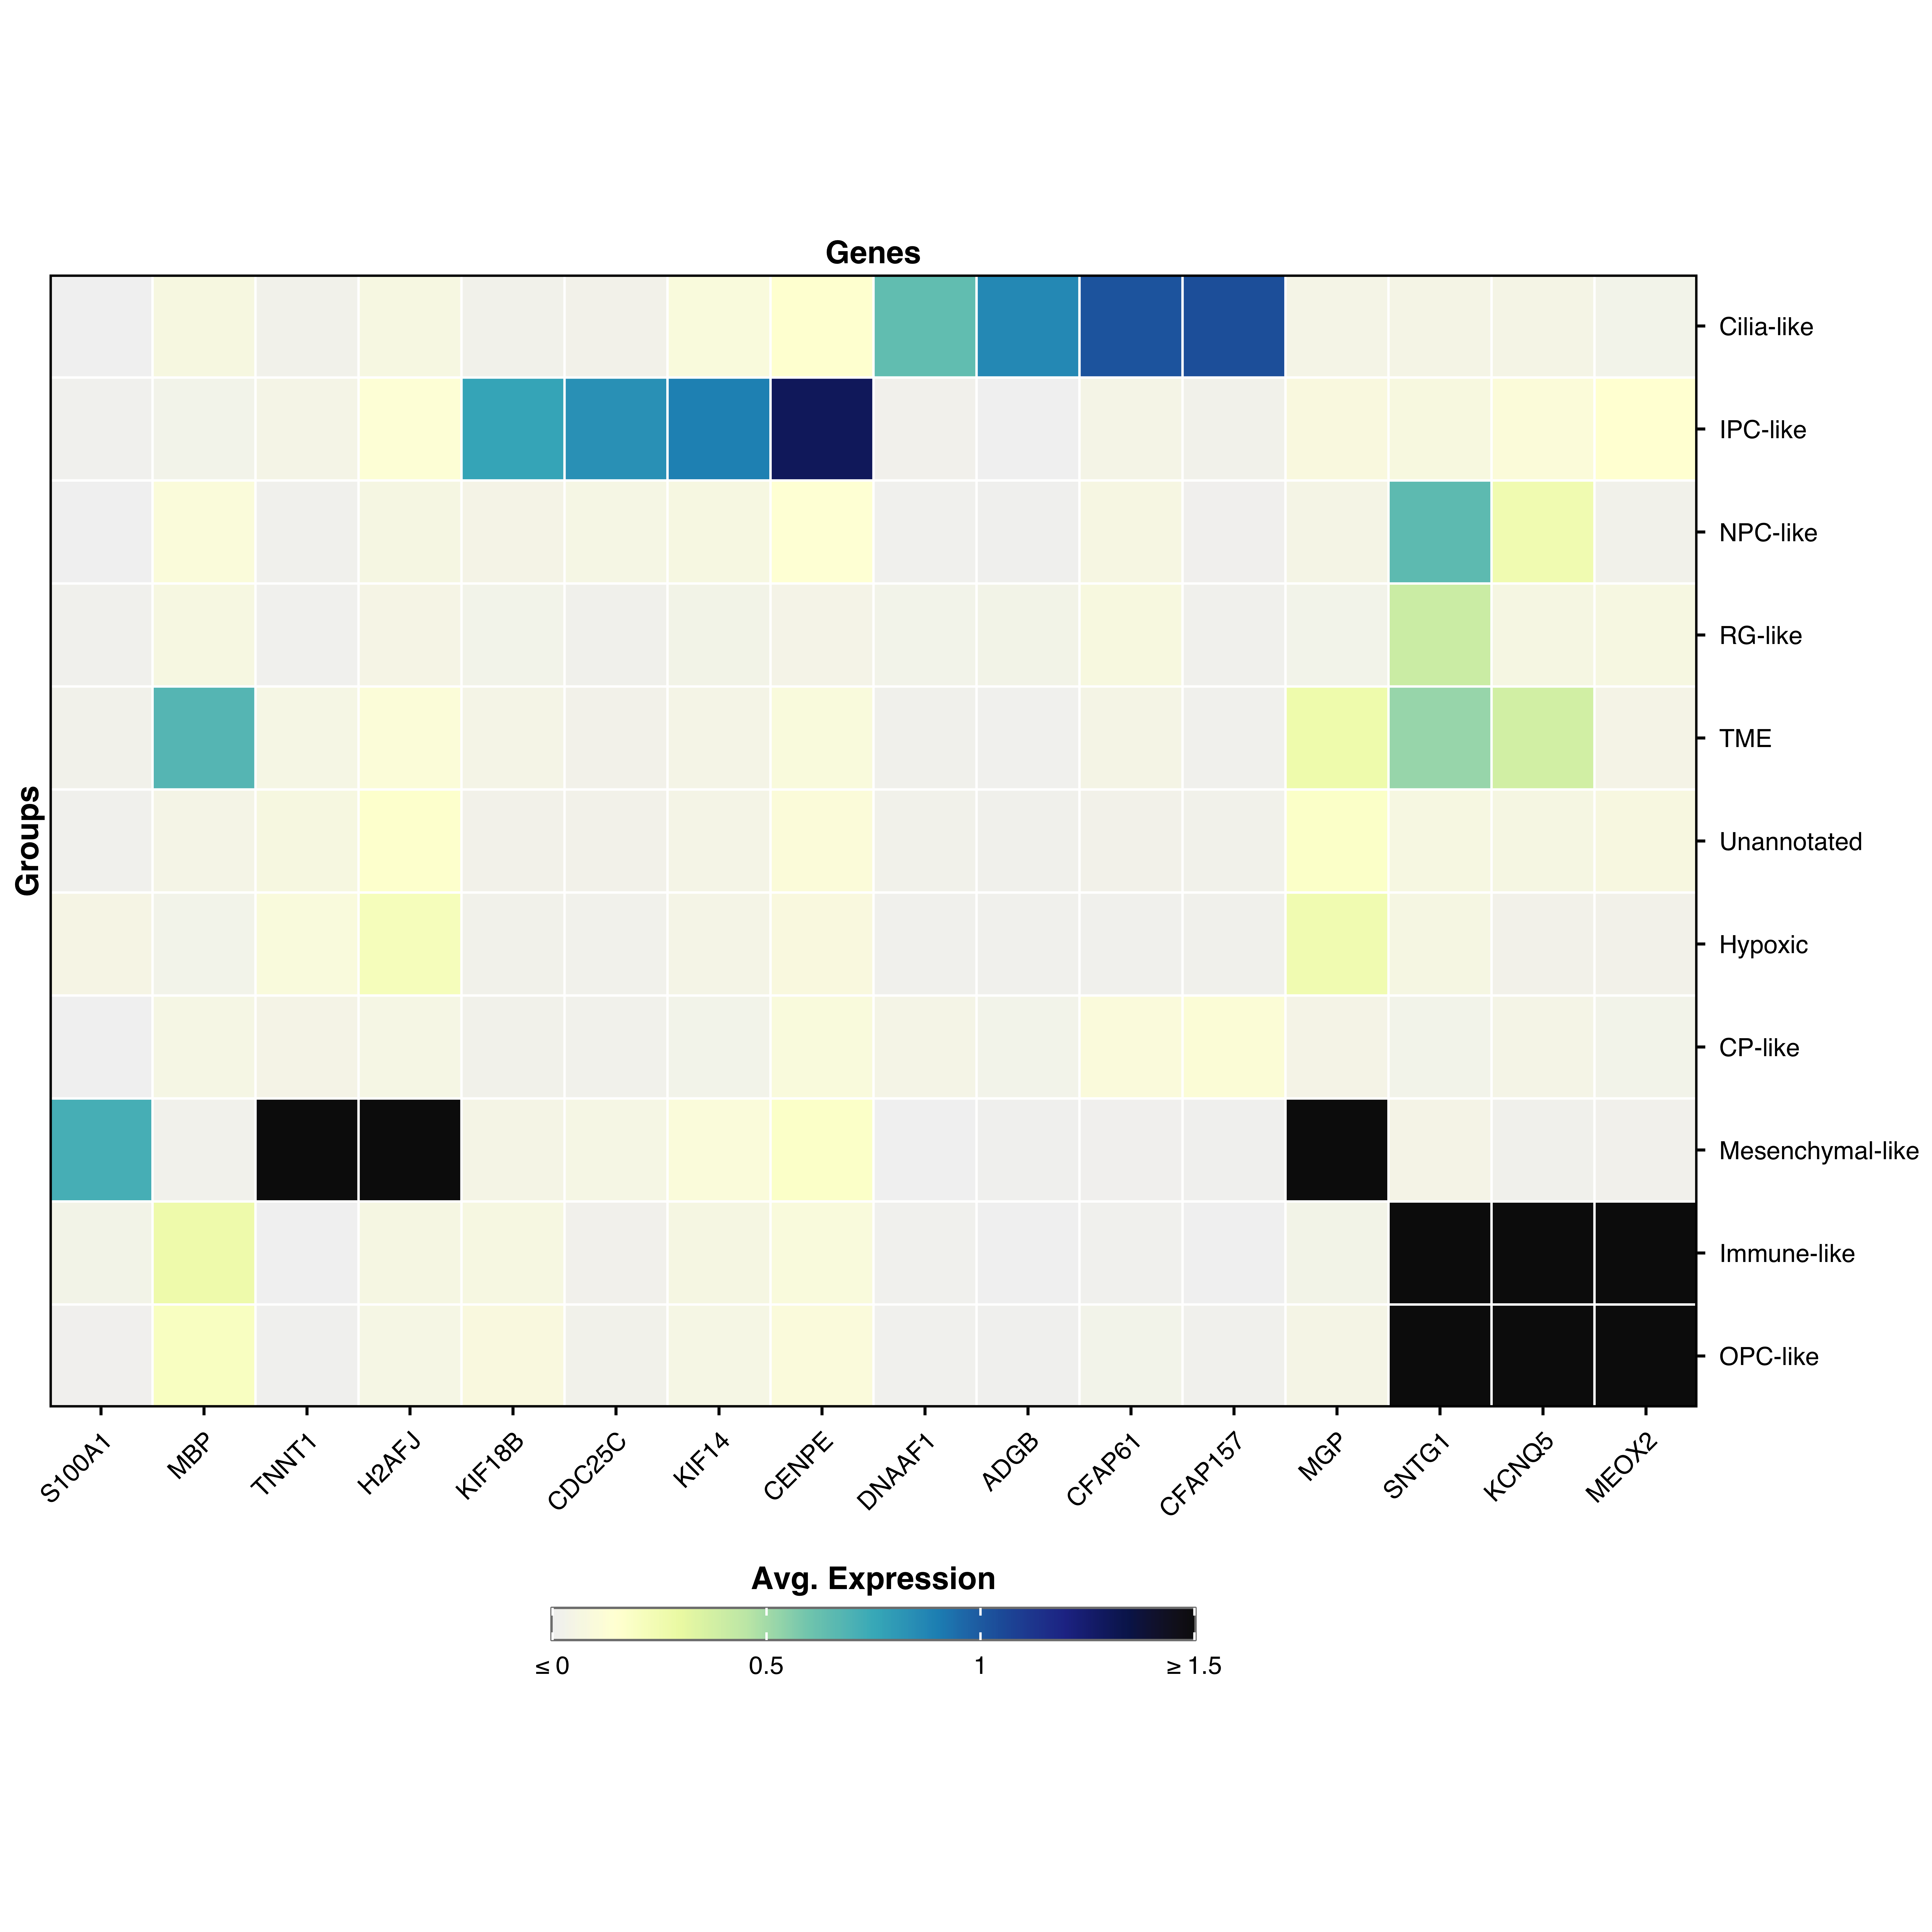
Scale customization
Clamp values
p <- SCpubr :: do_ExpressionHeatmap ( sample = sample , features = genes ,
min.cutoff = 0 ,
max.cutoff = 1.5 )
p
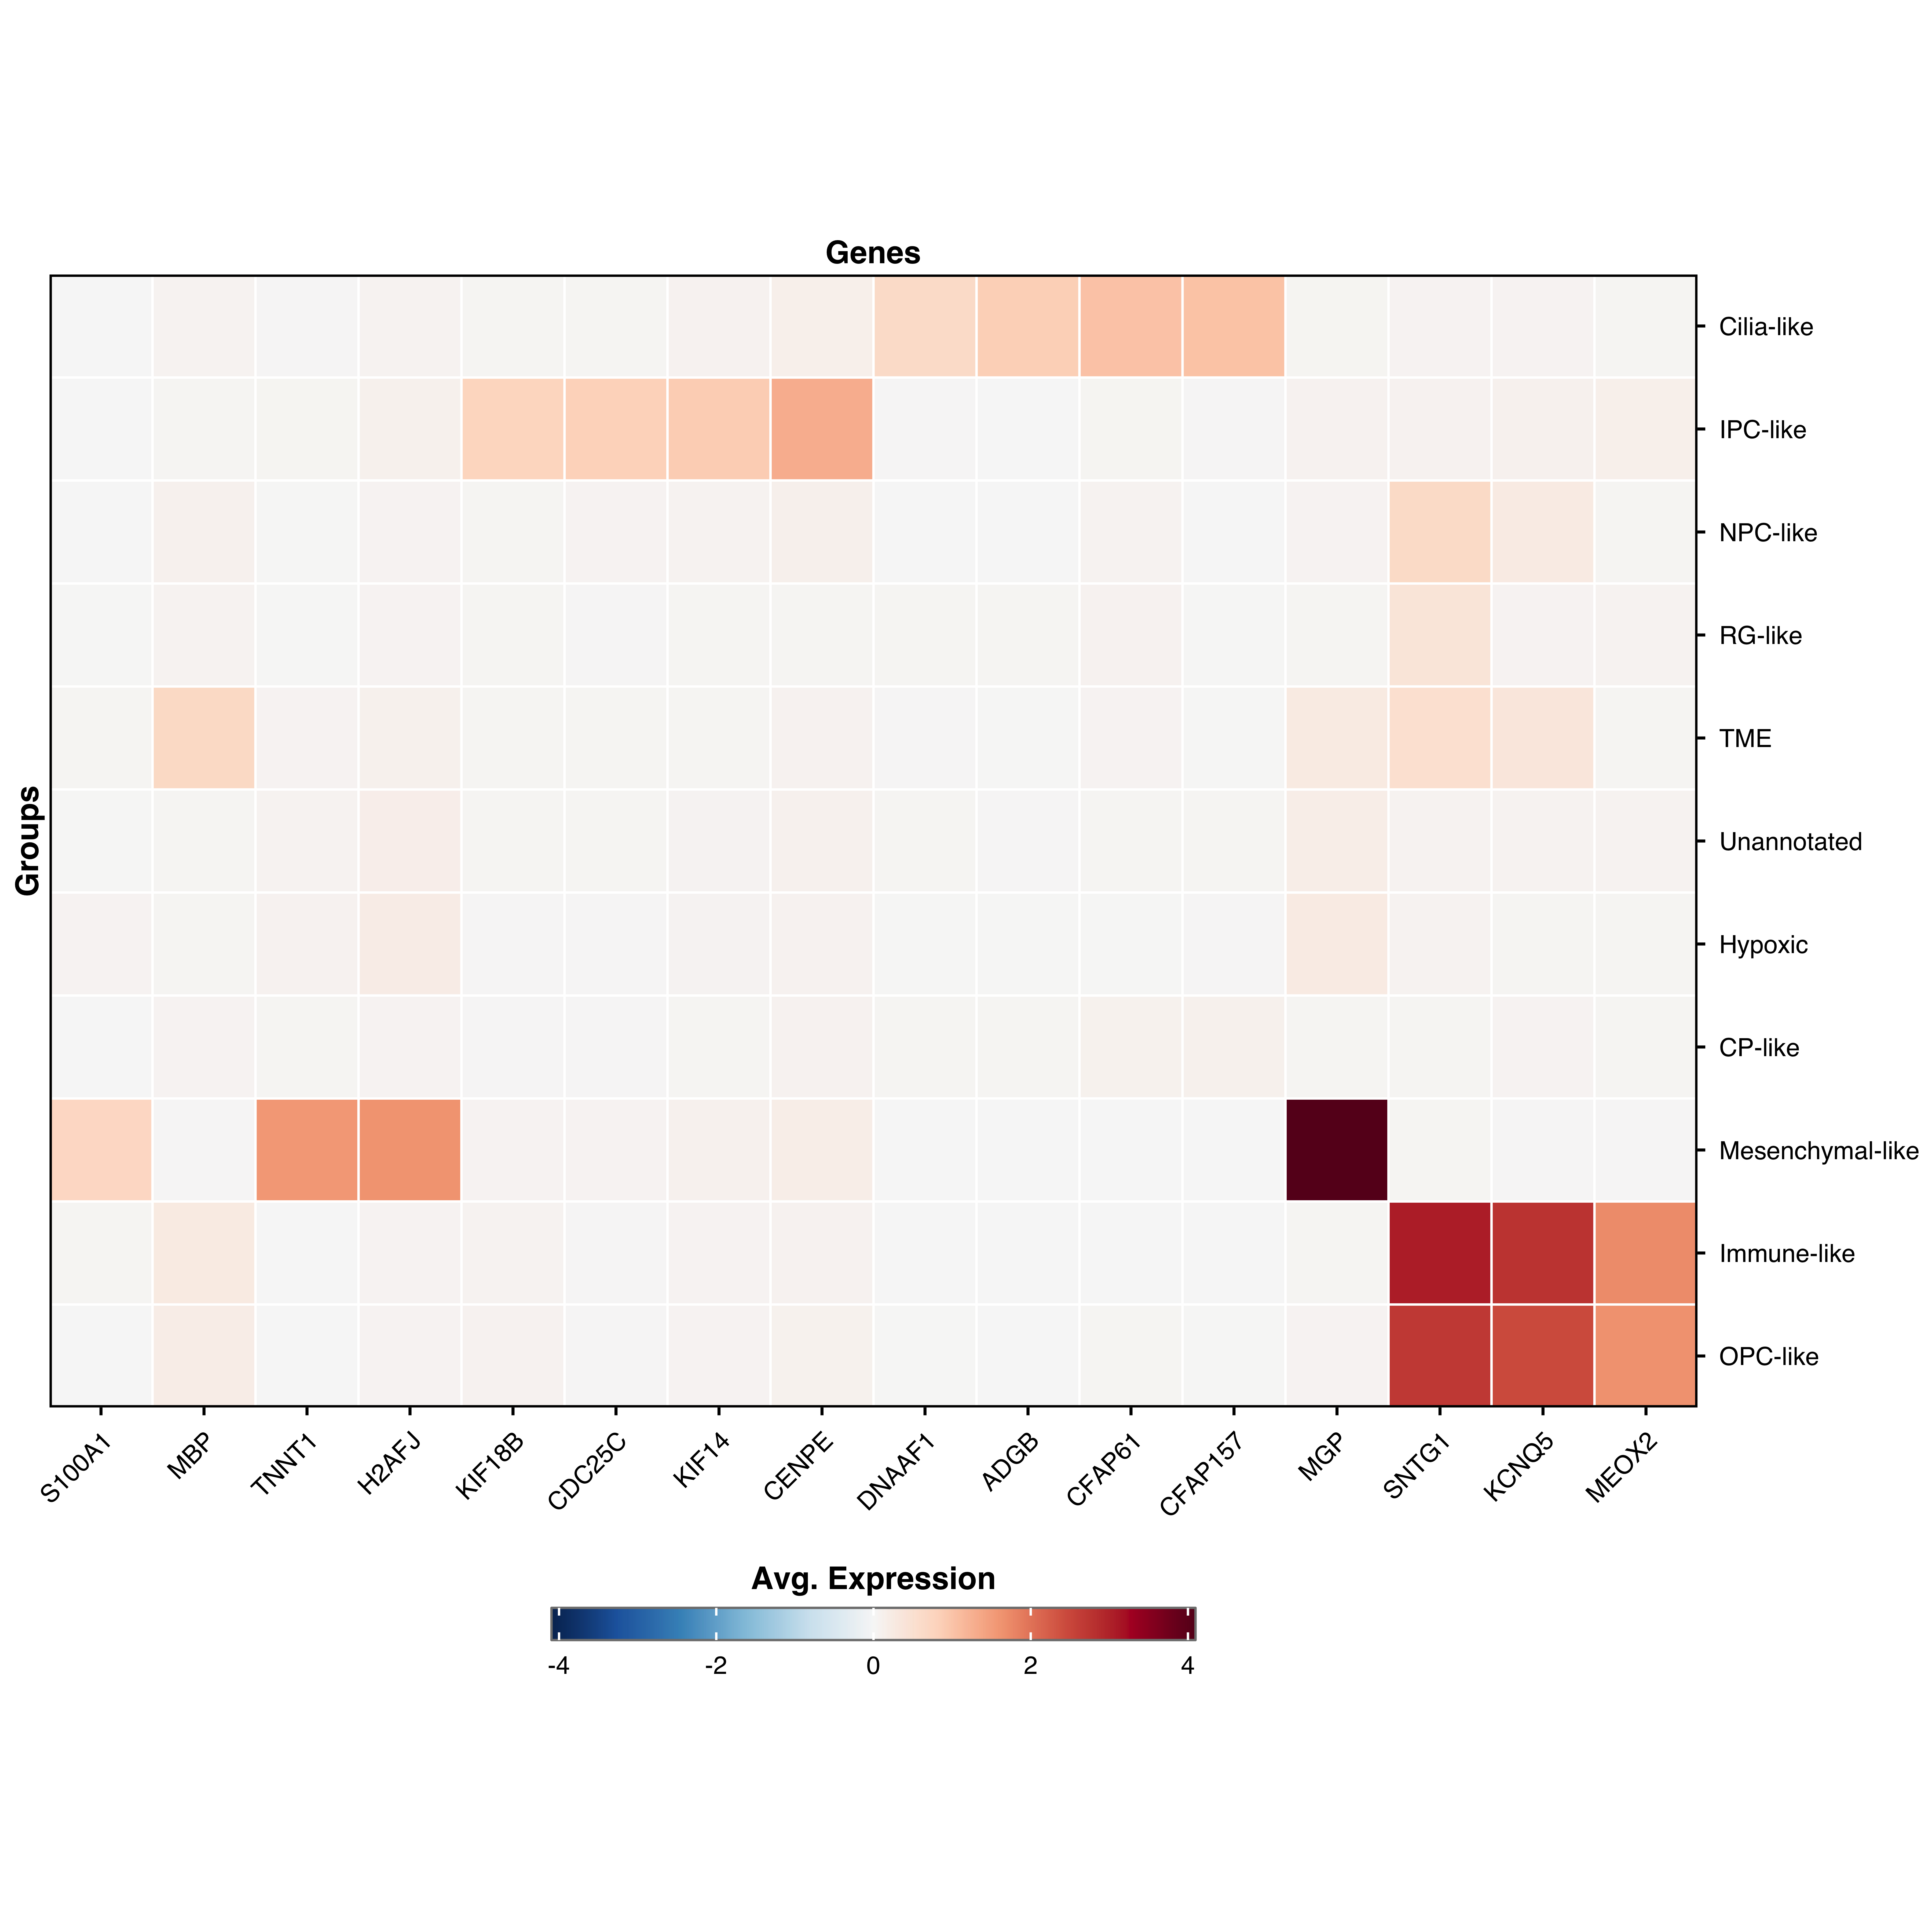
Symmetrical (diverging) scale
Center the color scale around zero:
p <- SCpubr :: do_ExpressionHeatmap ( sample = sample , features = genes ,
enforce_symmetry = TRUE ,
diverging.palette = "RdBu" )
p
Visual customization
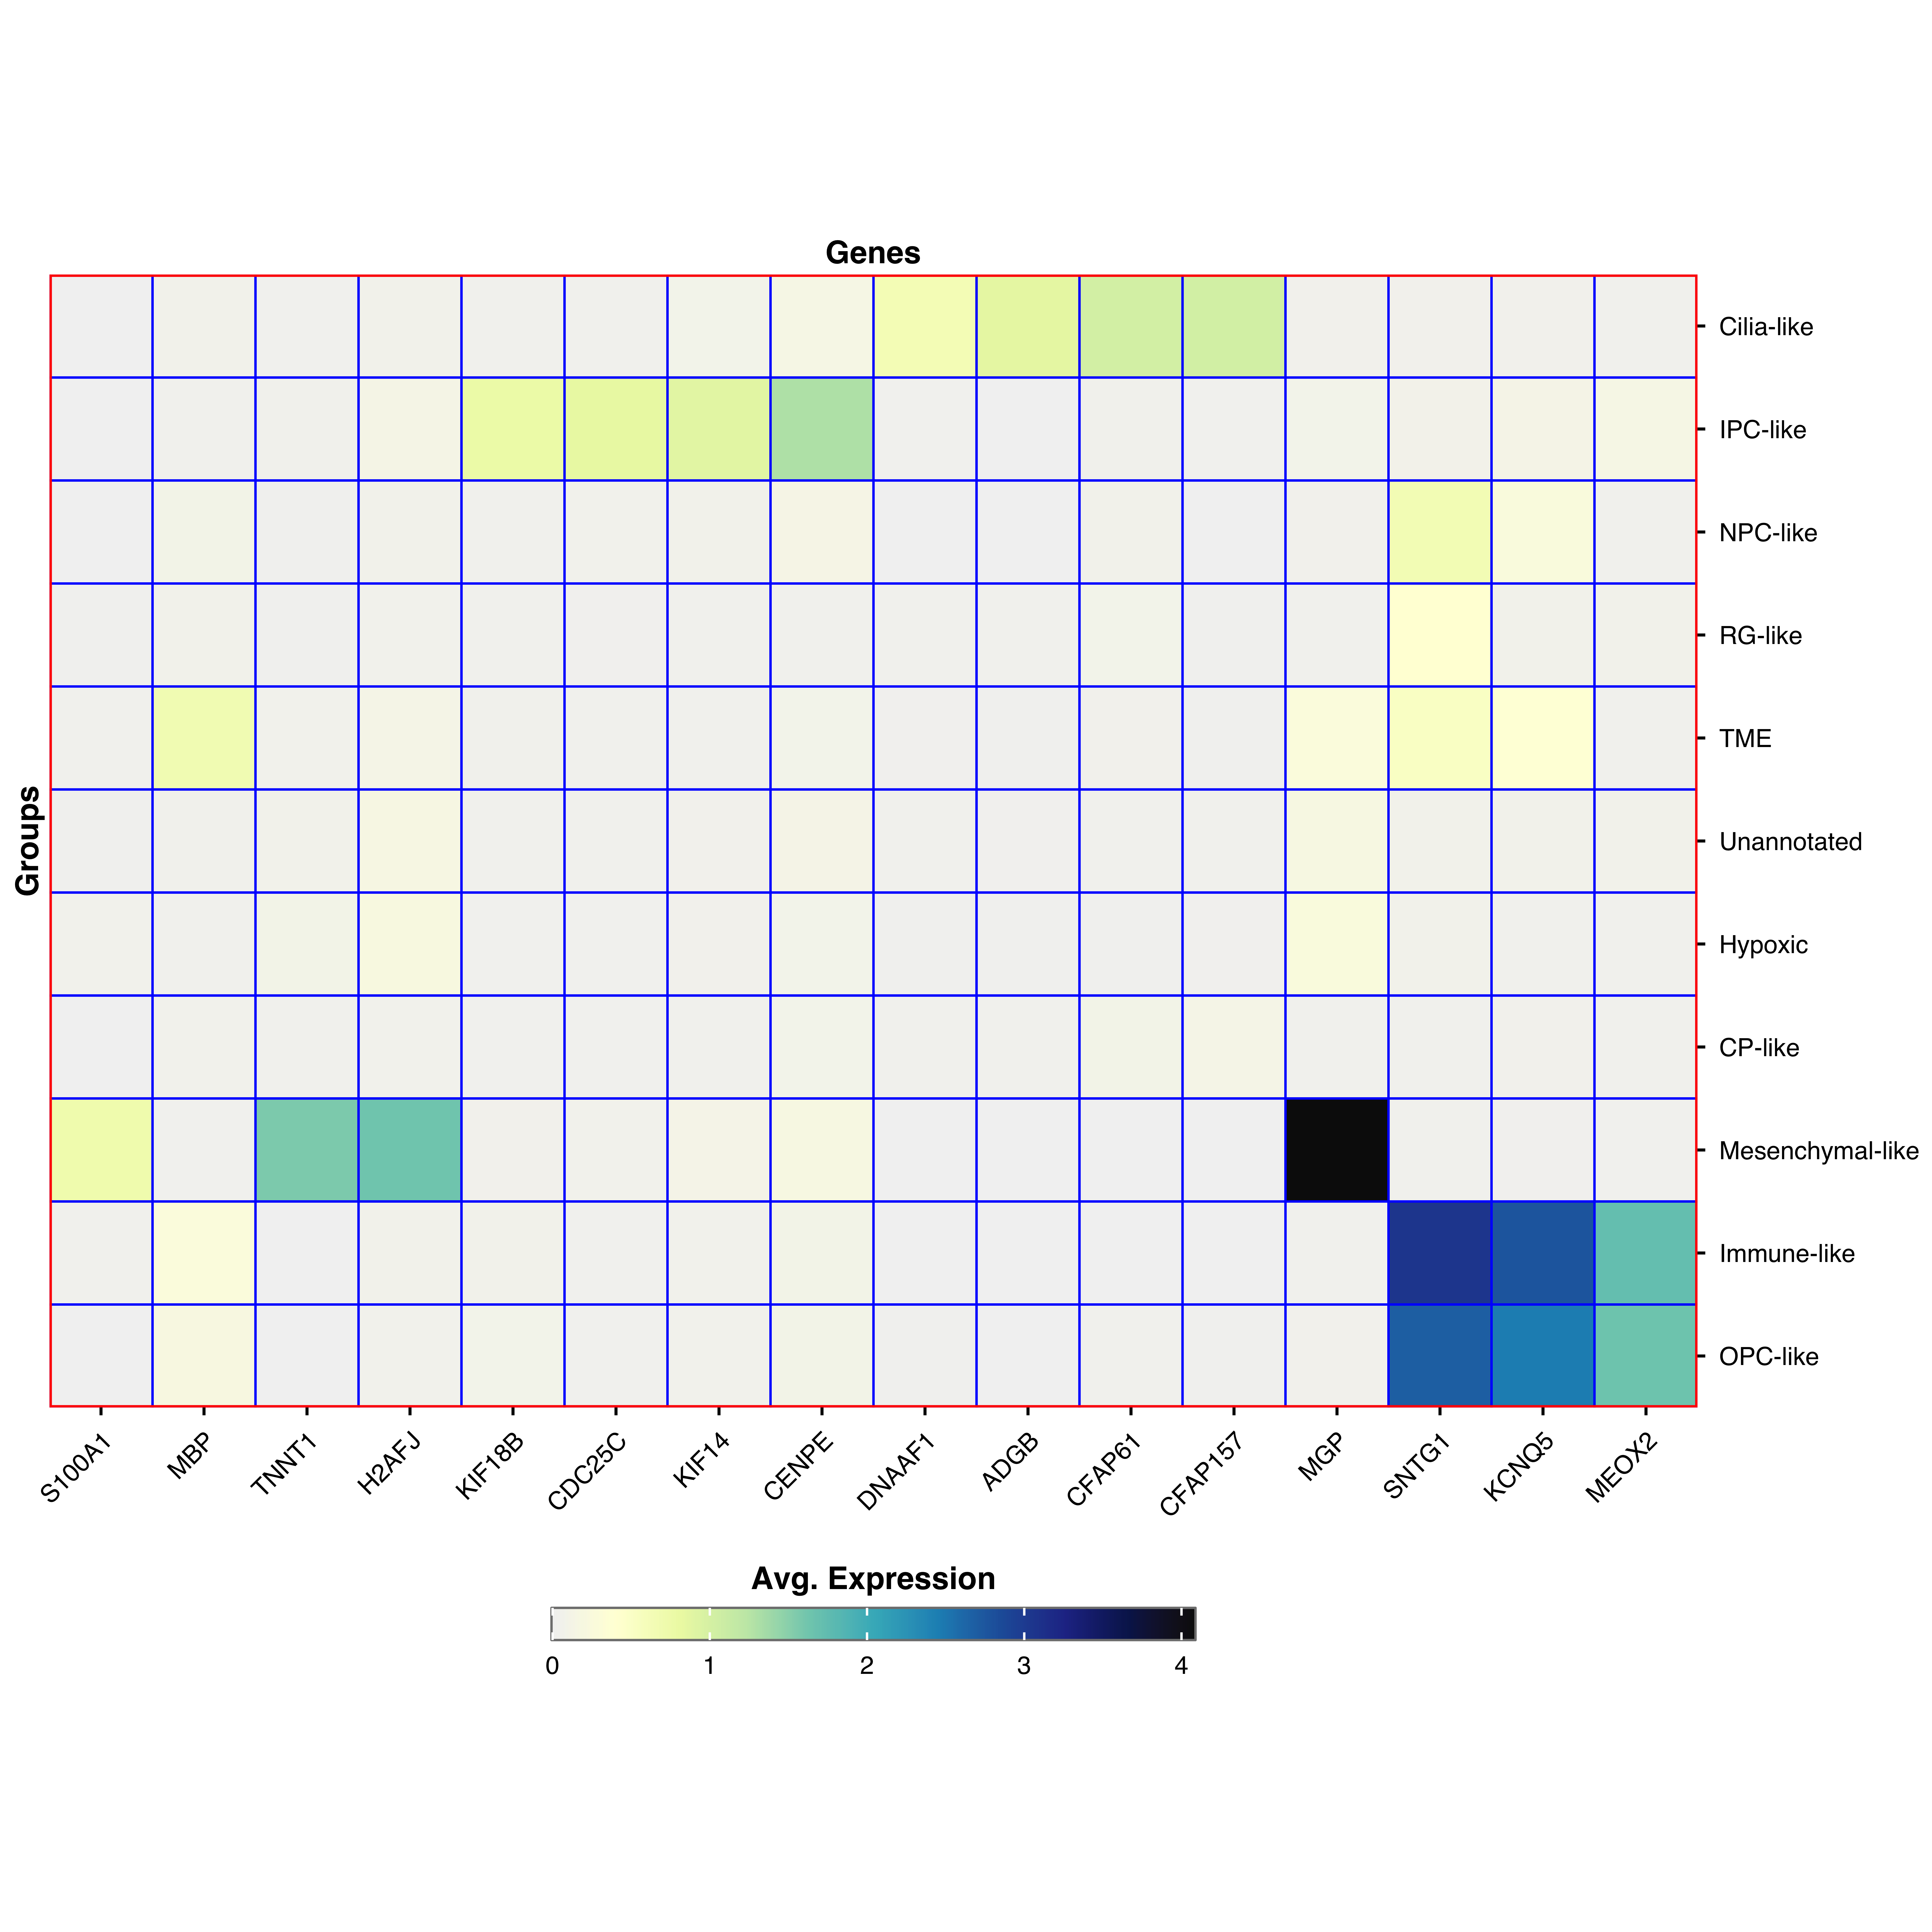
Customize grid and border colors
p <- SCpubr :: do_ExpressionHeatmap ( sample = sample , features = genes ,
grid.color = "blue" ,
border.color = "red" )
p
Parameter reference
For parameters shared across many functions (color palettes, typography, legend styling), see Shared features .
Core parameters
featuresGenes to display
—
Clustering & ordering
clusterHierarchically cluster genes and groups
TRUE
features.orderCustom gene order
NULL
groups.orderCustom group order (named list)
NULL
Value display
values.showShow values on cells
FALSE
values.thresholdColor switch threshold
NULL
values.sizeValue text size
3
values.roundDecimal places
1
Appearance
grid.colorColor between cells
"white"
border.colorHeatmap border color
"black"
axis.text.x.angleX-axis label rotation
45