de_genes <- Seurat::FindMarkers(sample, ident.1 = "IPC-like", ident.2 = "Cilia-like")

p <- SCpubr::do_VolcanoPlot(sample = sample,
                            de_genes = de_genes)
p
Volcano plots display differential expression results showing both fold change (X-axis) and statistical significance (Y-axis). Points are colored by significance category with optional gene labels.
First run differential expression:
de_genes <- Seurat::FindMarkers(sample, ident.1 = "IPC-like", ident.2 = "Cilia-like")
p <- SCpubr::do_VolcanoPlot(sample = sample,
de_genes = de_genes)
p
p <- SCpubr::do_VolcanoPlot(sample = sample,
                            de_genes = de_genes,
                            pval_cutoff = 0.01,
                            FC_cutoff = 1.5)
p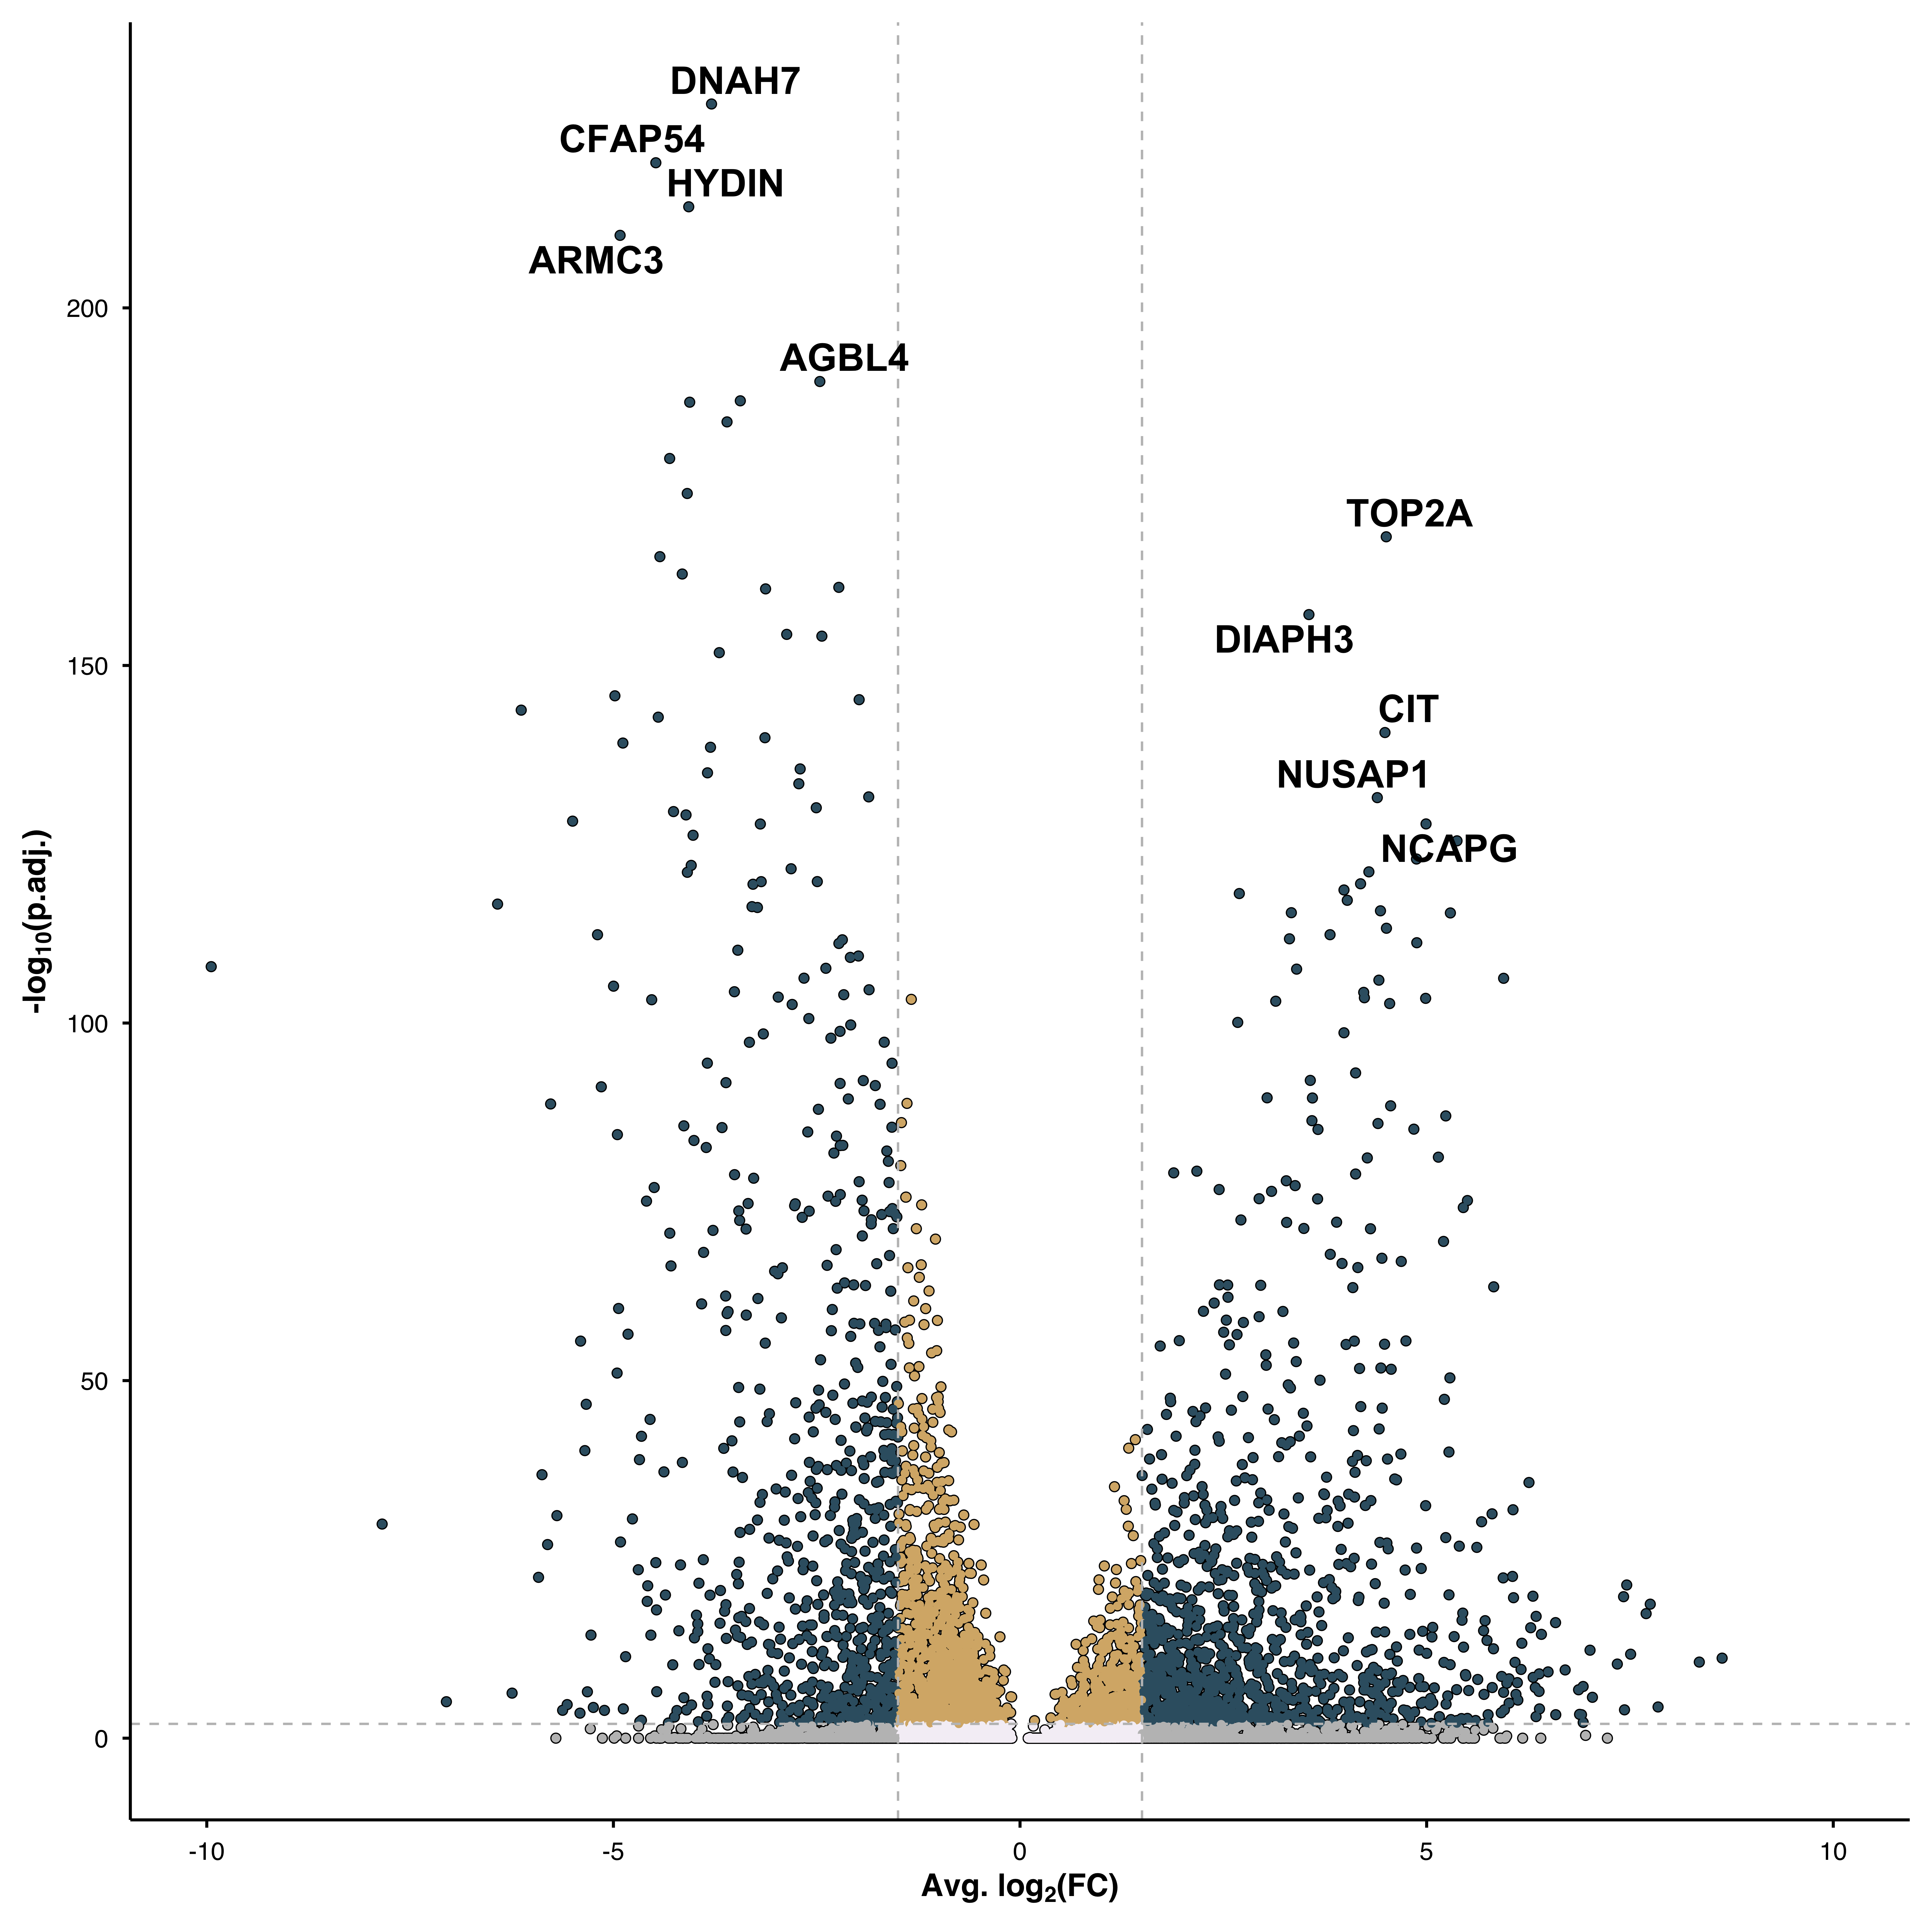
# Show more genes
p <- SCpubr::do_VolcanoPlot(sample = sample,
                            de_genes = de_genes,
                            n_genes = 10)
p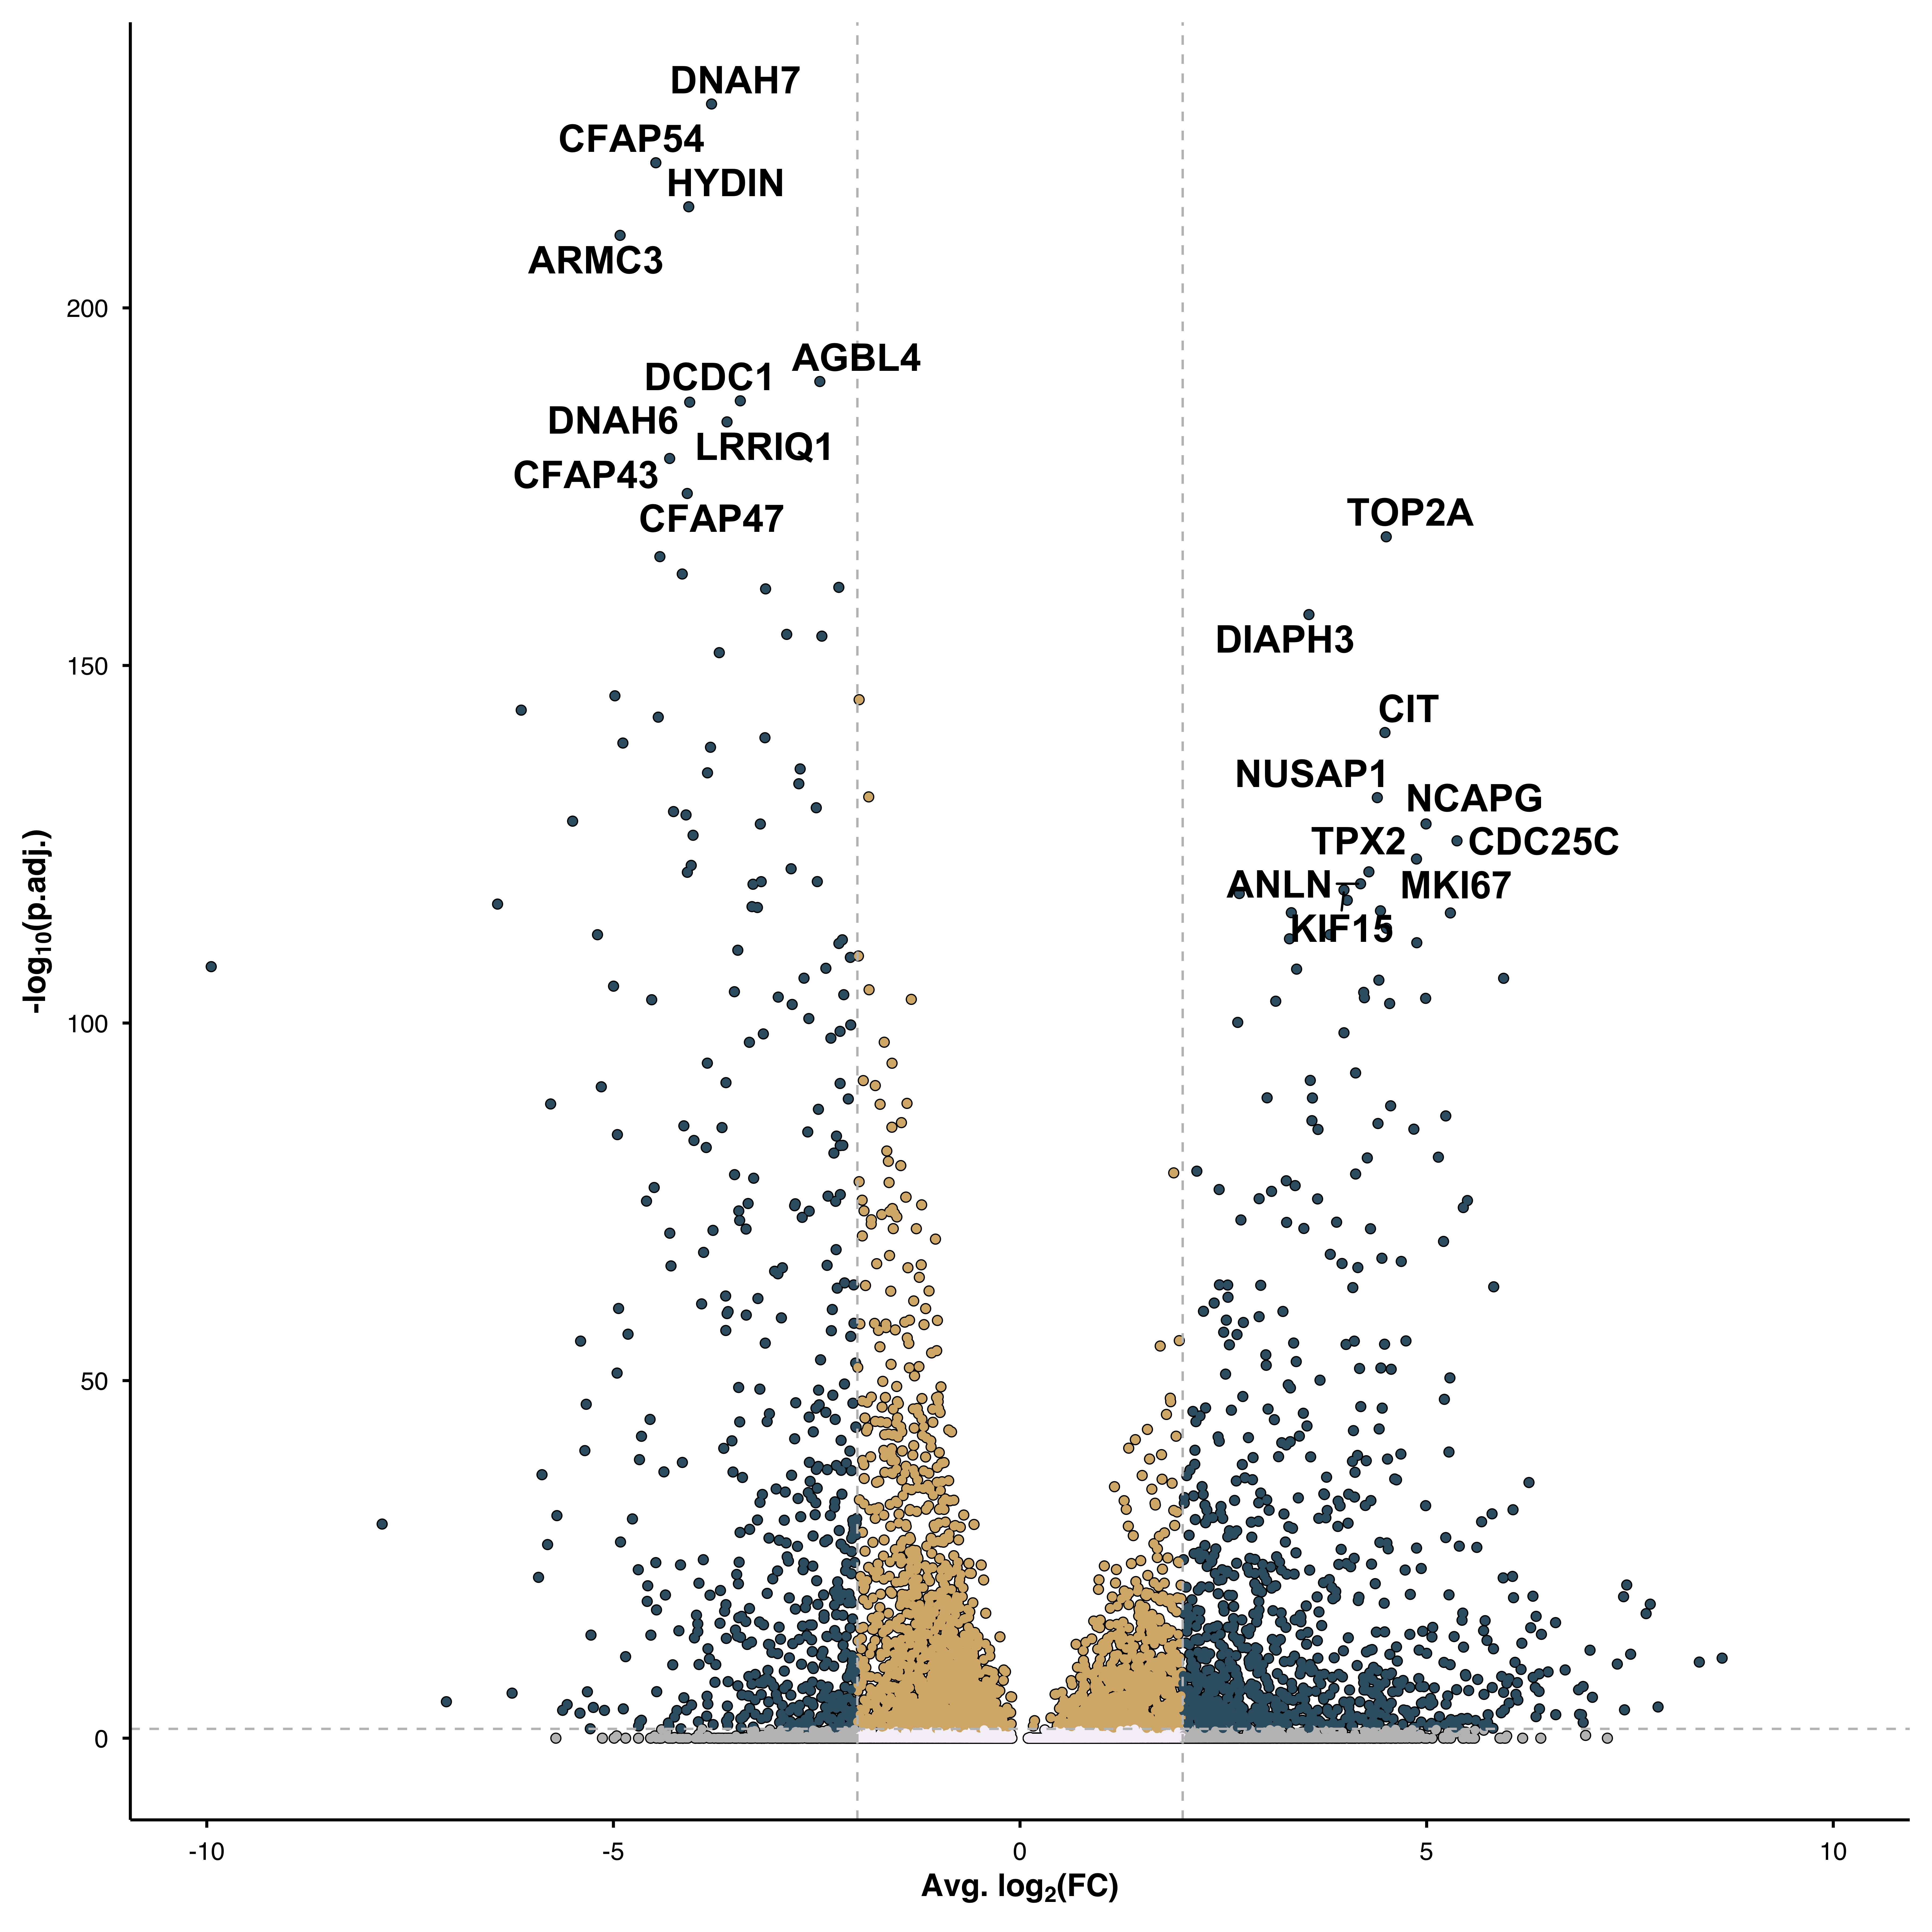
p <- SCpubr::do_VolcanoPlot(sample = sample,
                            de_genes = de_genes,
                            add_gene_tags = FALSE)
p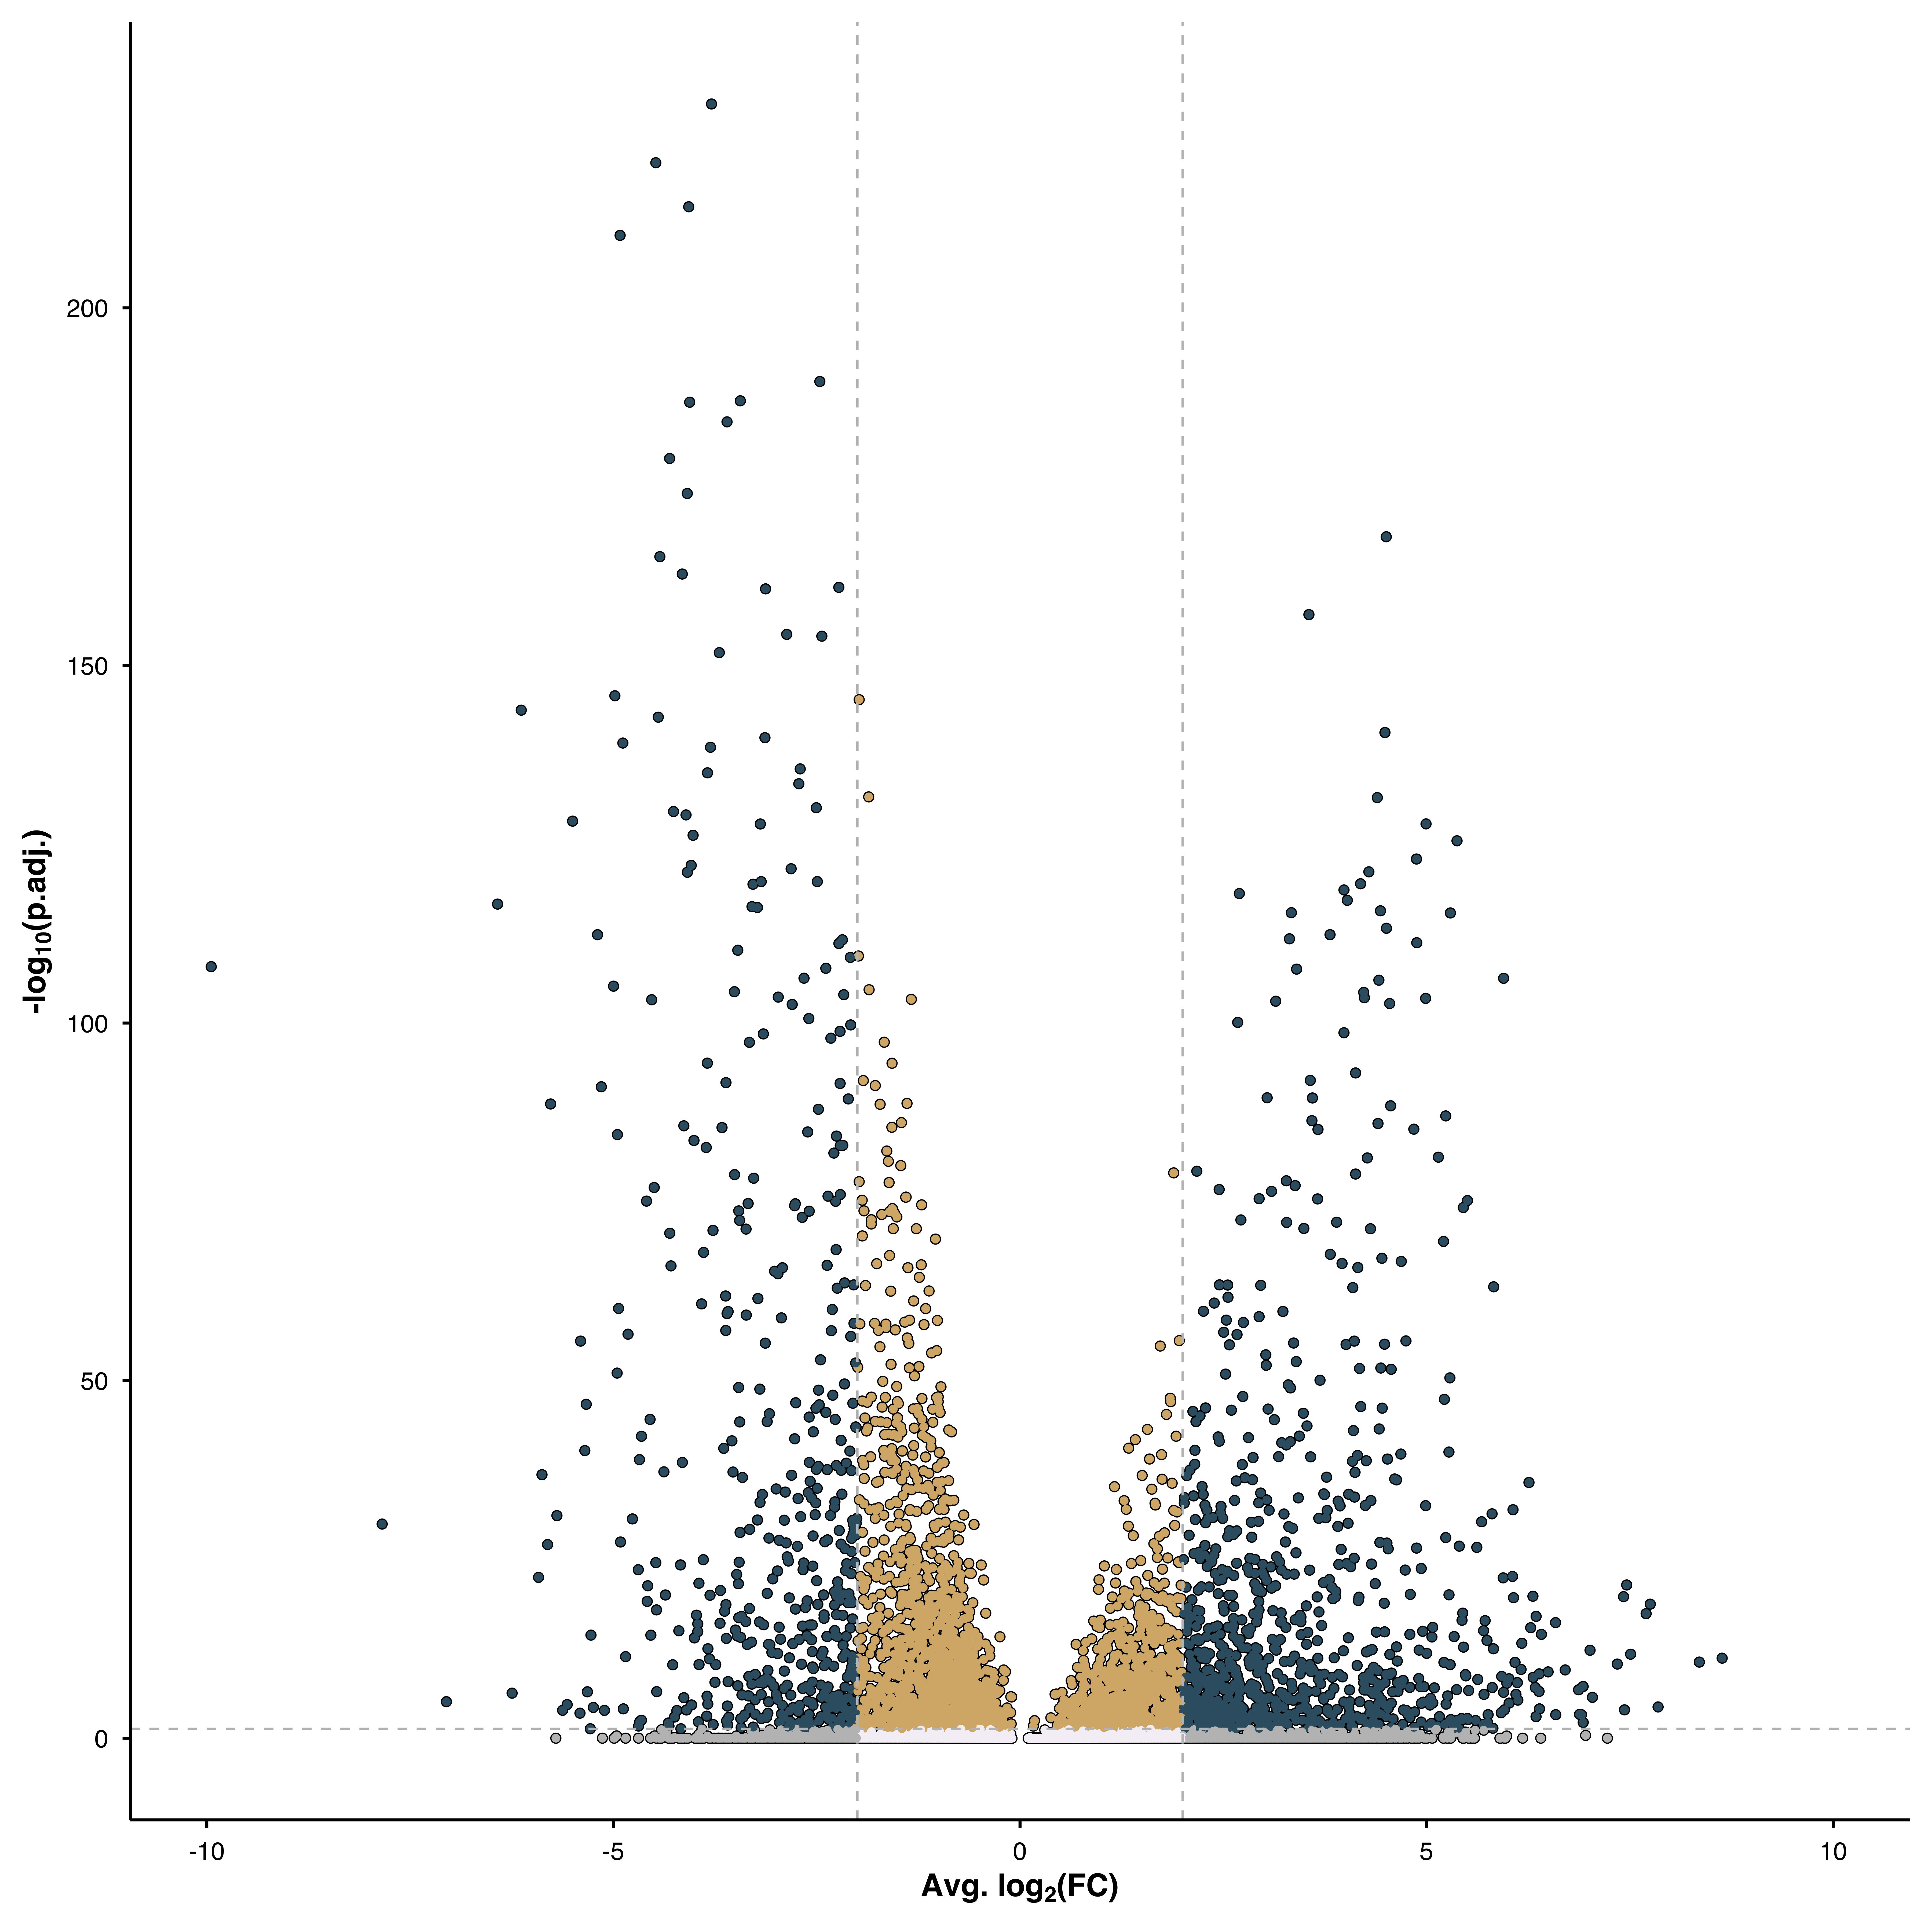
# By p-value
p <- SCpubr::do_VolcanoPlot(sample = sample,
                            de_genes = de_genes,
                            order_tags_by = "pvalue")
p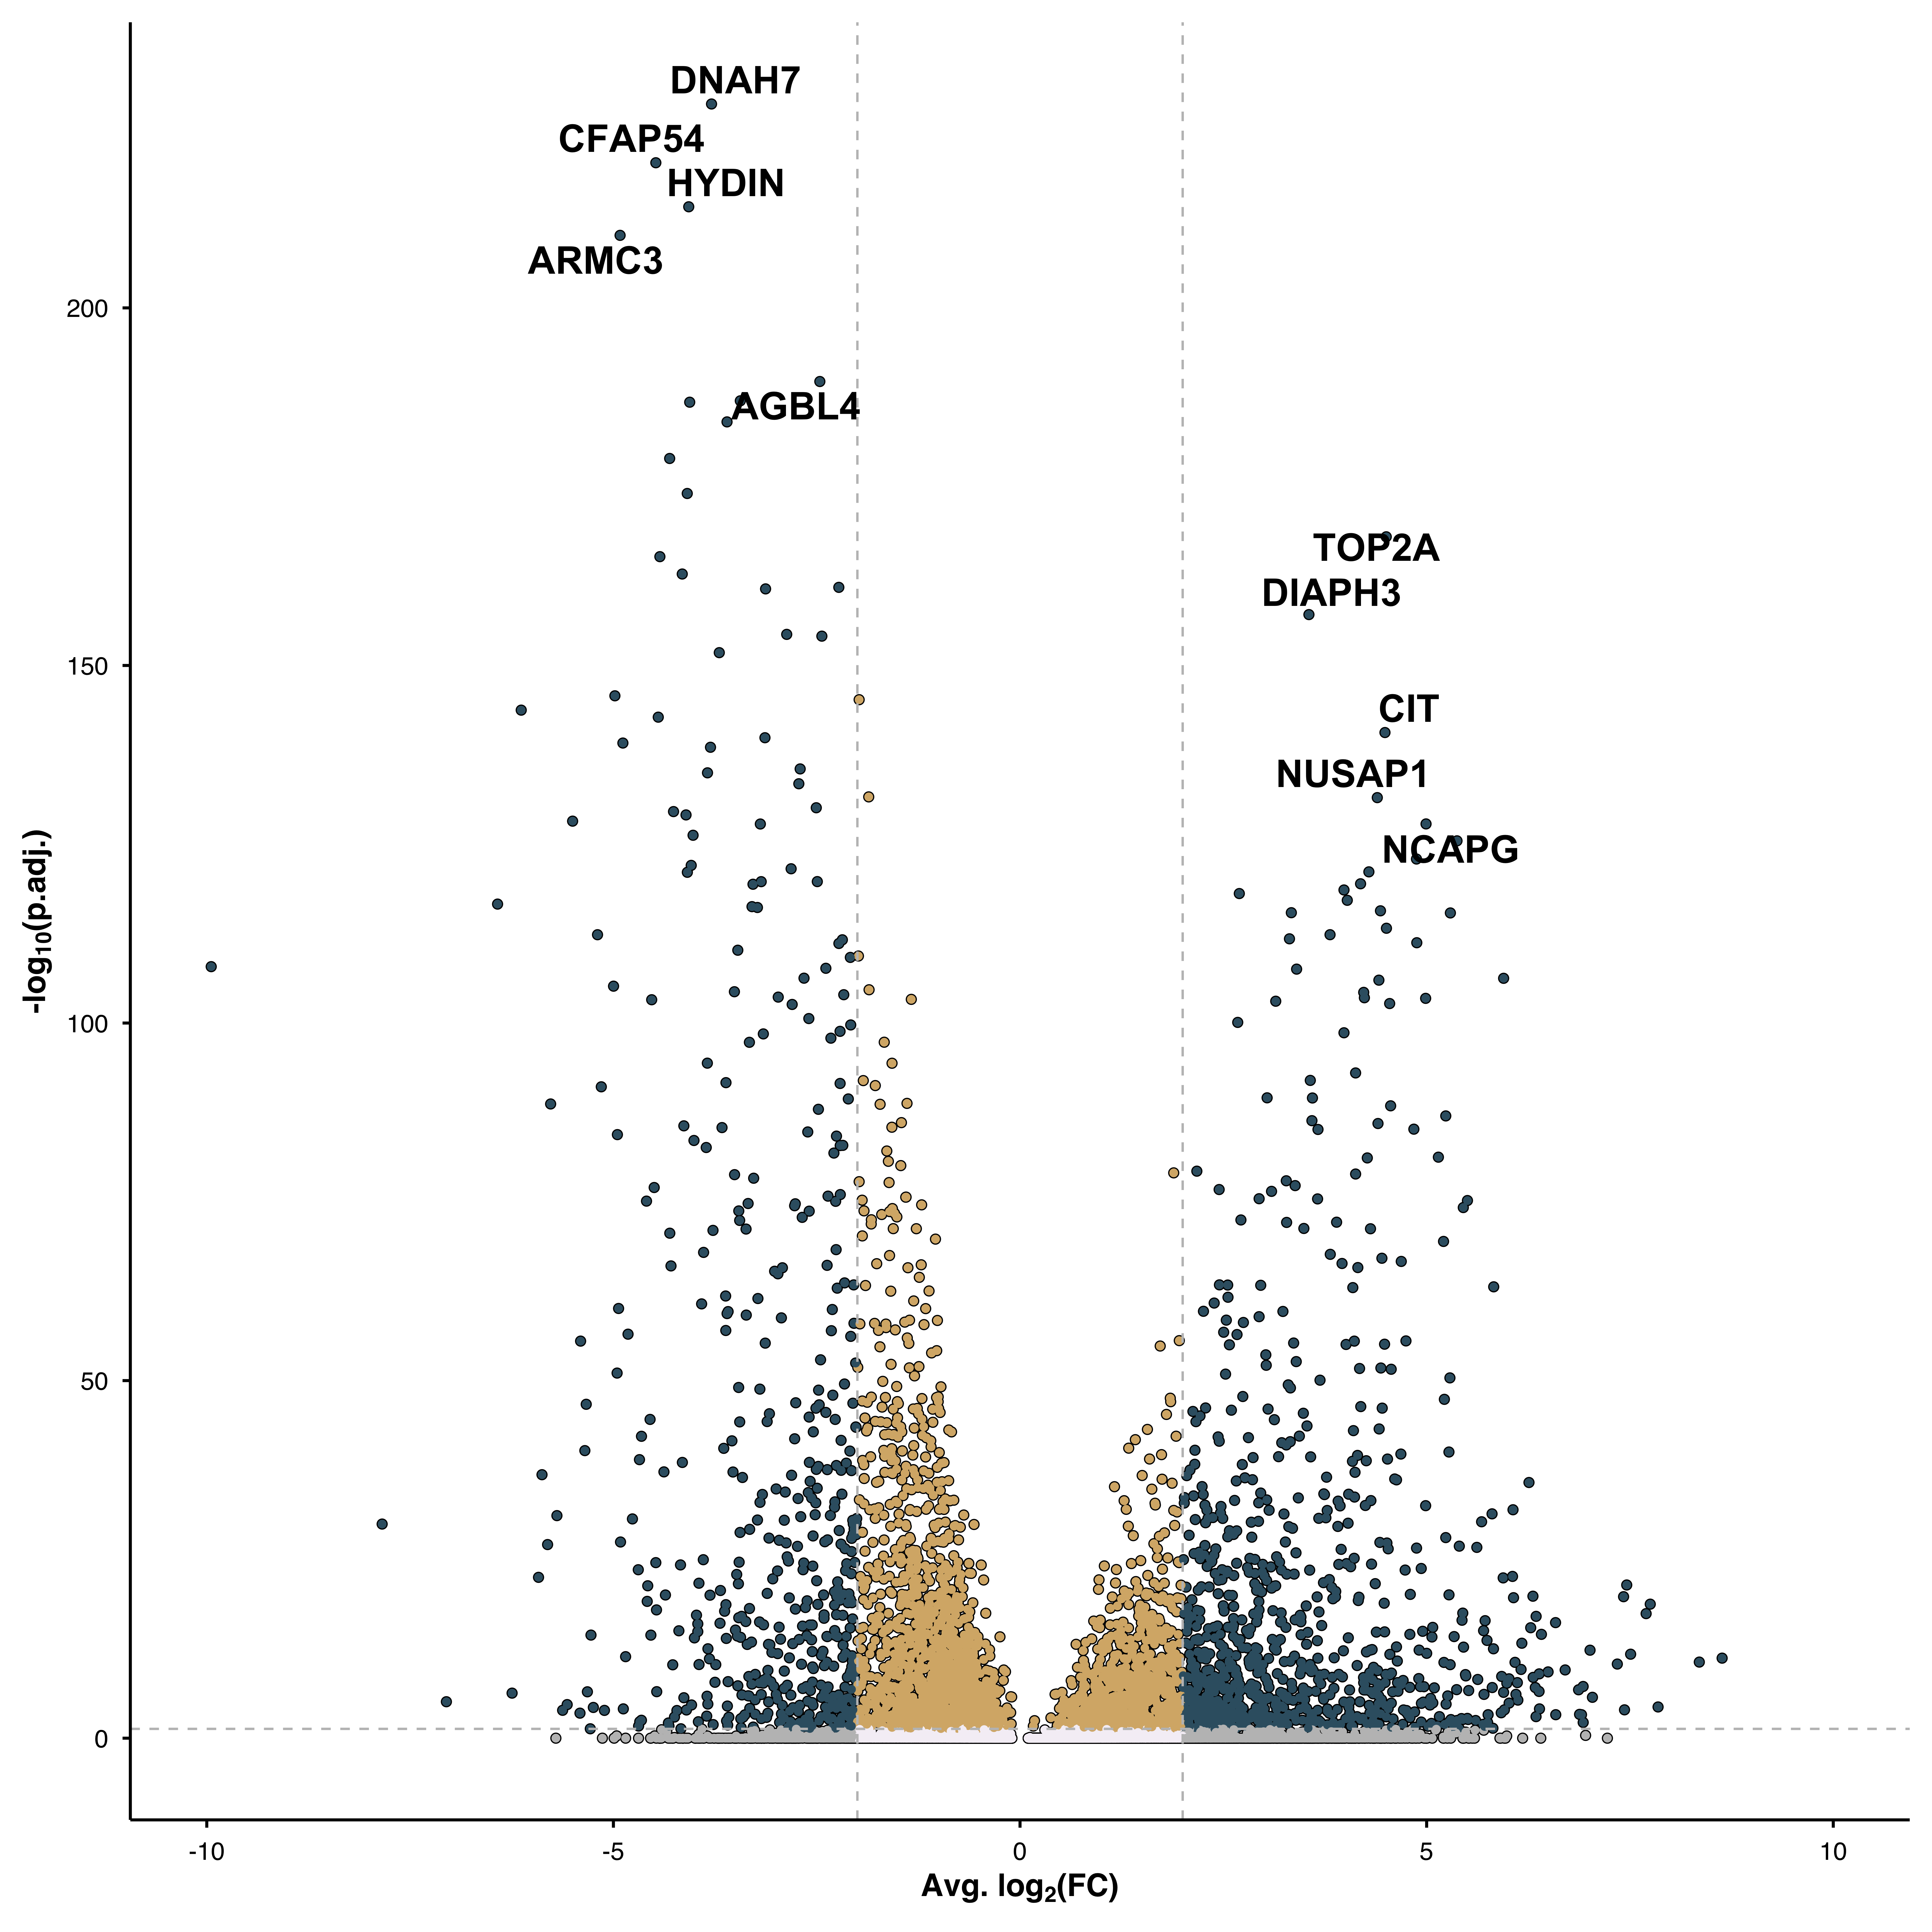
# By log fold change
p <- SCpubr::do_VolcanoPlot(sample = sample,
                            de_genes = de_genes,
                            order_tags_by = "logfc")
p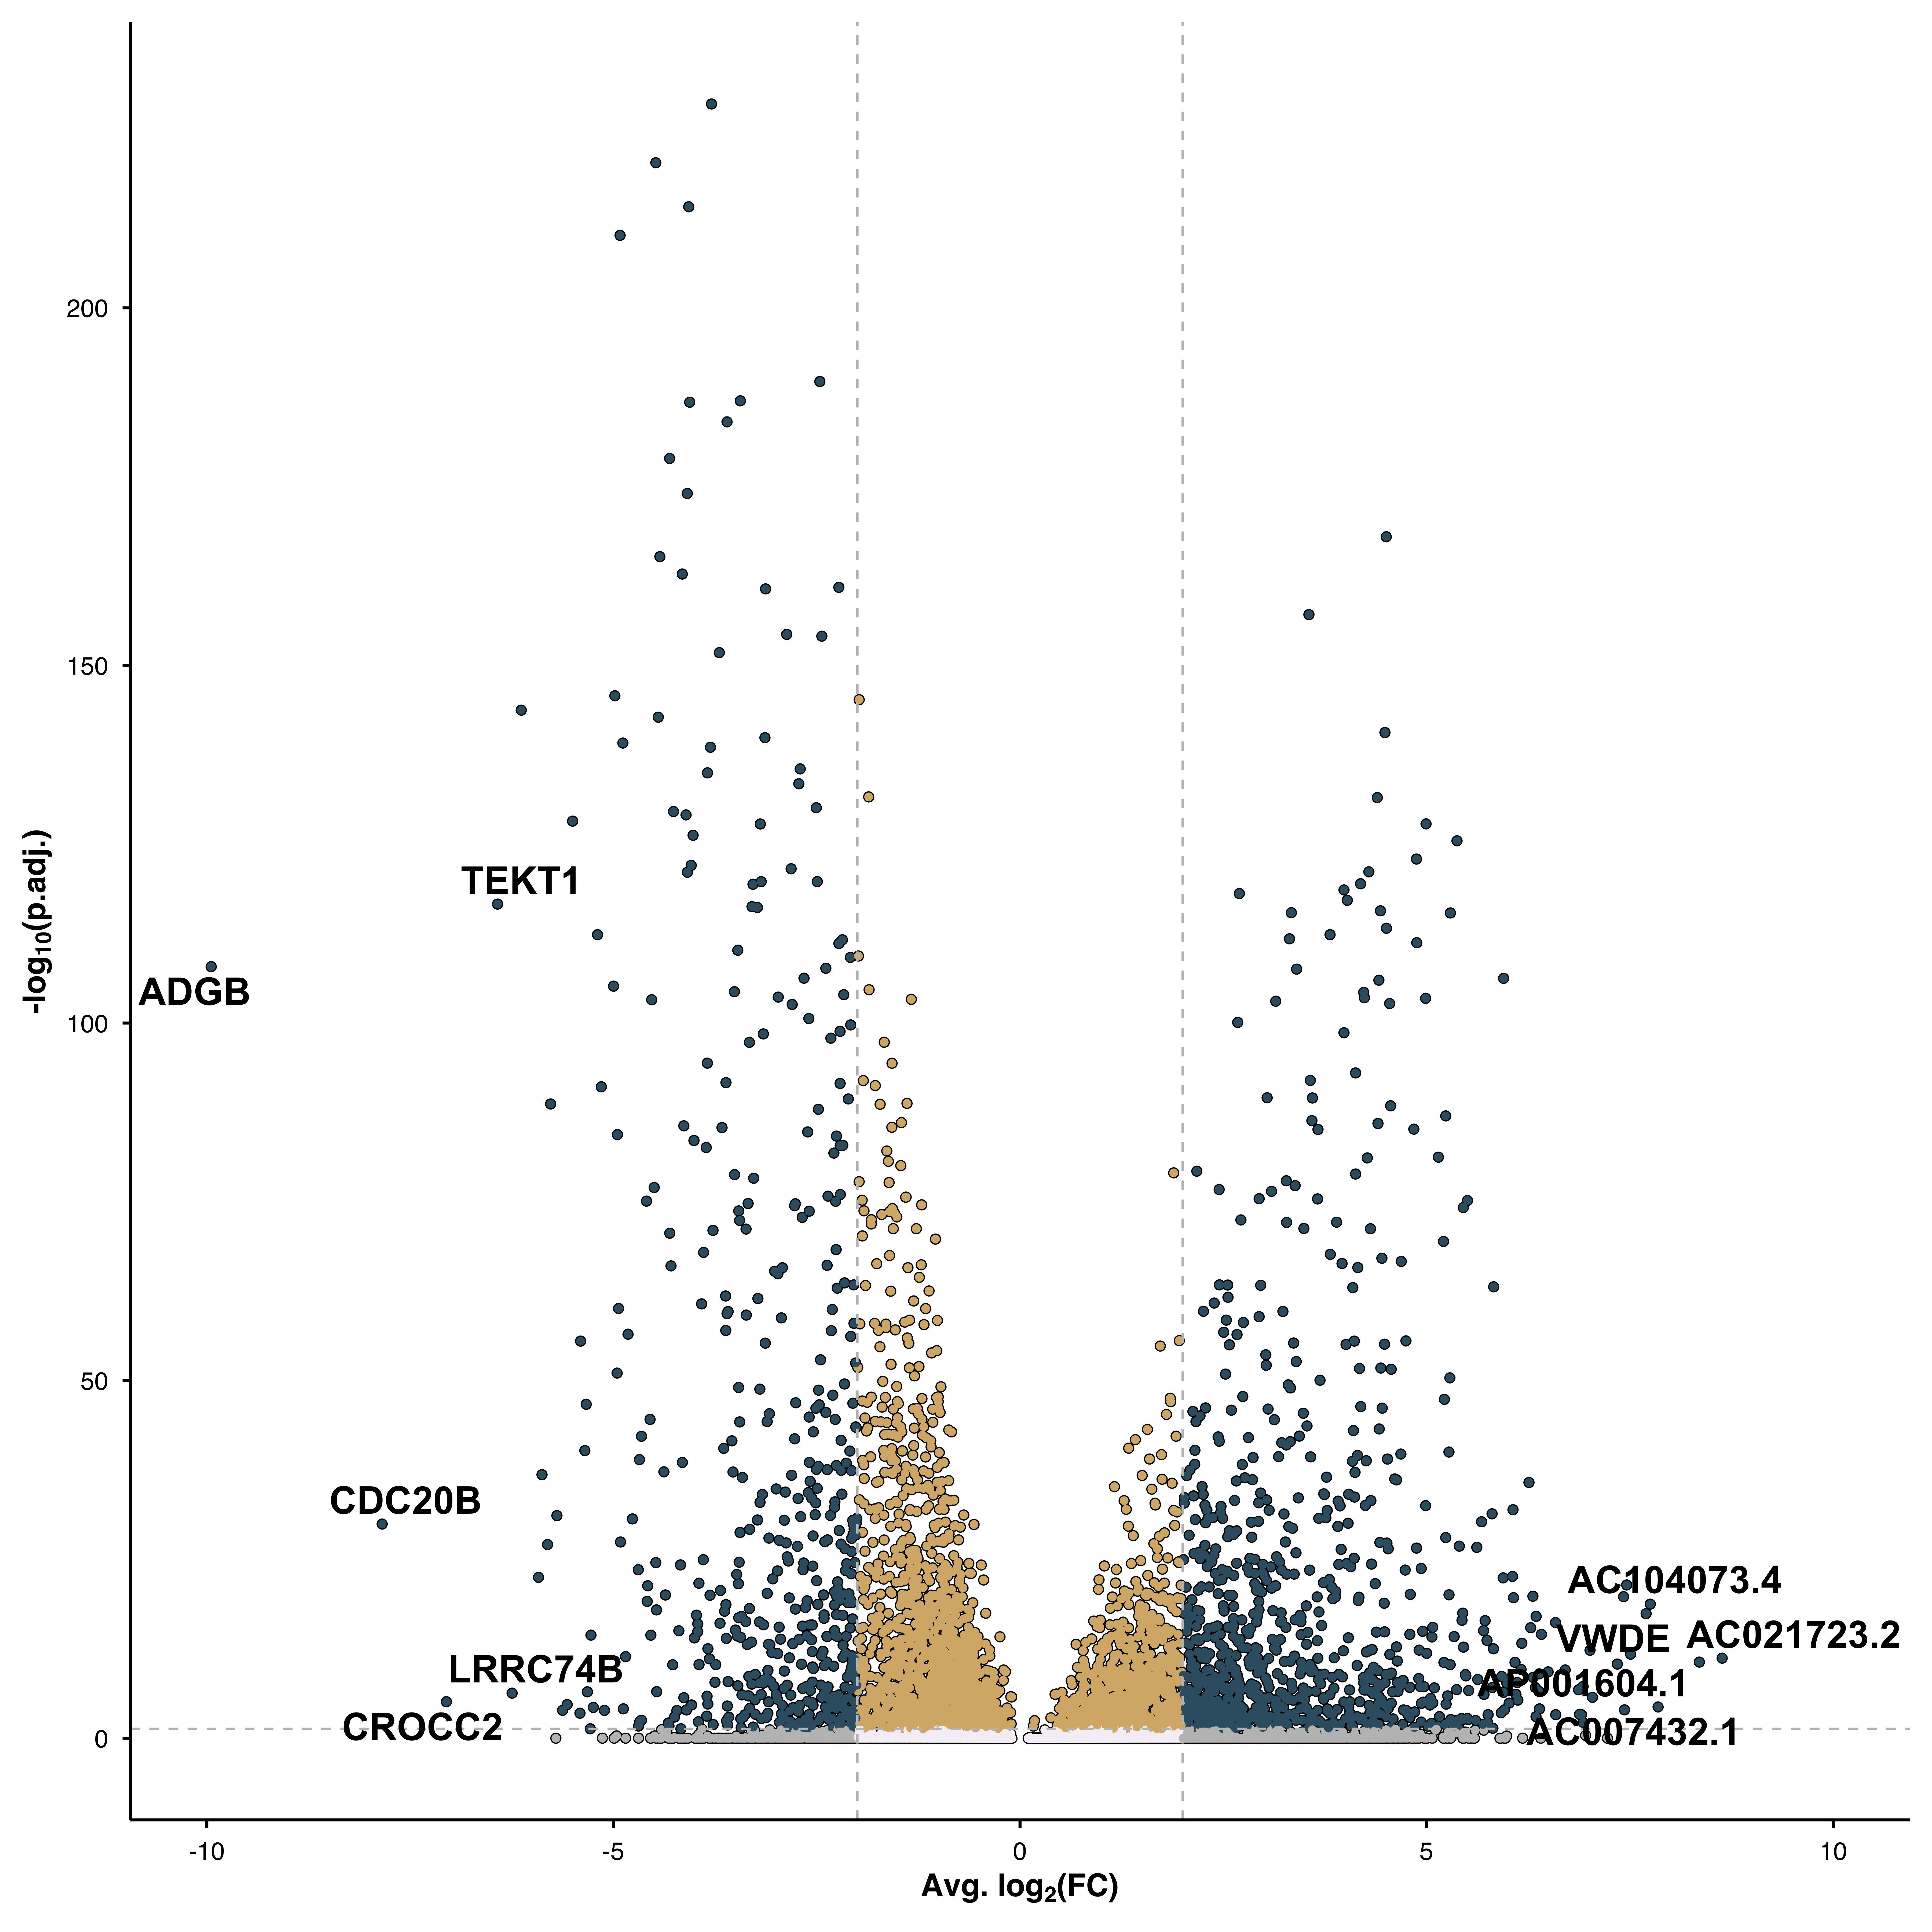
p <- SCpubr::do_VolcanoPlot(sample = sample,
                            de_genes = de_genes,
                            use_labels = TRUE)
p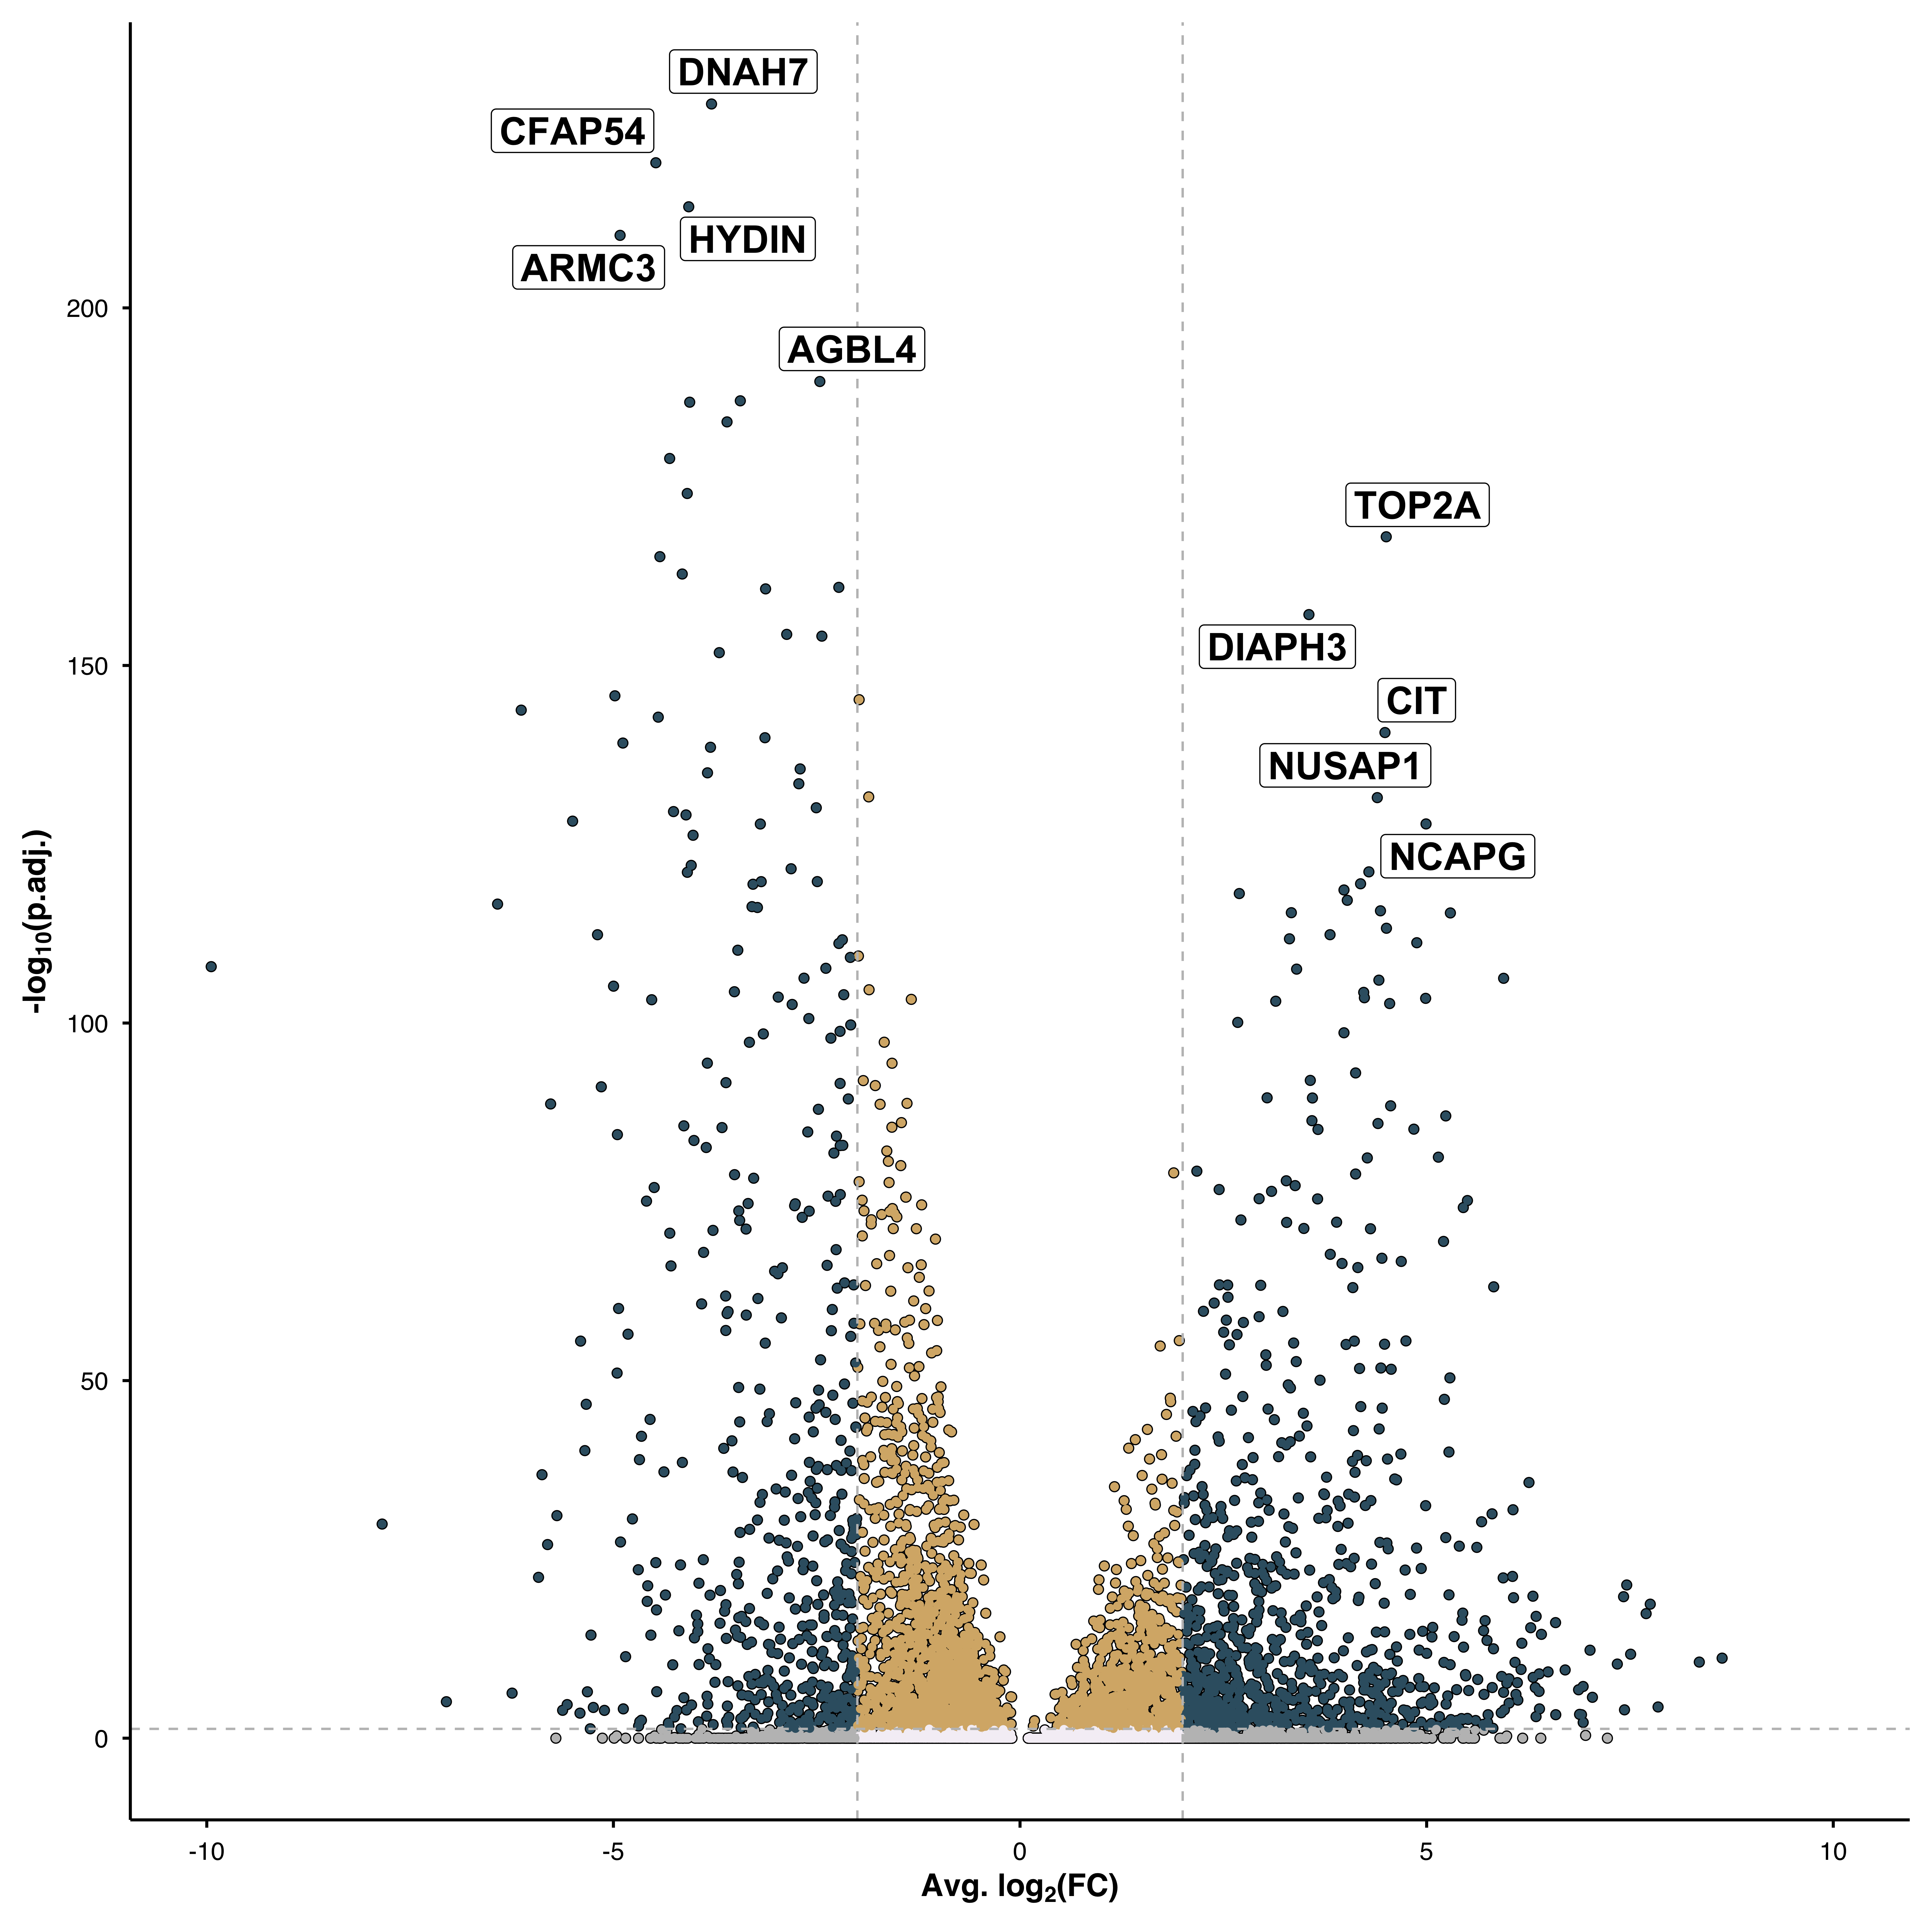
p <- SCpubr::do_VolcanoPlot(sample = sample,
                            de_genes = de_genes,
                            plot_lines = FALSE)
p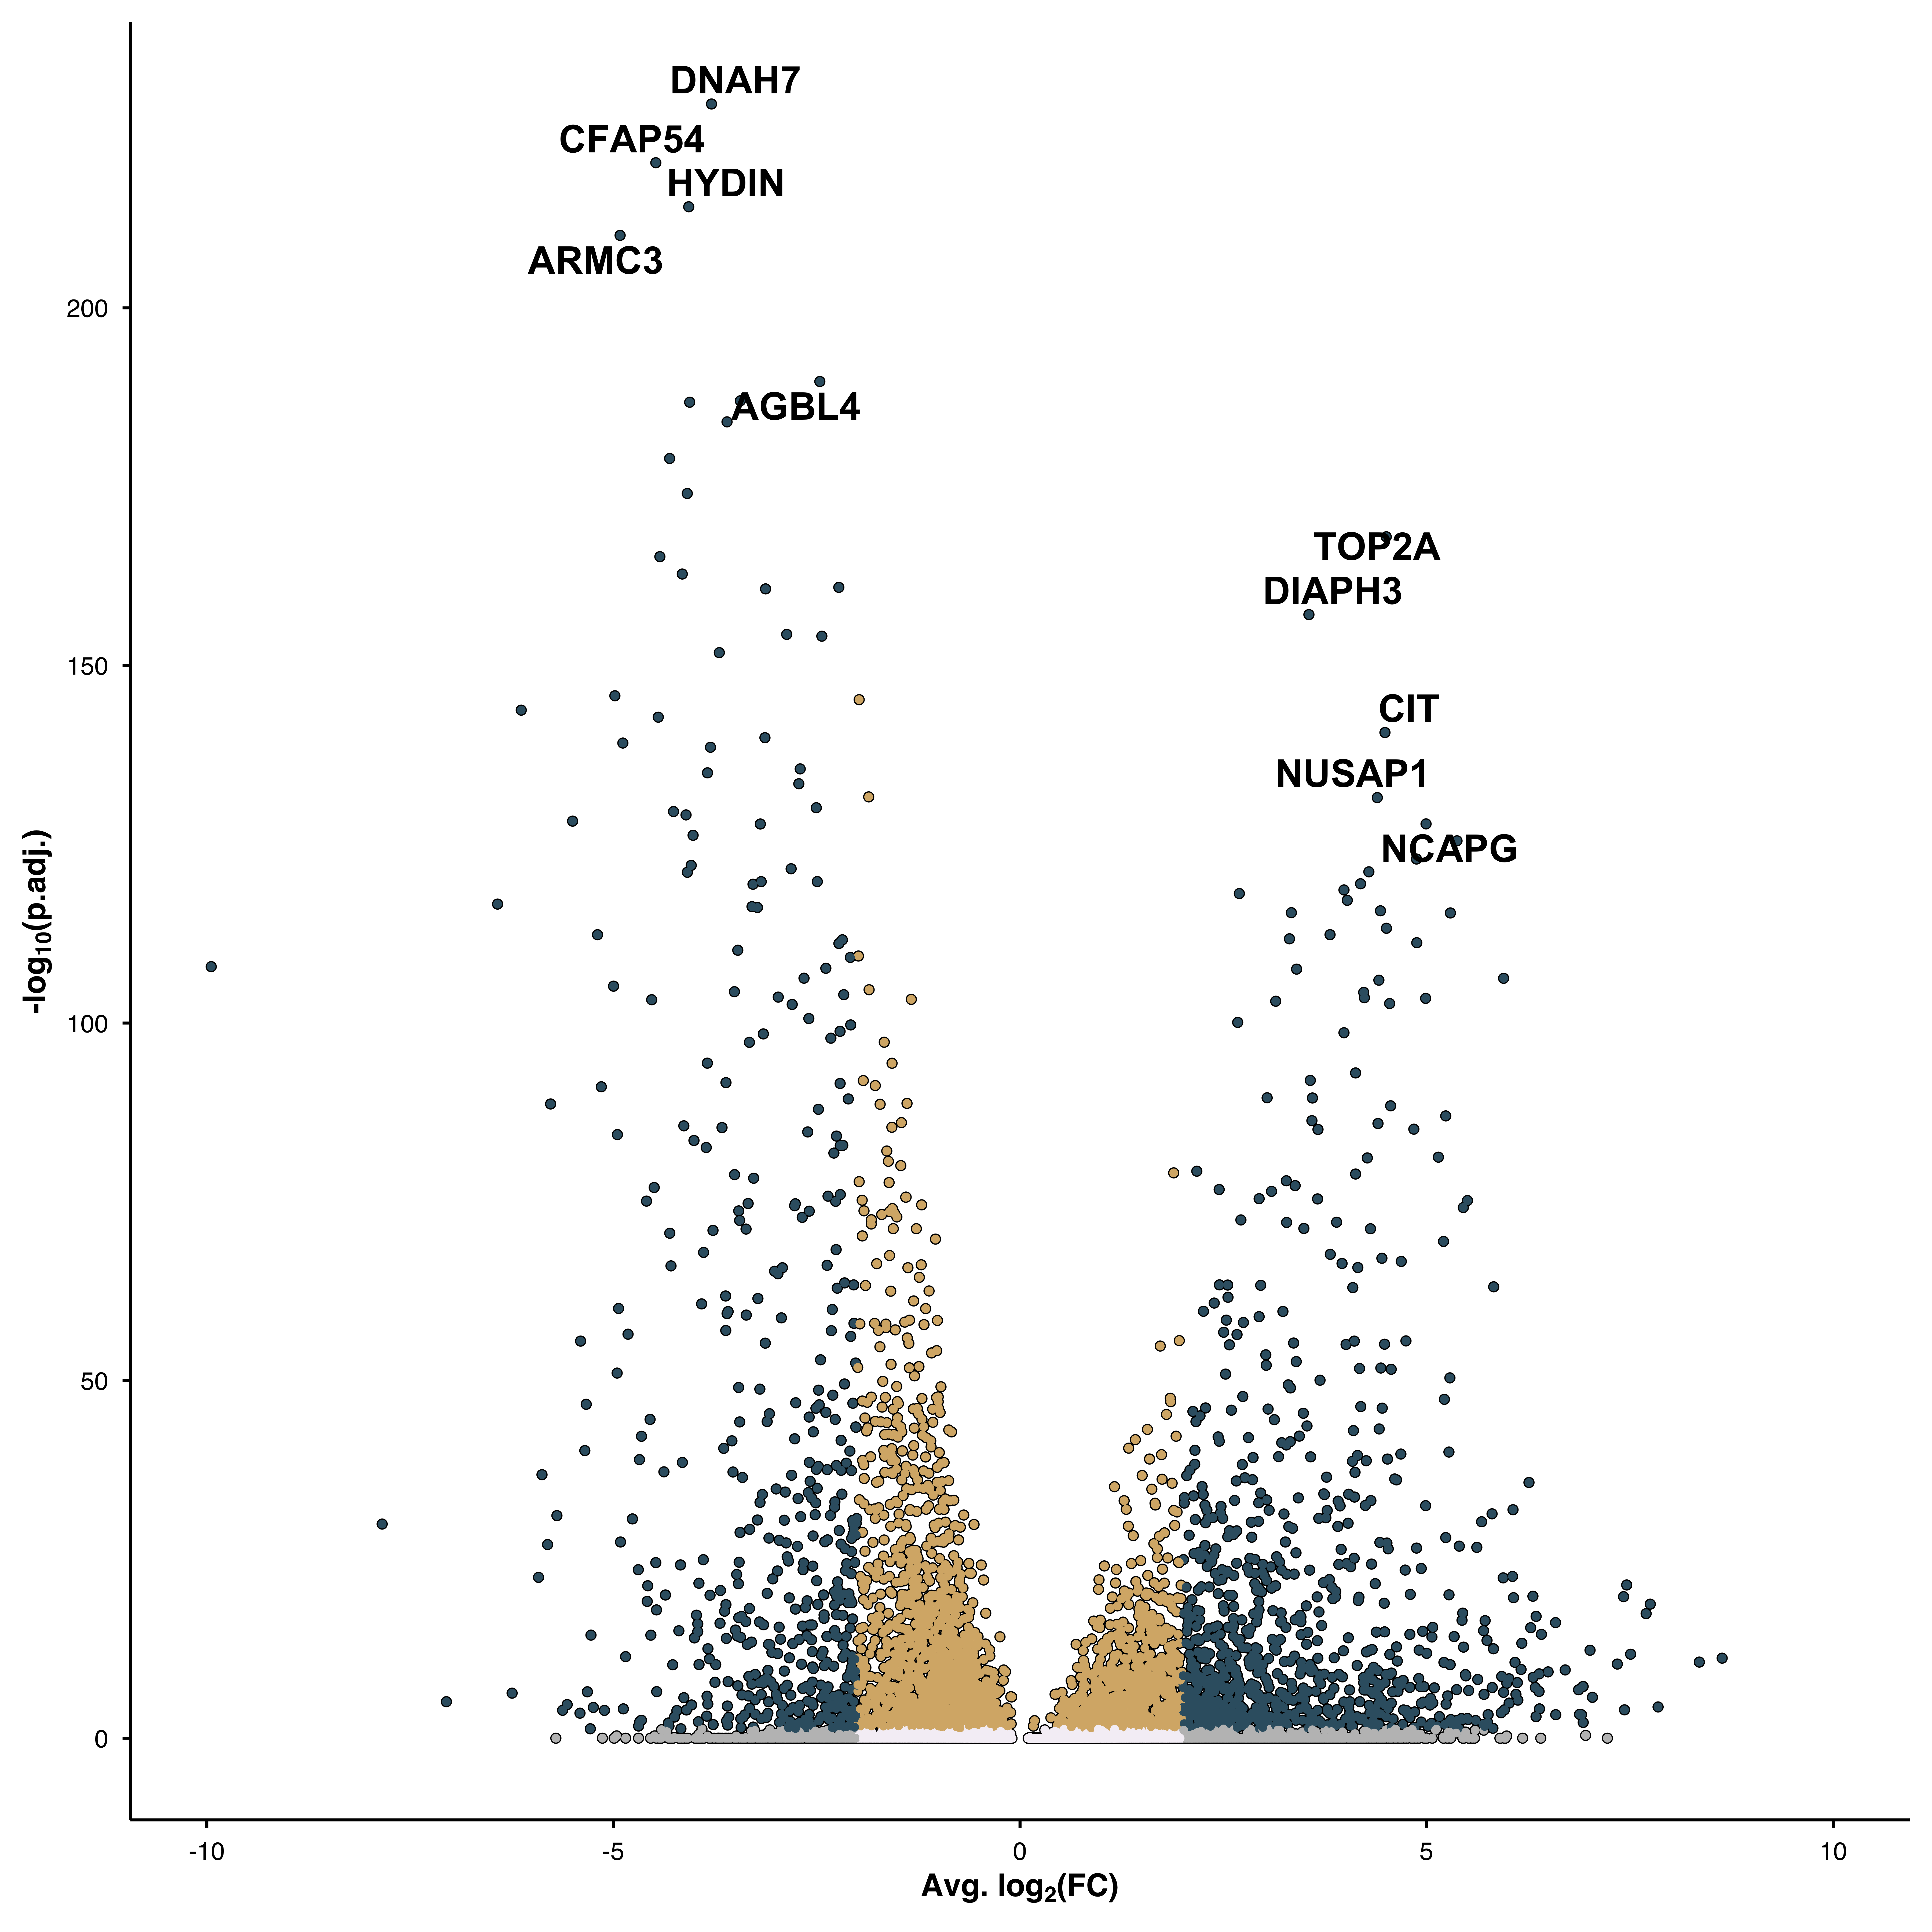
For parameters shared across many functions (color palettes, typography, legend styling), see Shared features.
| Parameter | Description | Default |
|---|---|---|
de_genes |
Output from FindMarkers()
|
— |
pval_cutoff |
P-value threshold | 0.05 |
FC_cutoff |
Fold change threshold | 2 |
| Parameter | Description | Default |
|---|---|---|
add_gene_tags |
Show gene labels | TRUE |
n_genes |
Number of genes to label | 5 |
add_tag_side |
"both", "positive", "negative"
|
"both" |
order_tags_by |
"both", "pvalue", "logfc"
|
"both" |
use_labels |
Use geom_label()
|
FALSE |
tag_size |
Label text size | 6 |
| Parameter | Description | Default |
|---|---|---|
plot_lines |
Show threshold lines | TRUE |
line_color |
Line color | "grey75" |
line_size |
Line thickness | 0.5 |