p <- SCpubr::do_FeaturePlot(sample = sample,
                            features = "PC_1")
p
Feature plots display continuous values—gene expression, metadata scores, or dimensional reduction components—on a dimensional reduction embedding. Unlike do_DimPlot() which colors by categories, do_FeaturePlot() maps numeric values to a color gradient.
Plot a single feature (gene, metadata column, or PC component):
p <- SCpubr::do_FeaturePlot(sample = sample,
features = "PC_1")
p
Plot several features at once:
p <- SCpubr::do_FeaturePlot(sample = sample,
                            features = c("PC_1", "PC_2"),
                            ncol = 2)
p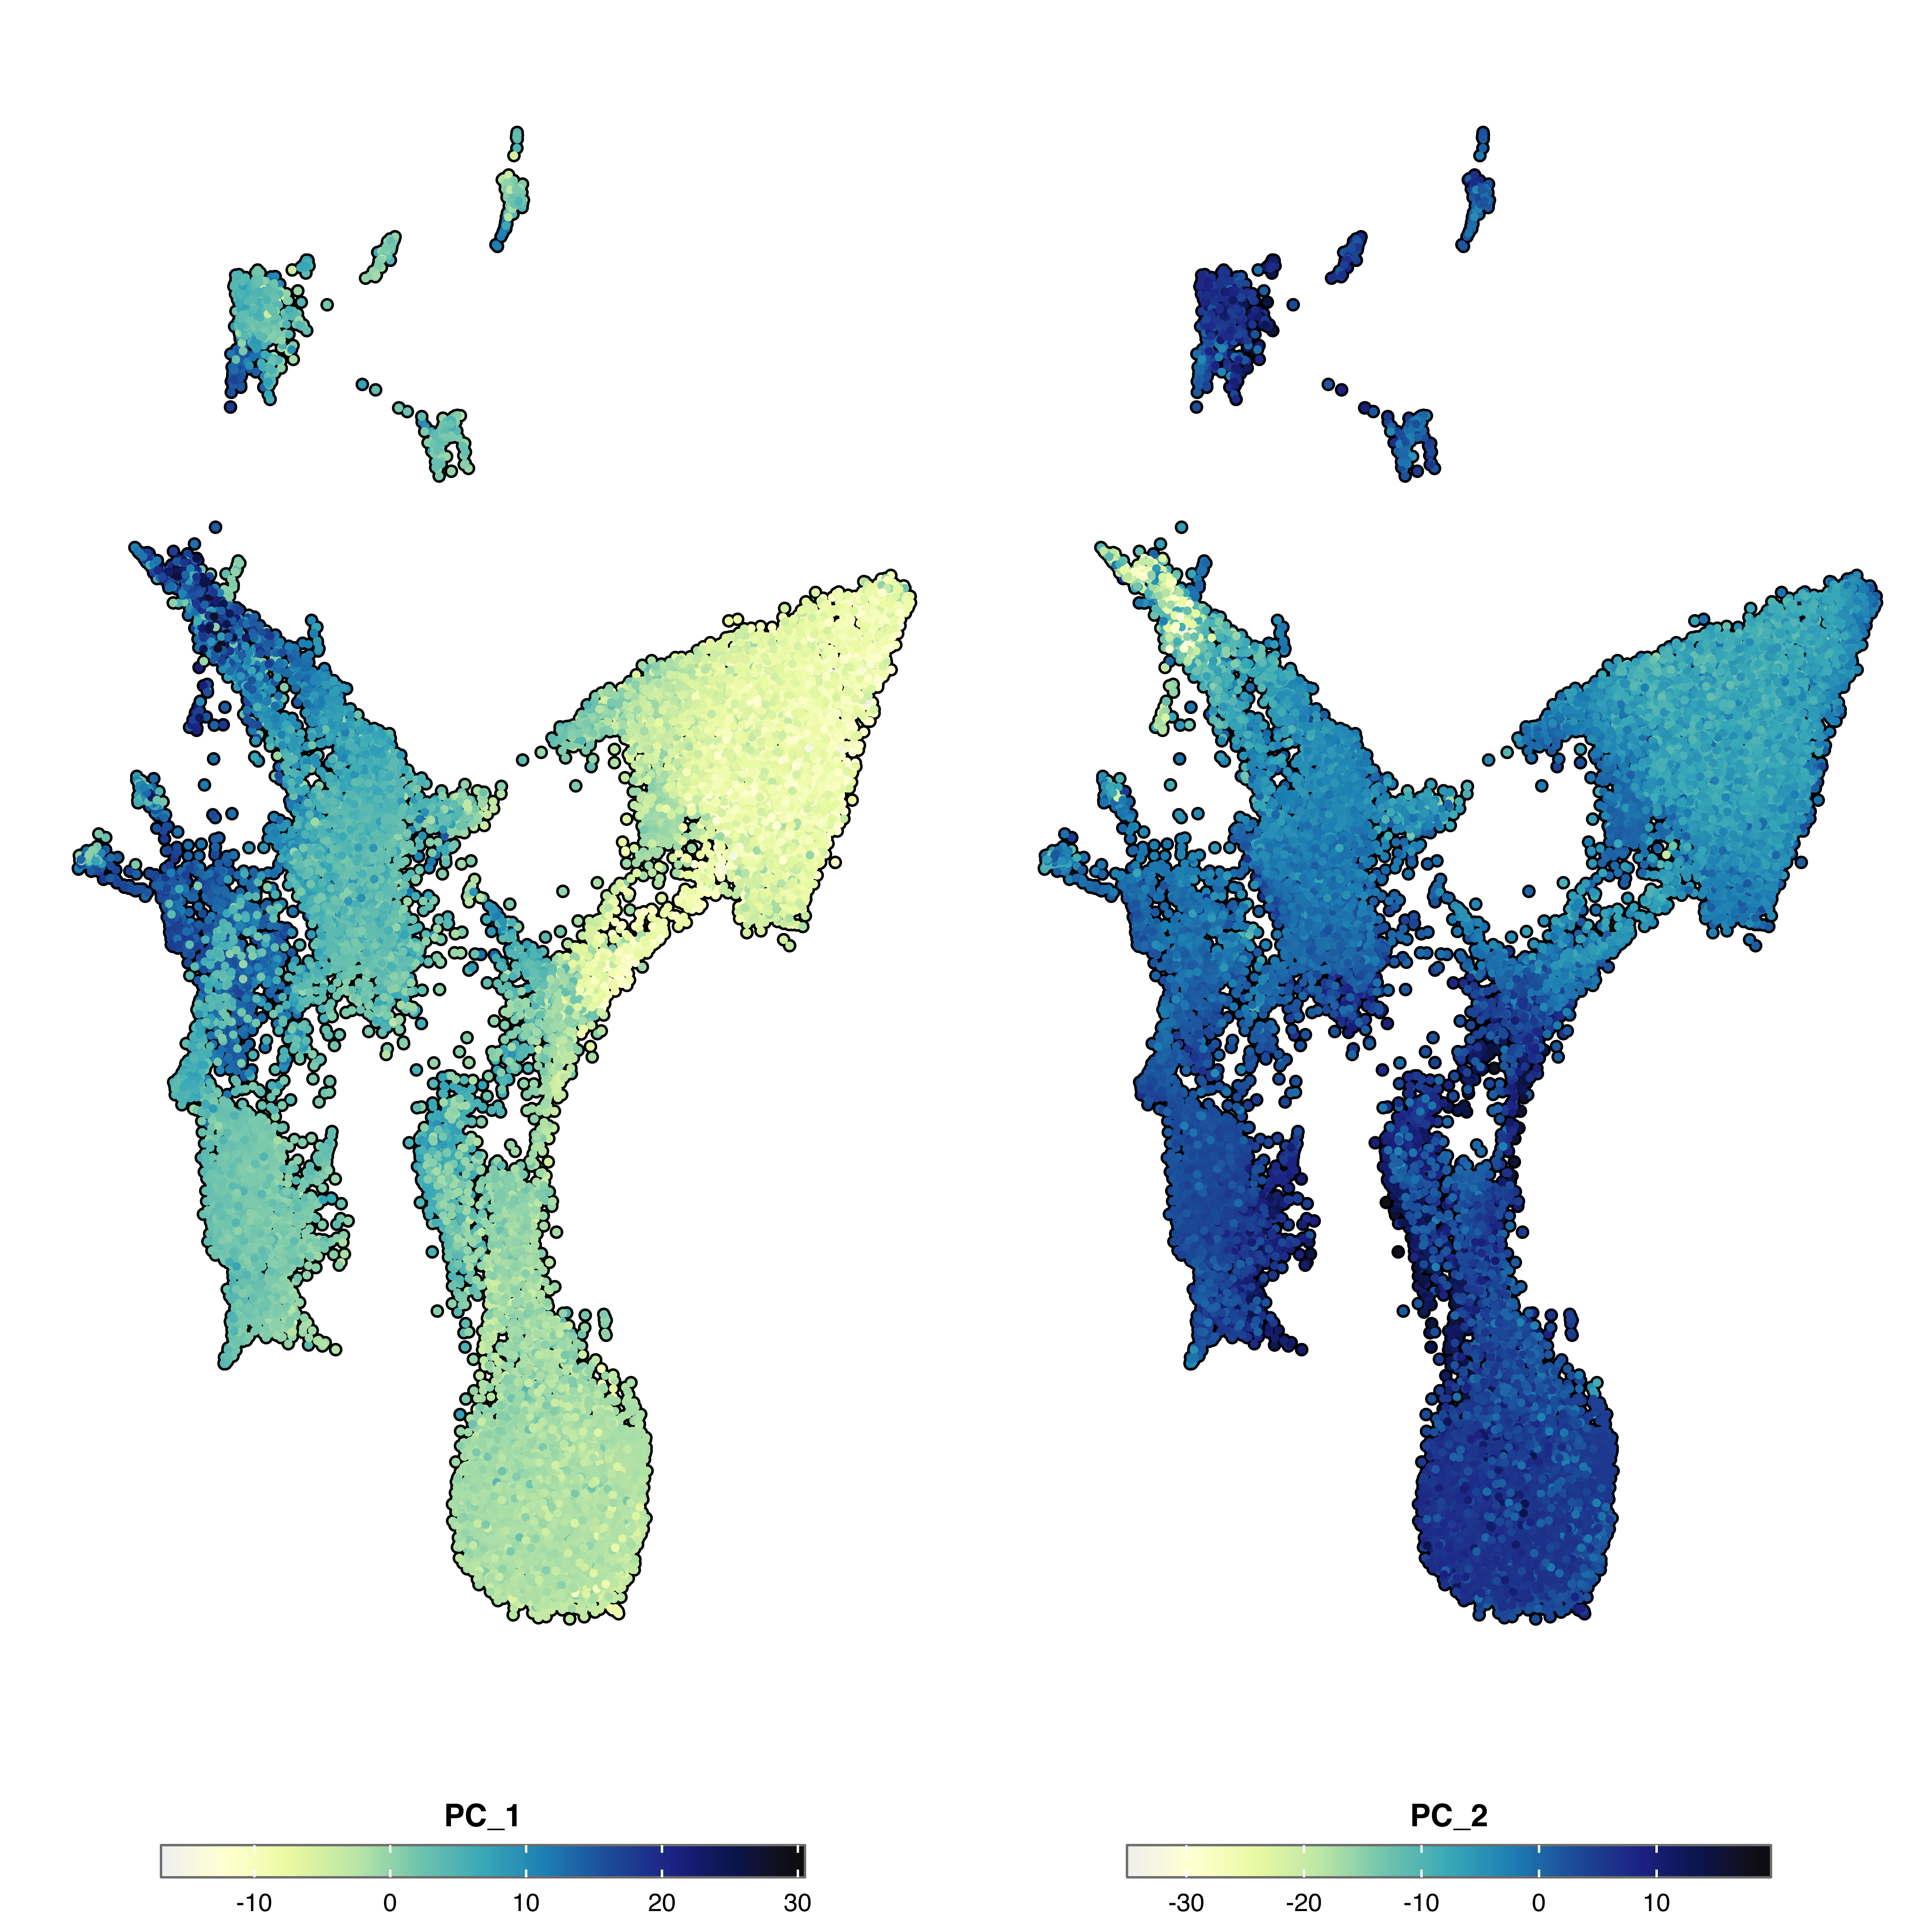
Outliers often compress the color range. Use min.cutoff and max.cutoff to clamp values:
p <- SCpubr::do_FeaturePlot(sample = sample,
                            features = "PC_1",
                            min.cutoff = -10,
                            max.cutoff = 10)
p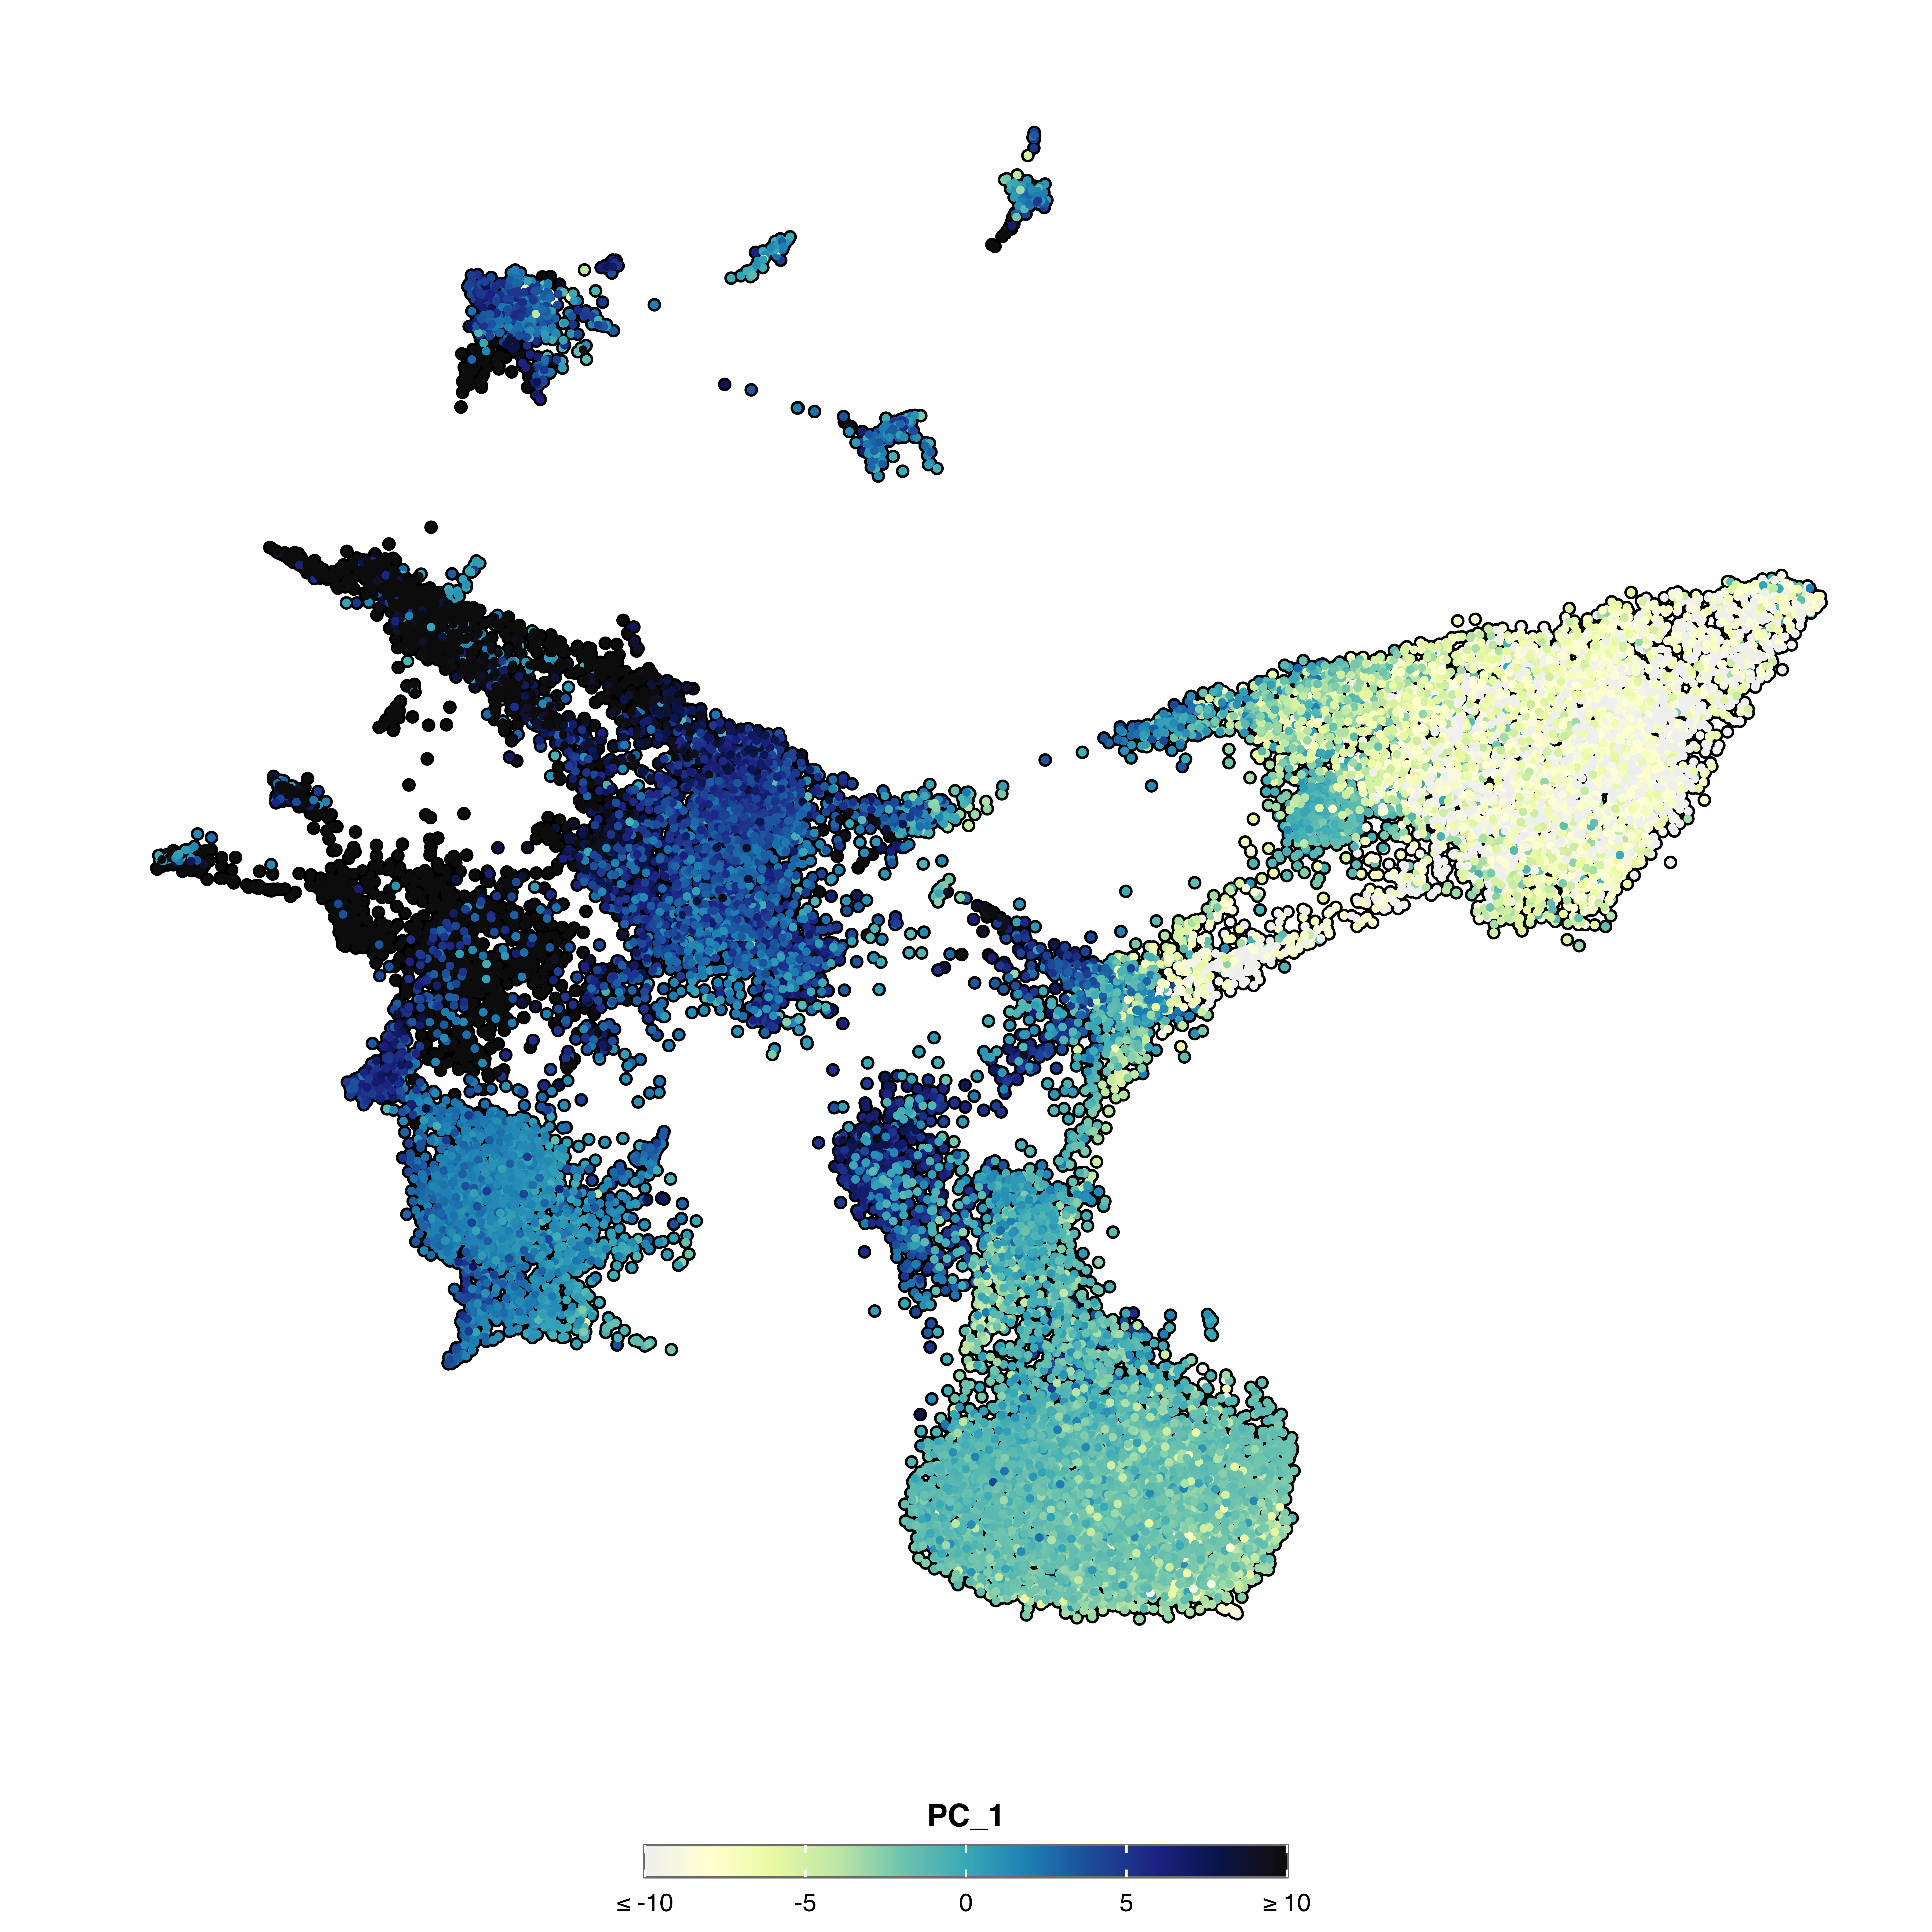
Provide one value per feature: min.cutoff = c(0, 0.5, 1) for three features.
Use scale.limits to extend the scale beyond data range (useful for comparing across samples):
p <- SCpubr::do_FeaturePlot(sample = sample,
                            features = "PC_1",
                            scale.limits = c(-50, 50))
p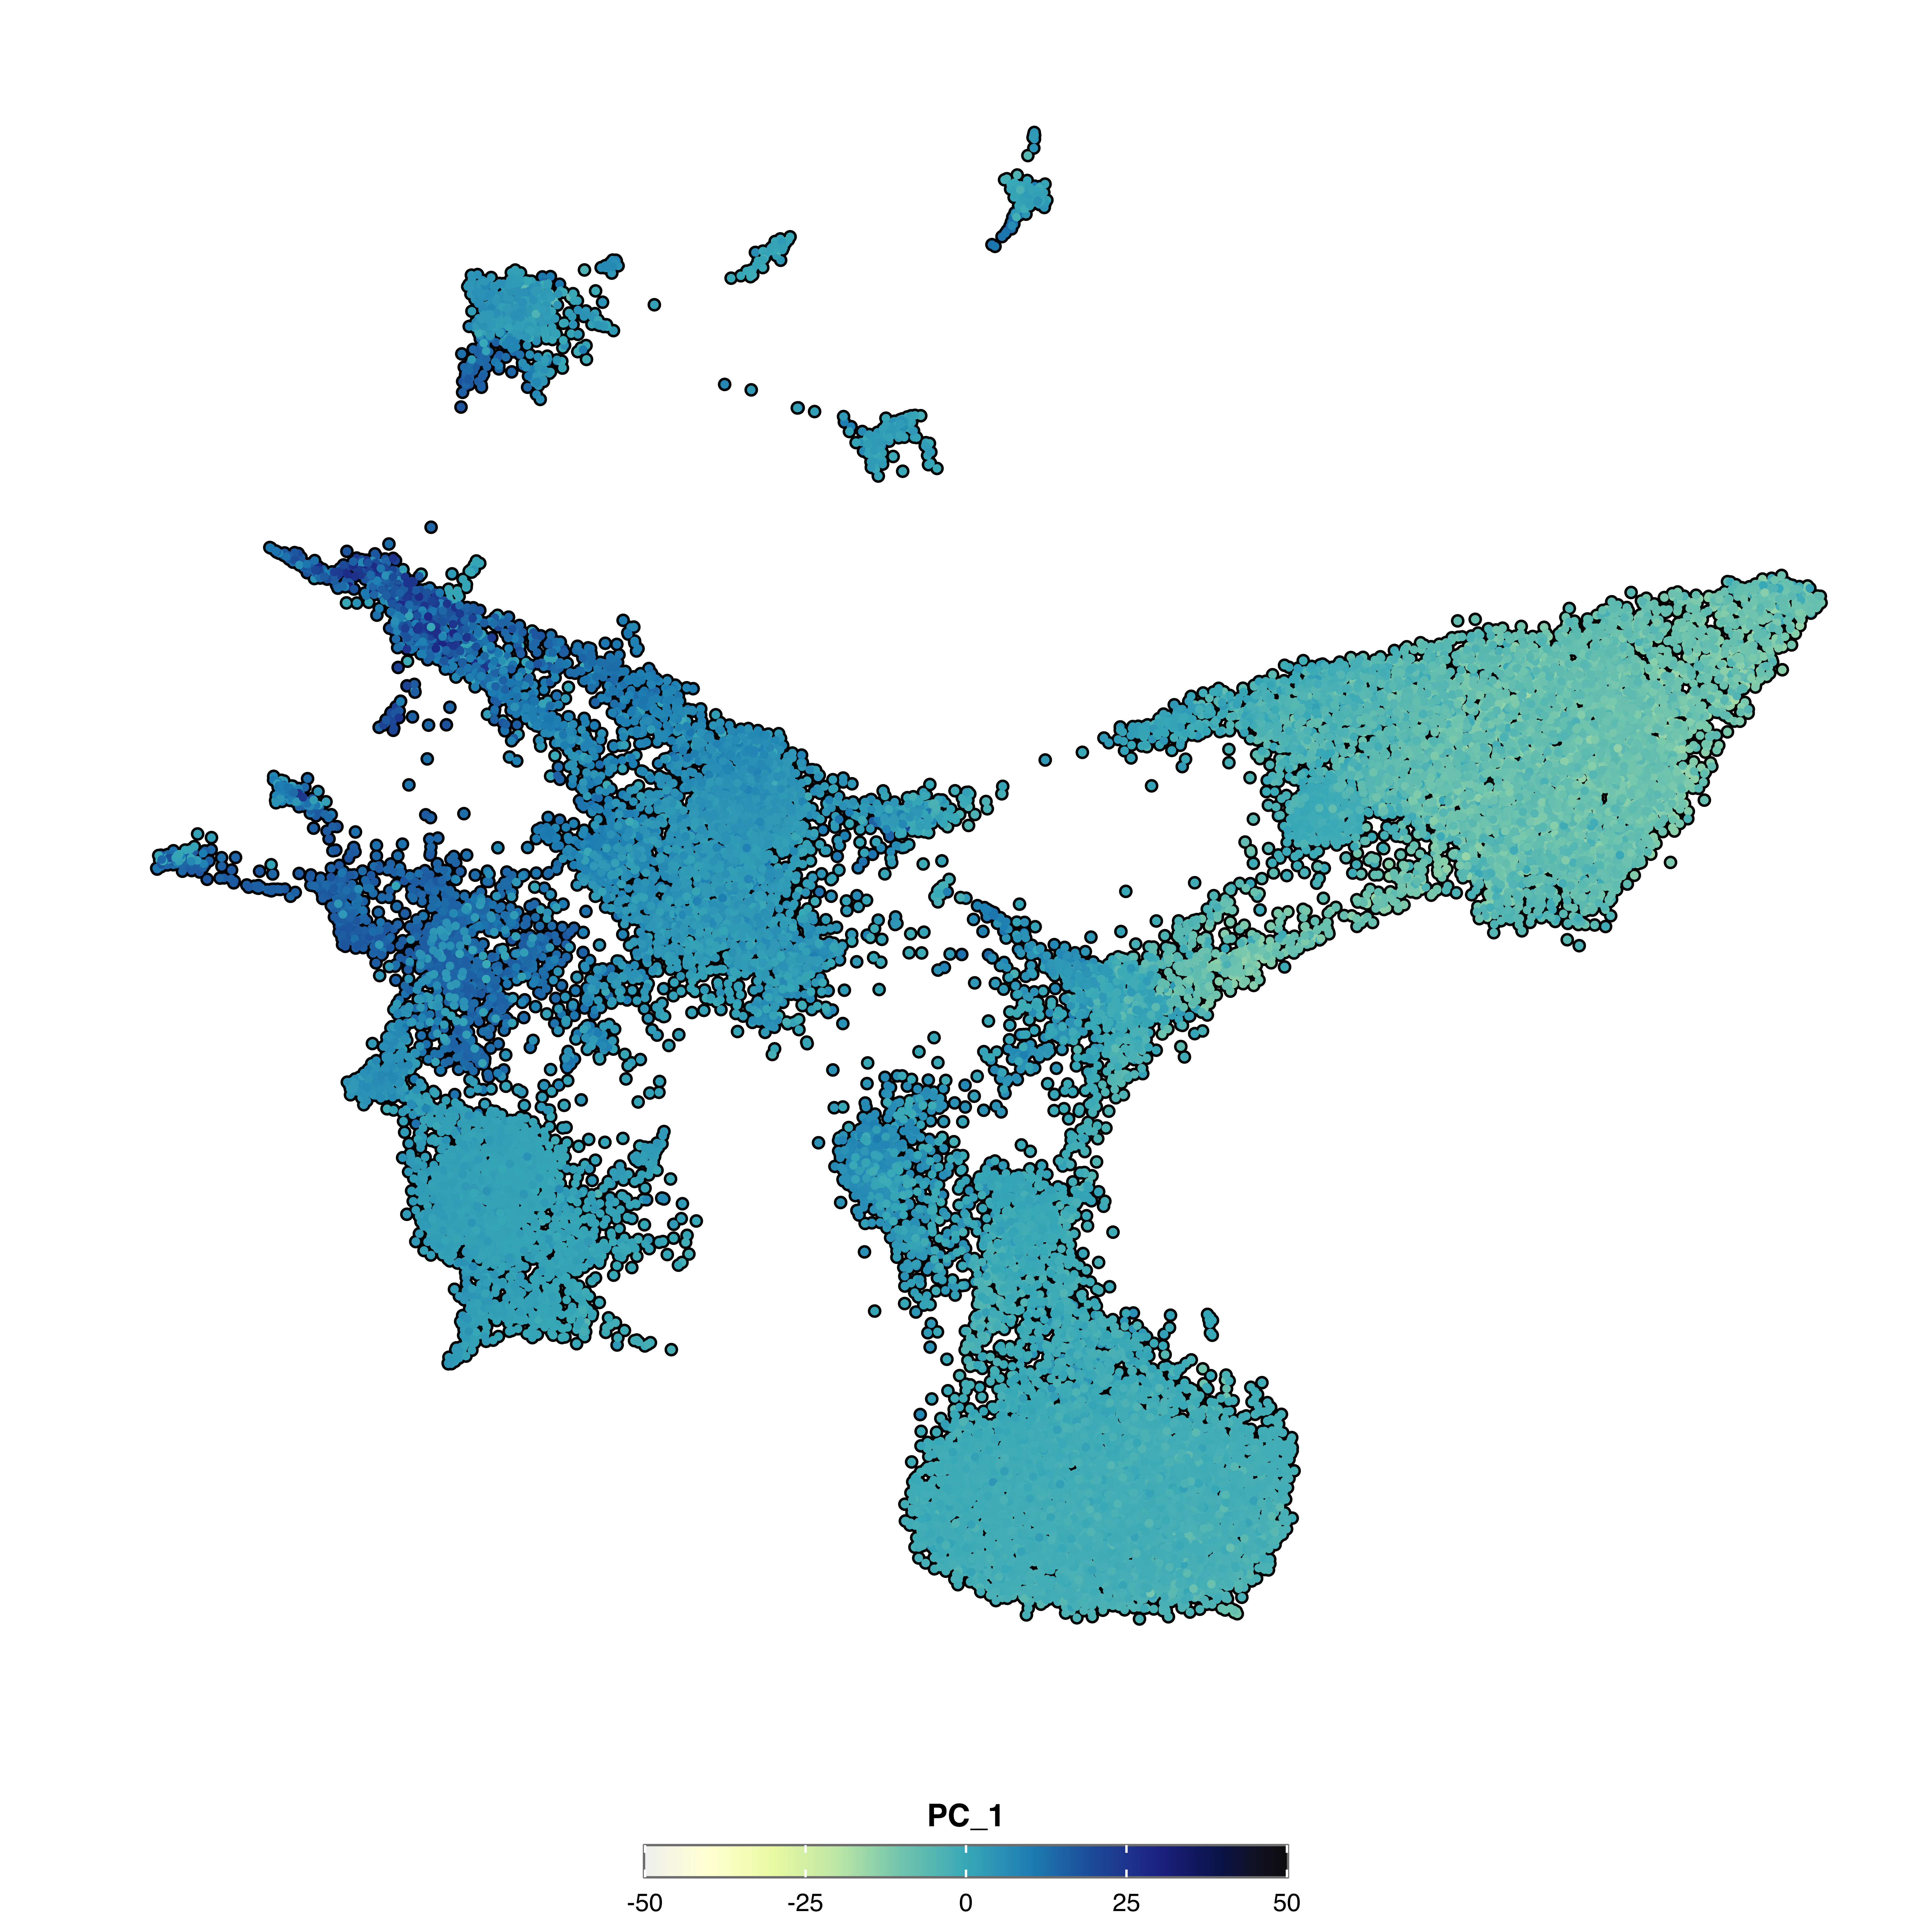
scale.limits cannot be used with min.cutoff or max.cutoff.
Center the color scale around zero (or another value) for diverging data:
# Absolute symmetry: scale extends equally in both directions
p1 <- SCpubr::do_FeaturePlot(sample = sample,
                            features = "PC_1",
                            enforce_symmetry = TRUE,
                            symmetry.type = "absolute")

# Centered symmetry: center around a specific value
p2 <- SCpubr::do_FeaturePlot(sample = sample,
                            features = "PC_1",
                            enforce_symmetry = TRUE,
                            symmetry.type = "centered",
                            symmetry.center = 10)

p1 | p2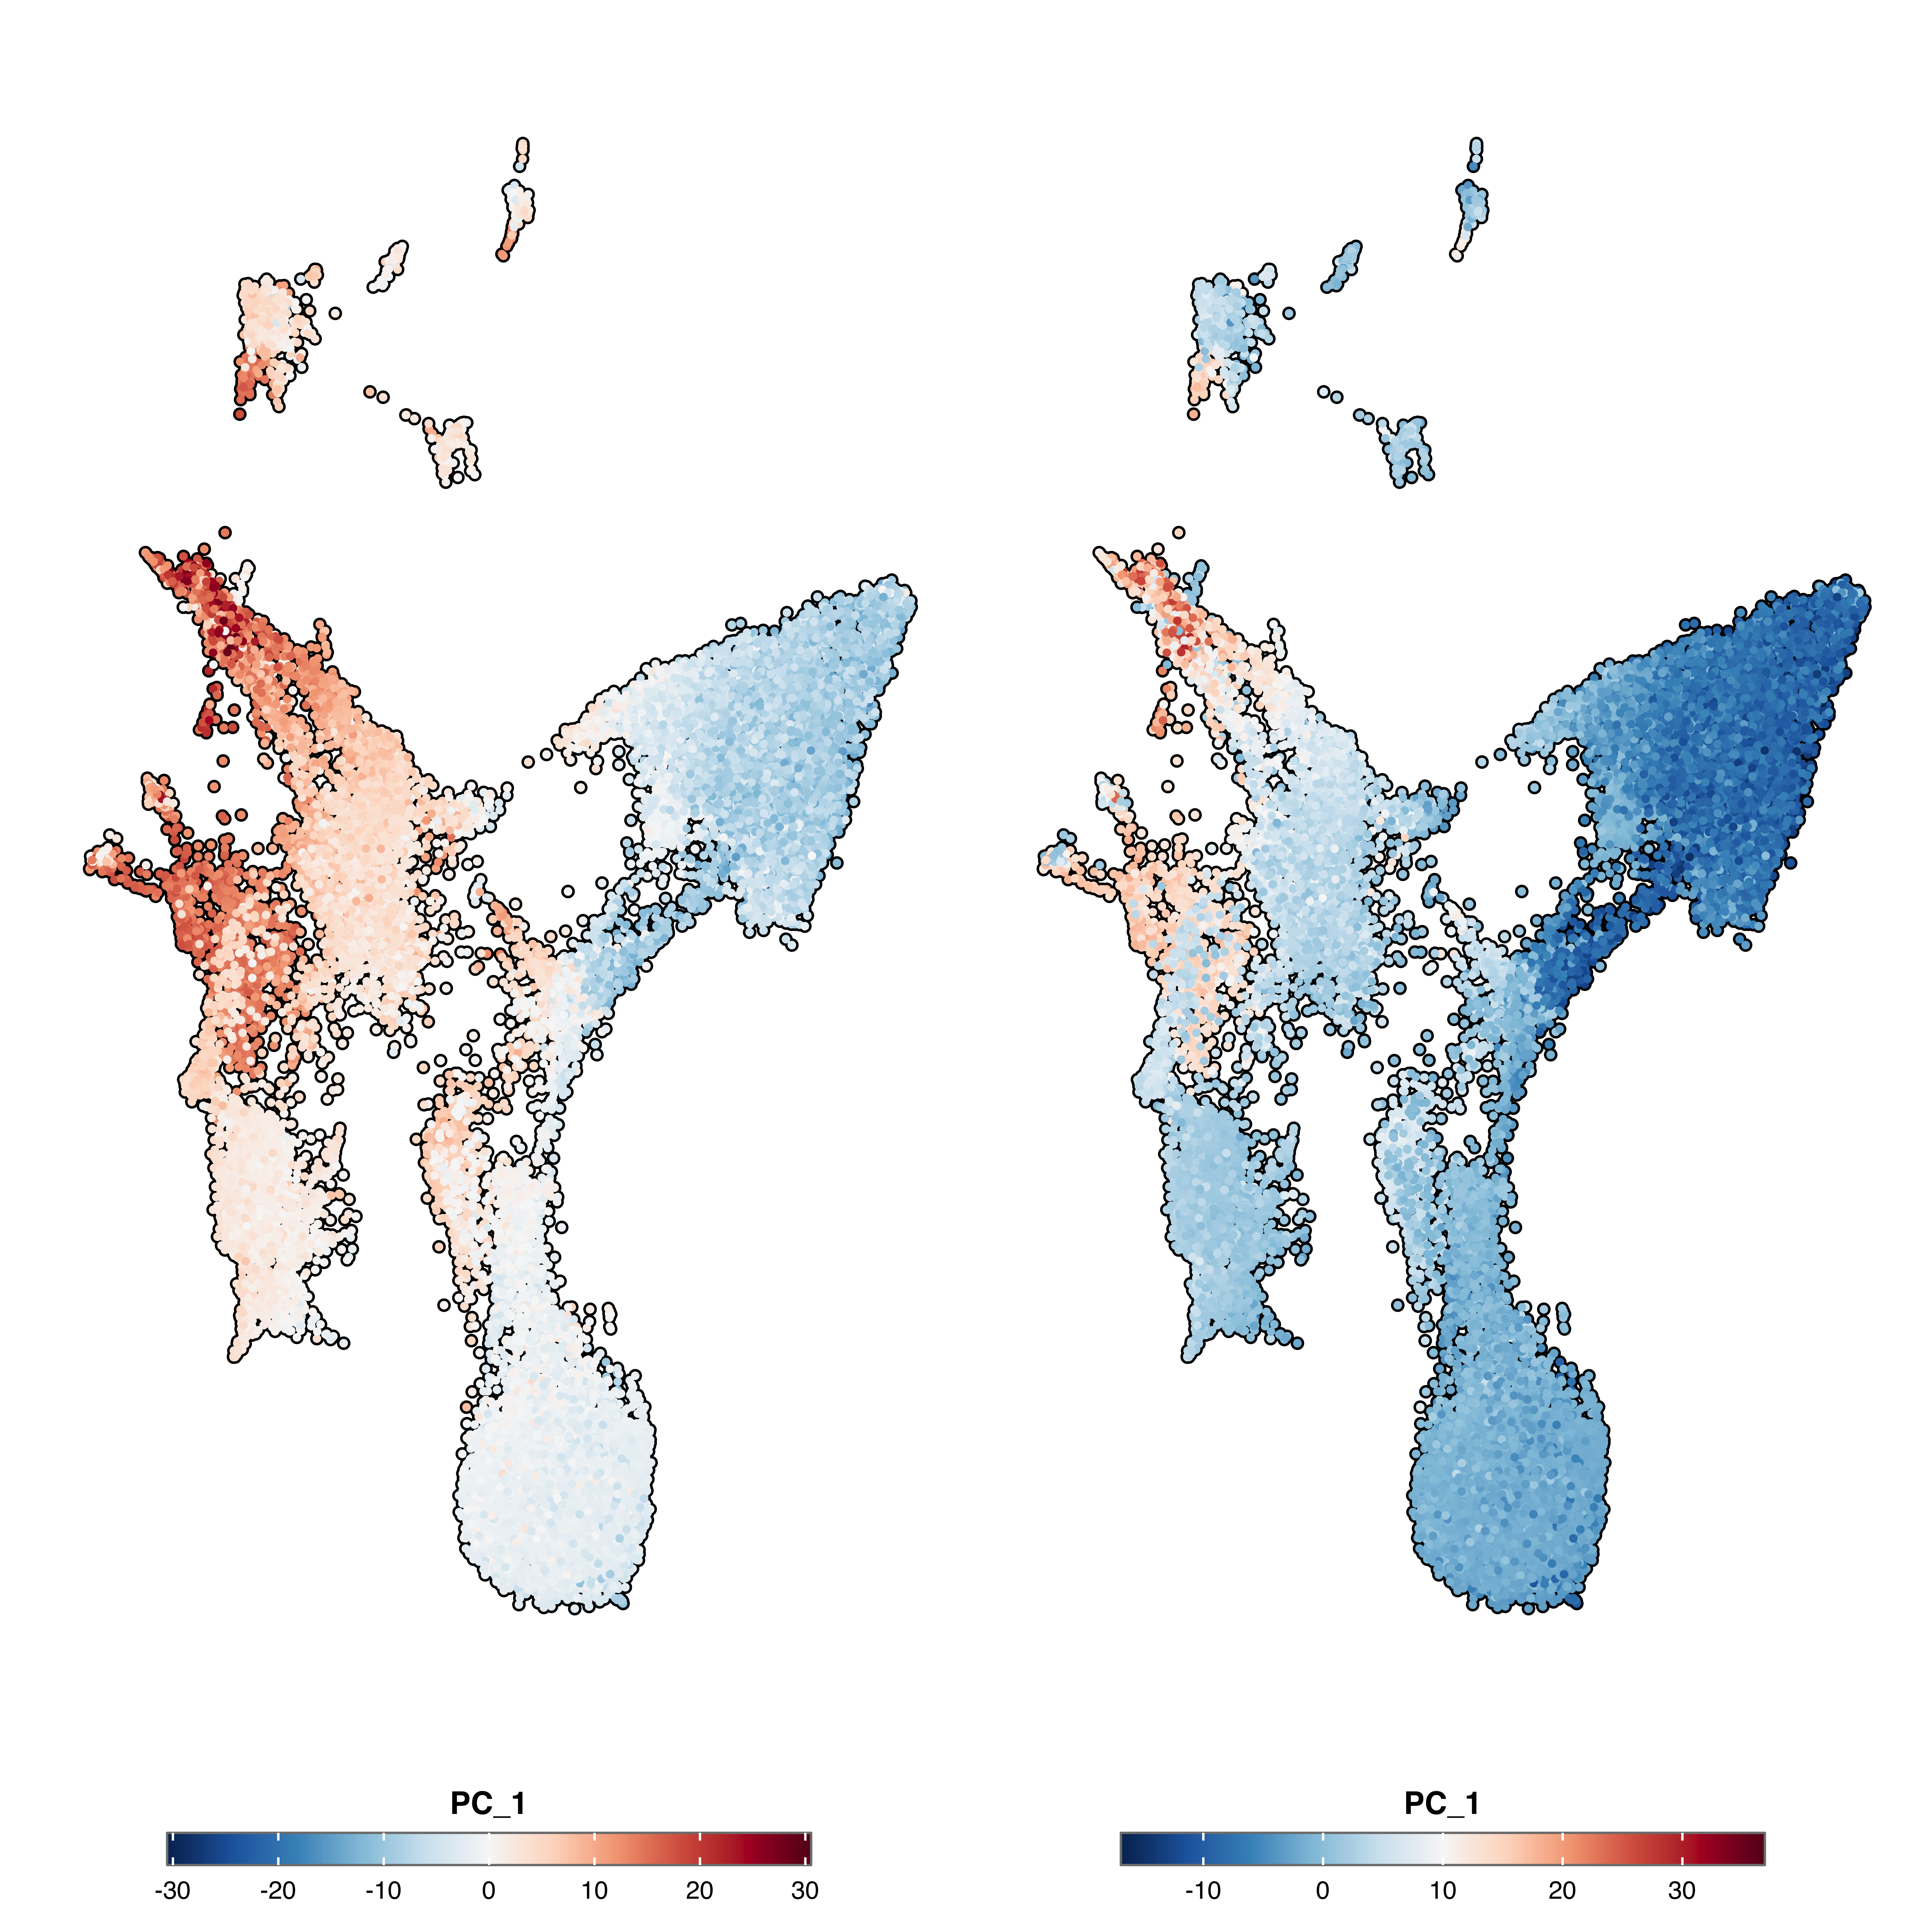
# RColorBrewer sequential palette
p1 <- SCpubr::do_FeaturePlot(sample = sample,
                            features = "PC_1",
                            use_viridis = FALSE,
                            sequential.palette = "YlOrRd",
                            sequential.direction = 1)

# Viridis palette
p2 <- SCpubr::do_FeaturePlot(sample = sample,
                            features = "PC_1",
                            use_viridis = TRUE,
                            viridis.palette = "G",
                            viridis.direction = 1)

p1 | p2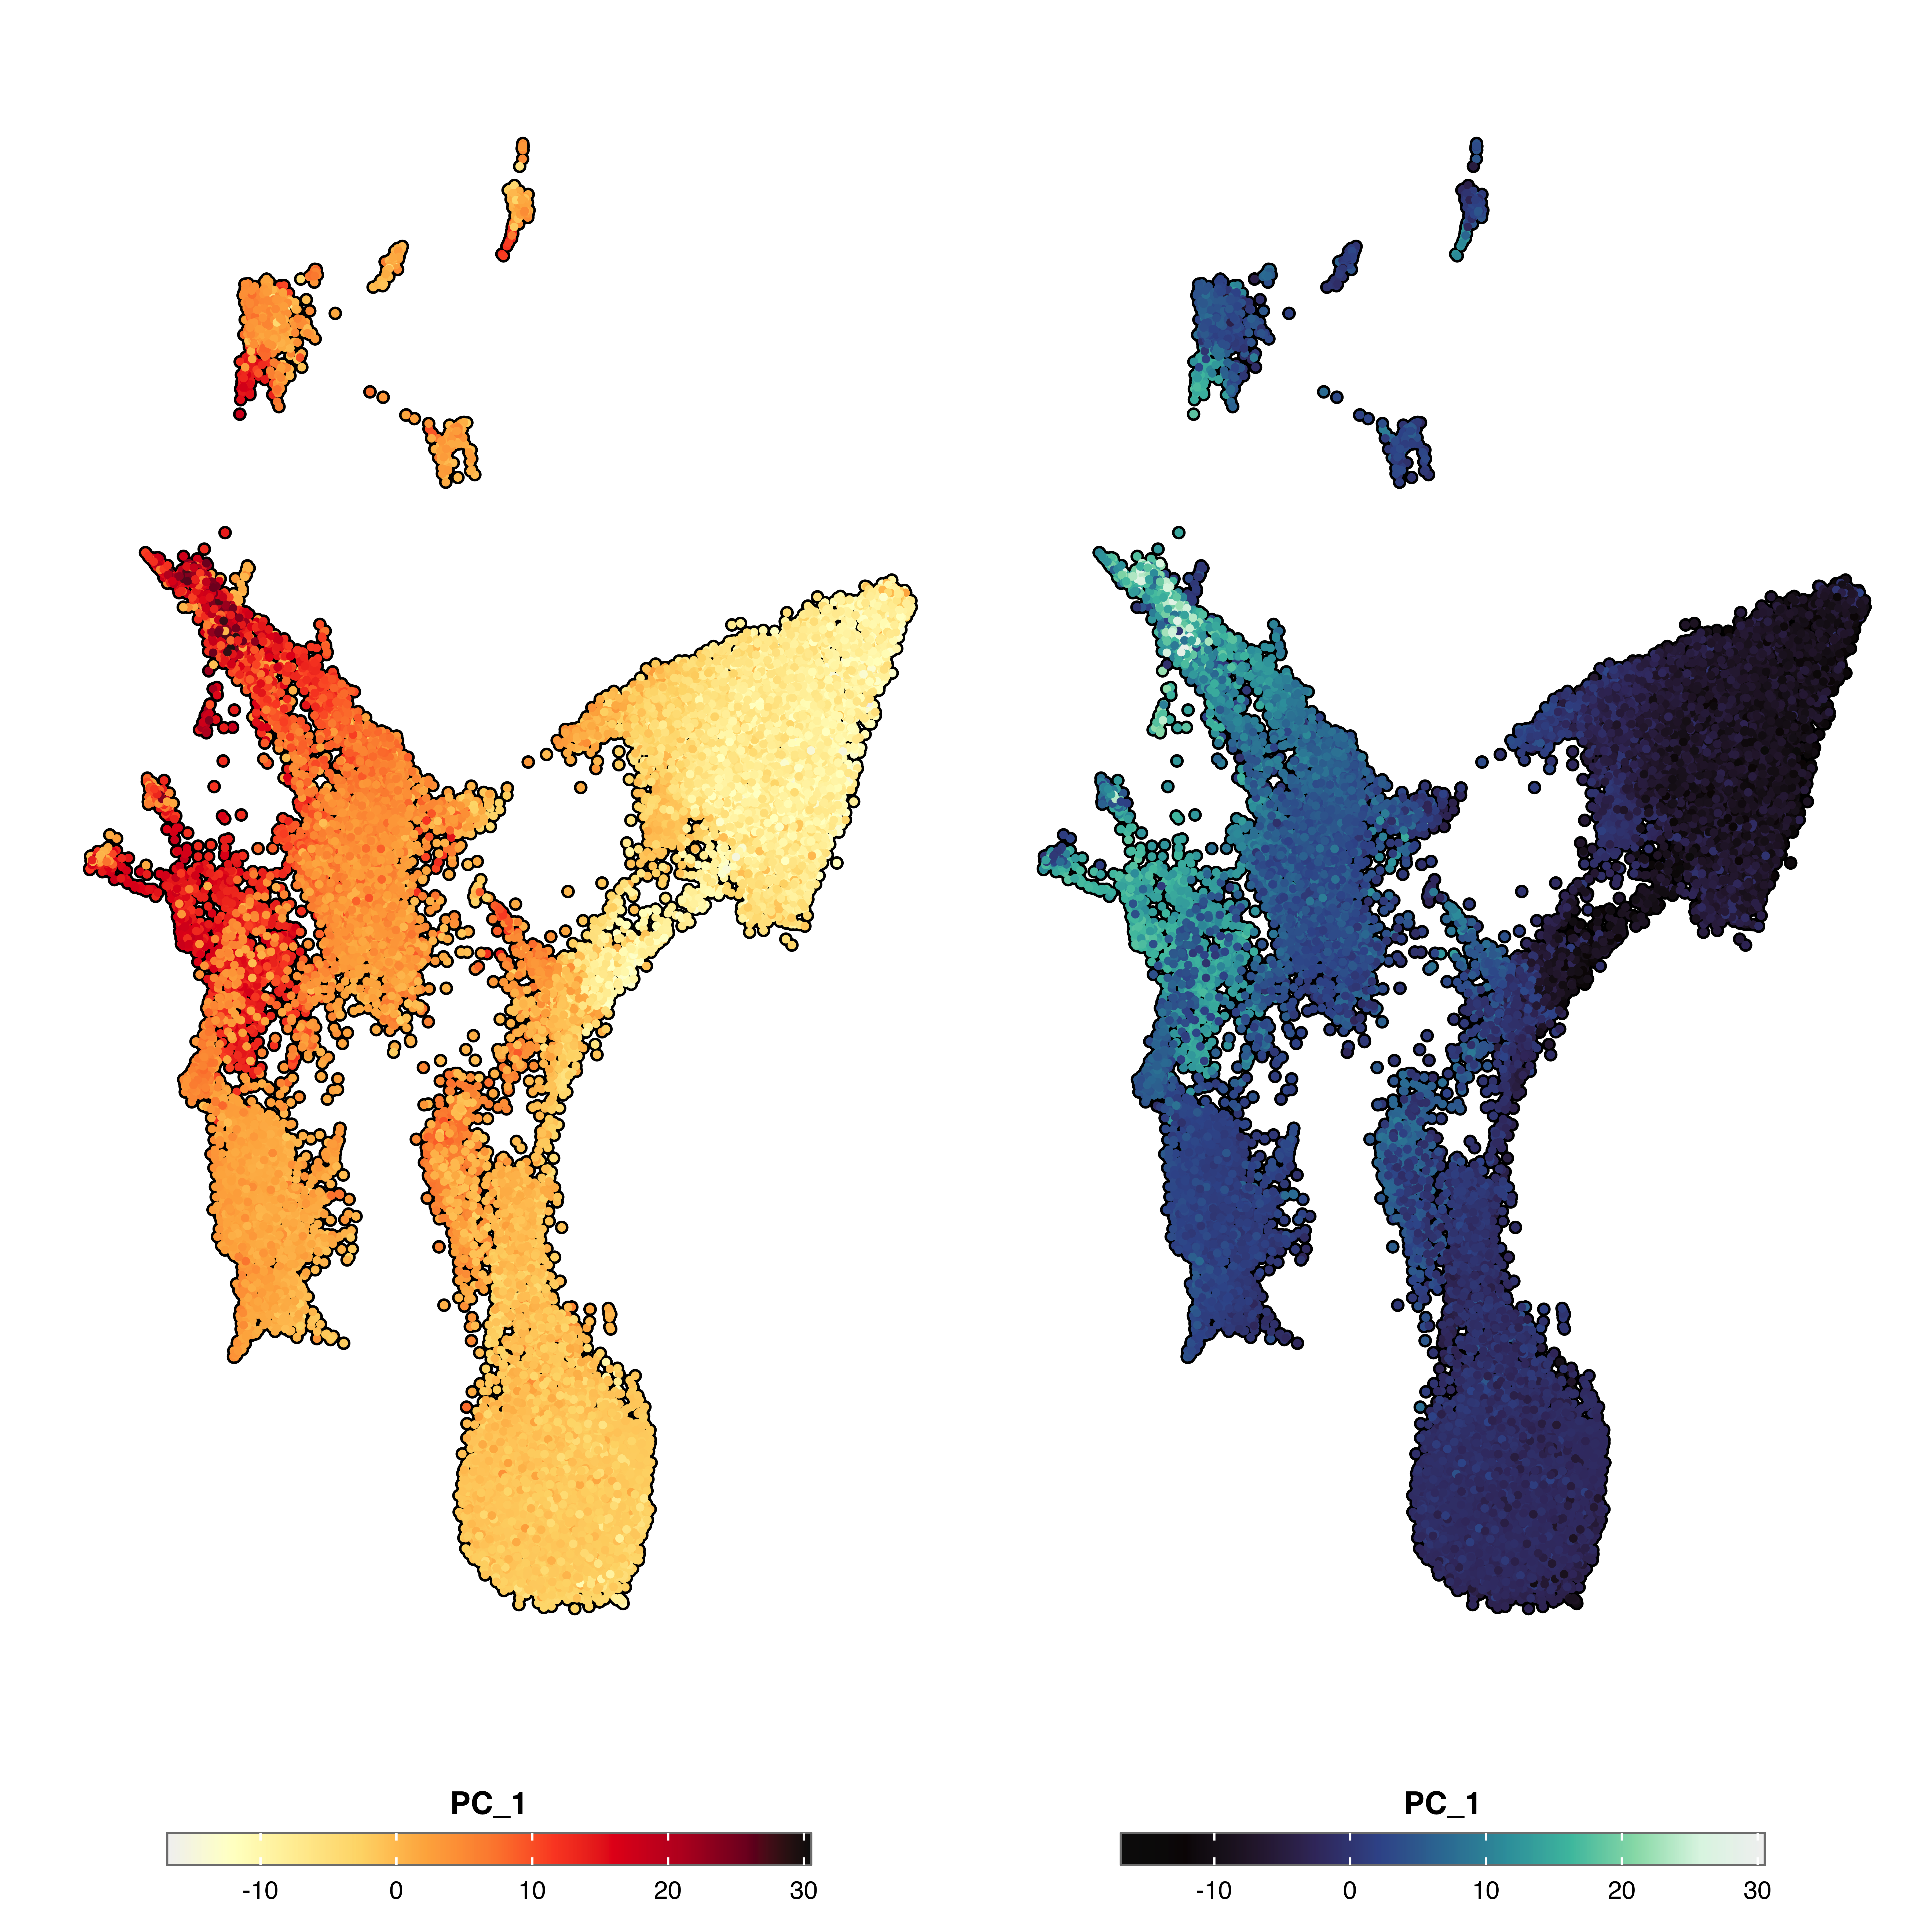
Automatically used when enforce_symmetry = TRUE:
p <- SCpubr::do_FeaturePlot(sample = sample,
                            features = "PC_1",
                            enforce_symmetry = TRUE,
                            diverging.palette = "RdBu",
                            diverging.direction = -1)
p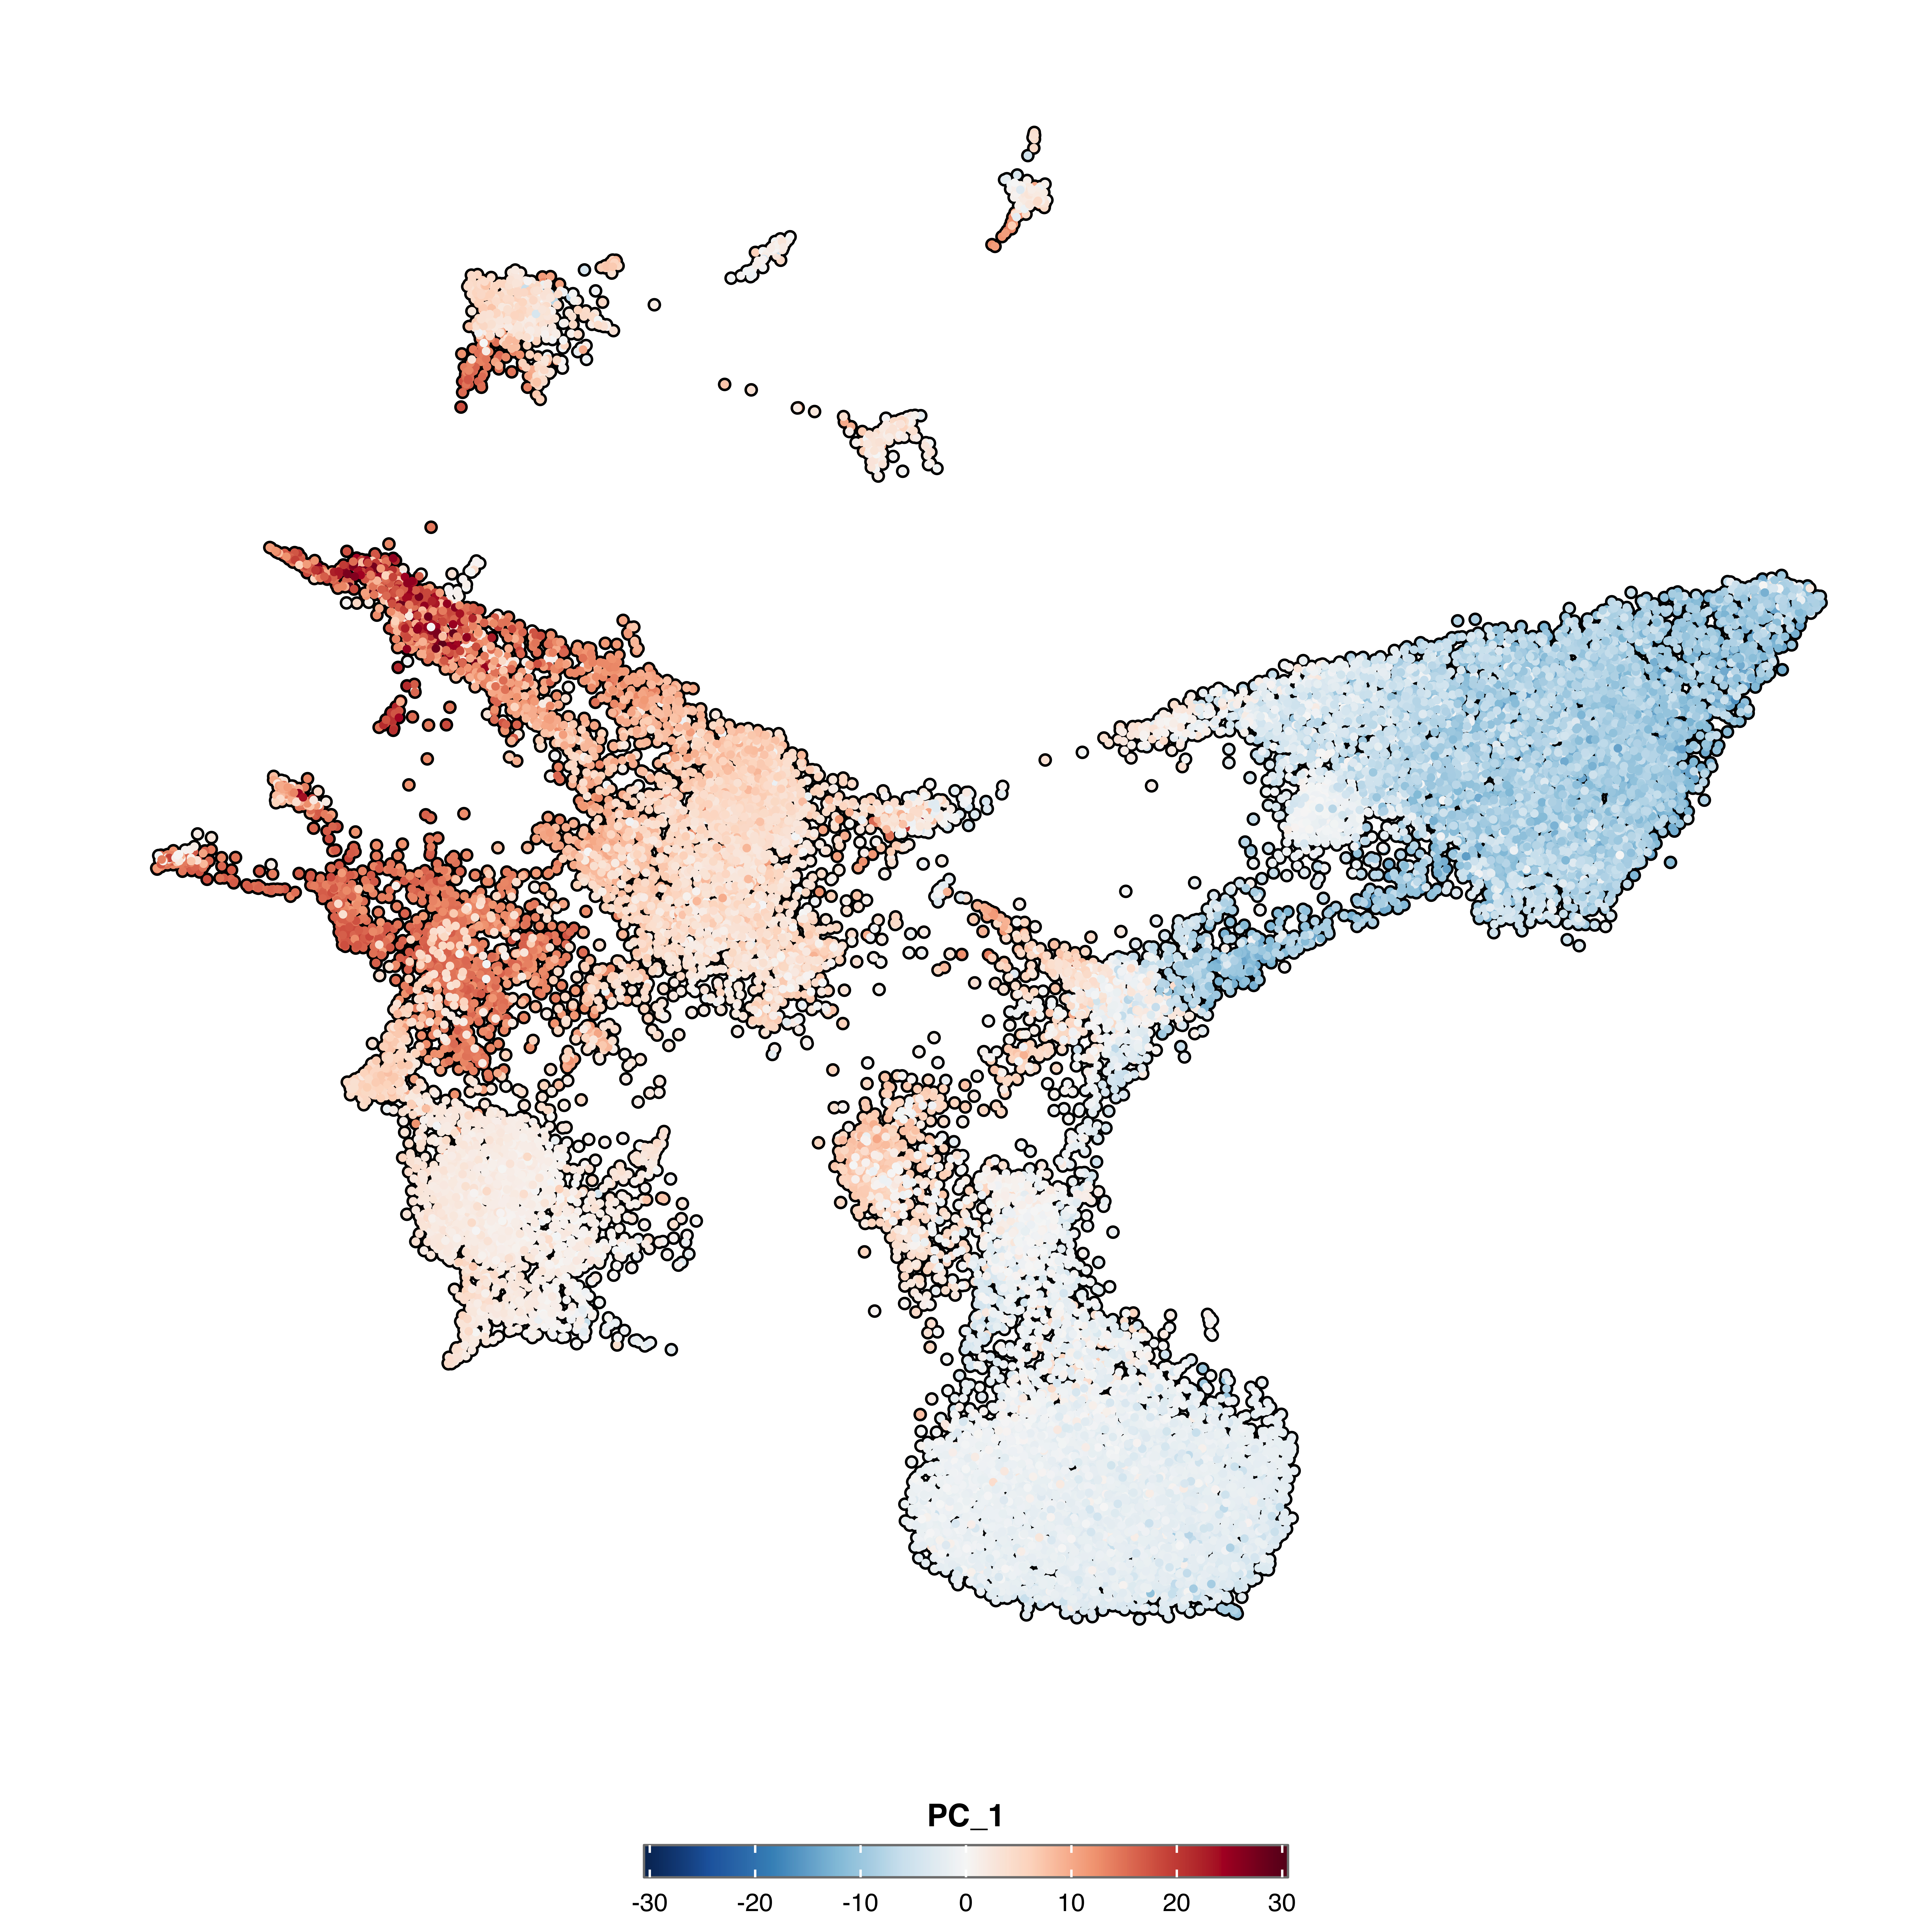
# Highlight by cell barcodes
cells.use <- sample(colnames(sample), 500)
p1 <- SCpubr::do_FeaturePlot(sample = sample,
                            features = "PC_1",
                            cells.highlight = cells.use)

# Highlight by identity
p2 <- SCpubr::do_FeaturePlot(sample = sample,
                            features = "PC_1",
                            idents.highlight = c("IPC-like"))

p1 | p2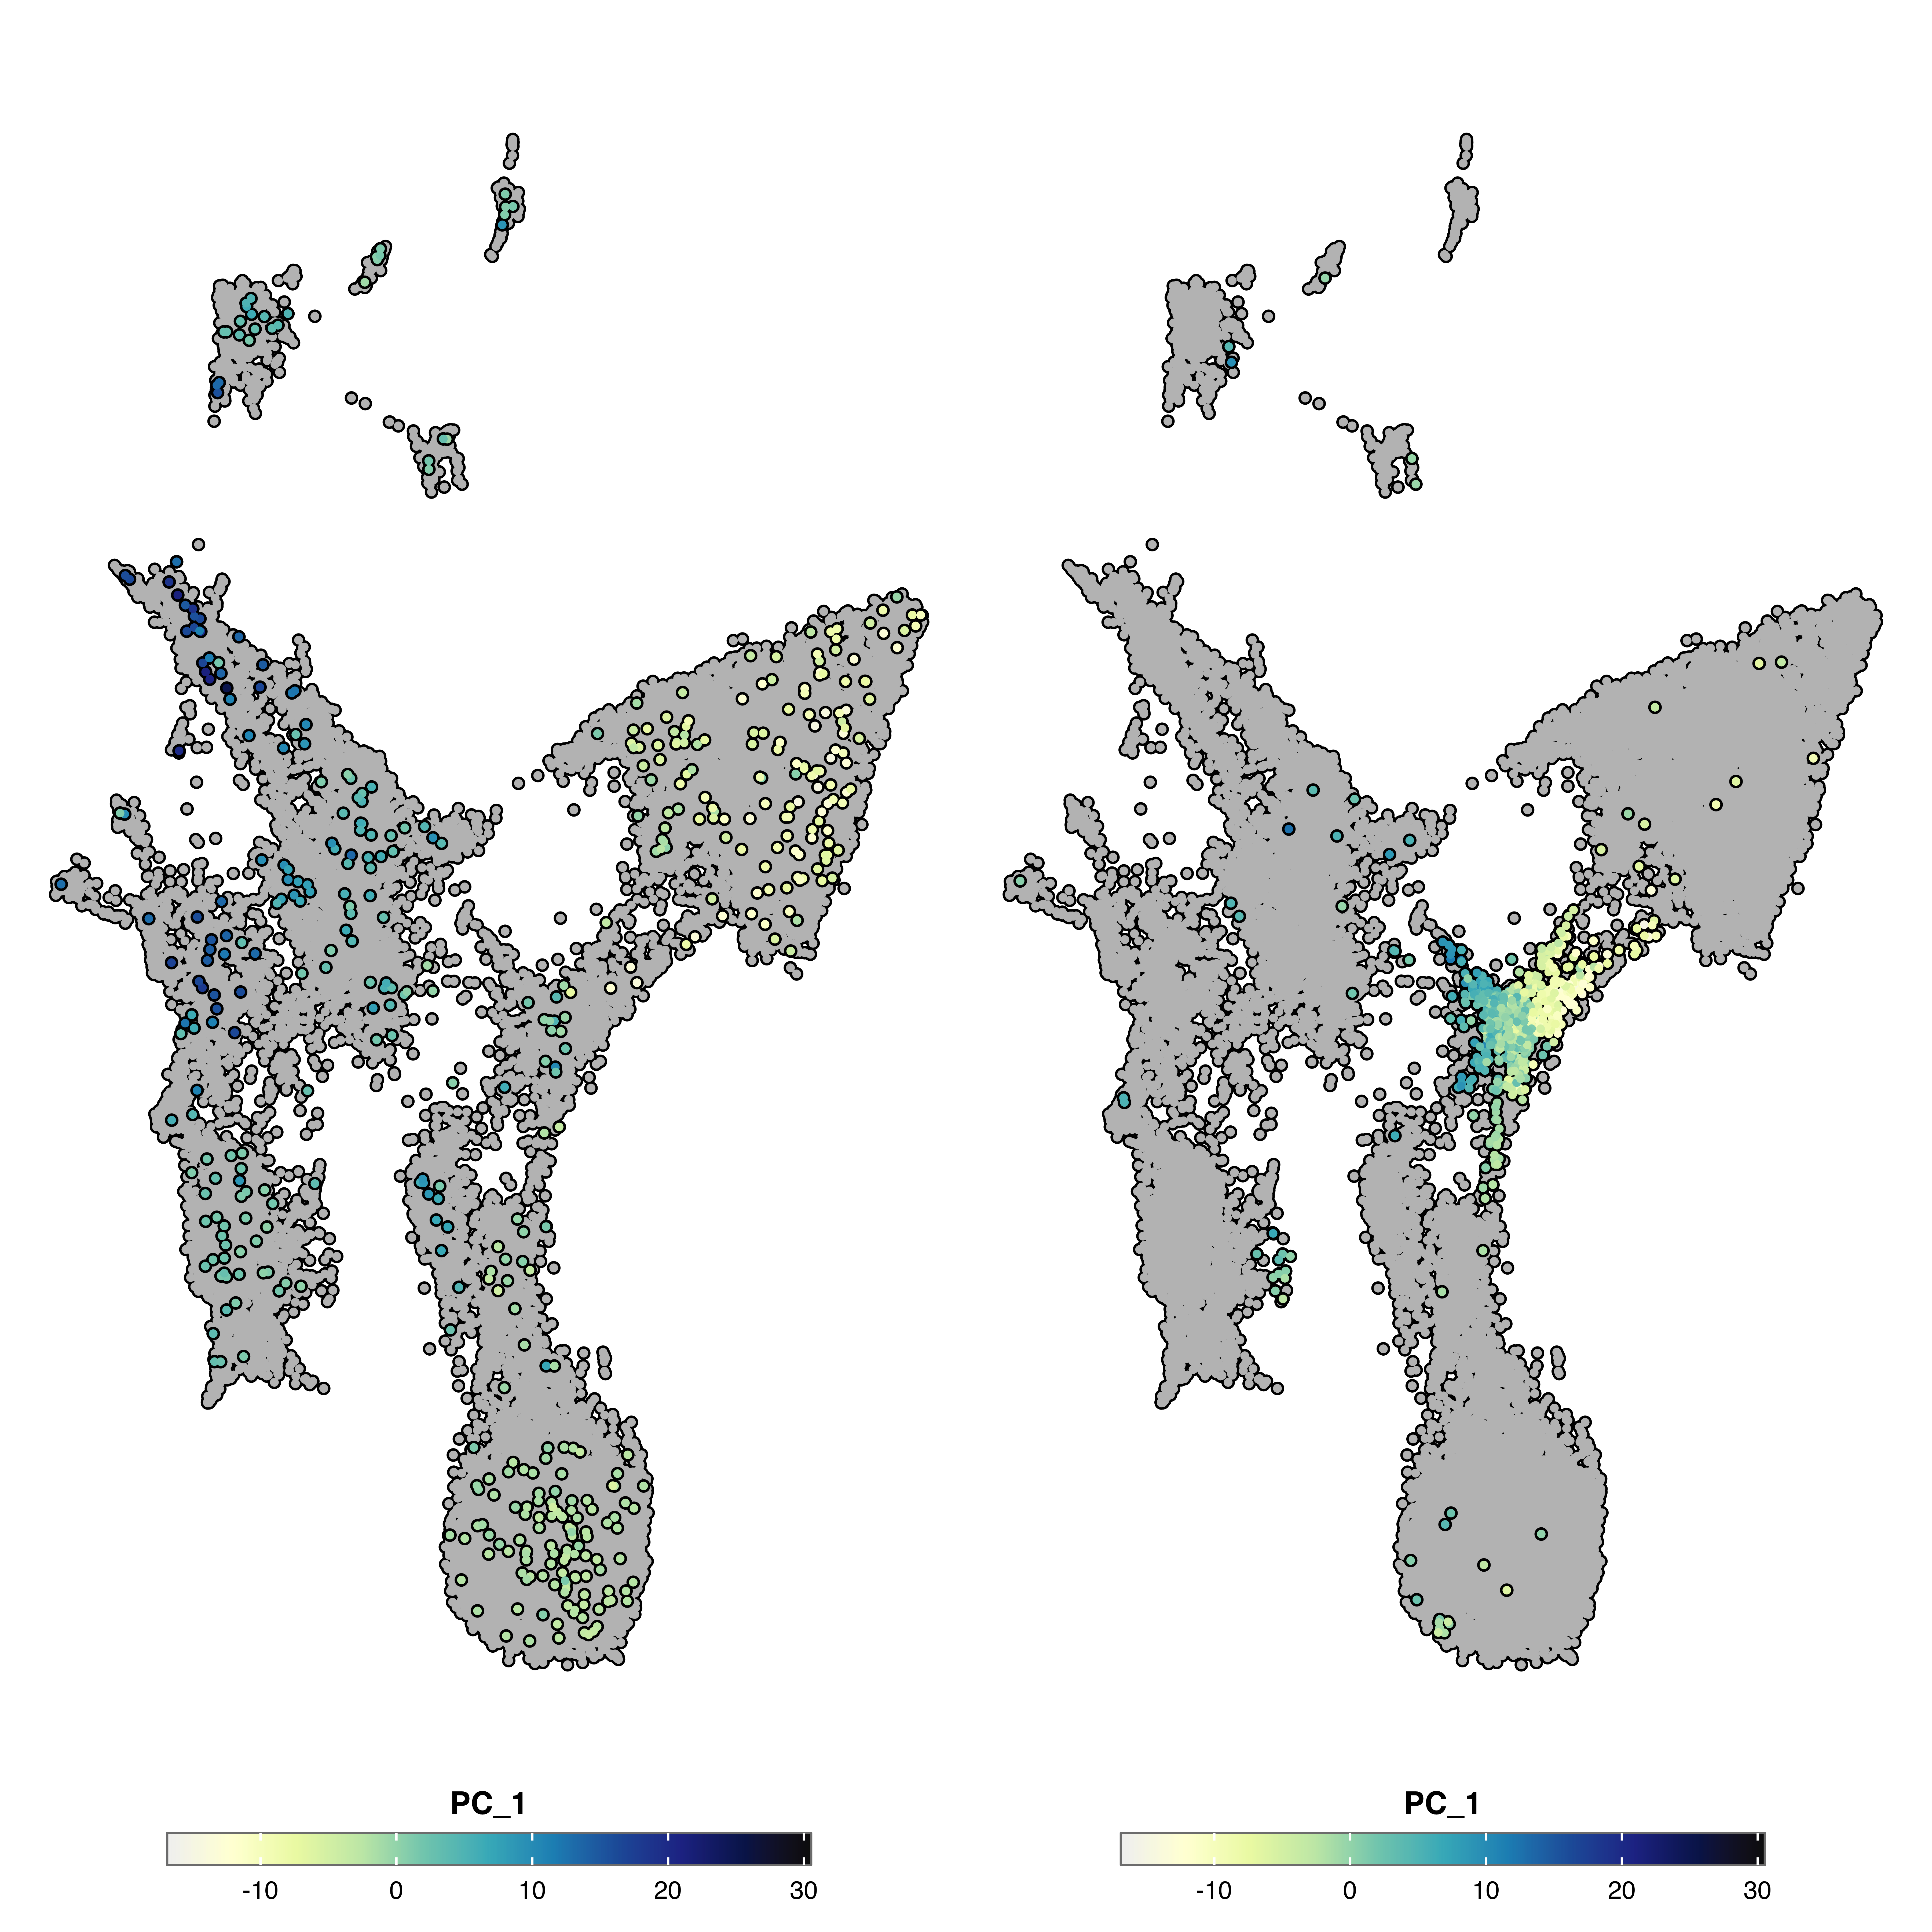
Create faceted plots:
p <- SCpubr::do_FeaturePlot(sample = sample,
                            features = "PC_1",
                            split.by = "subtype")
p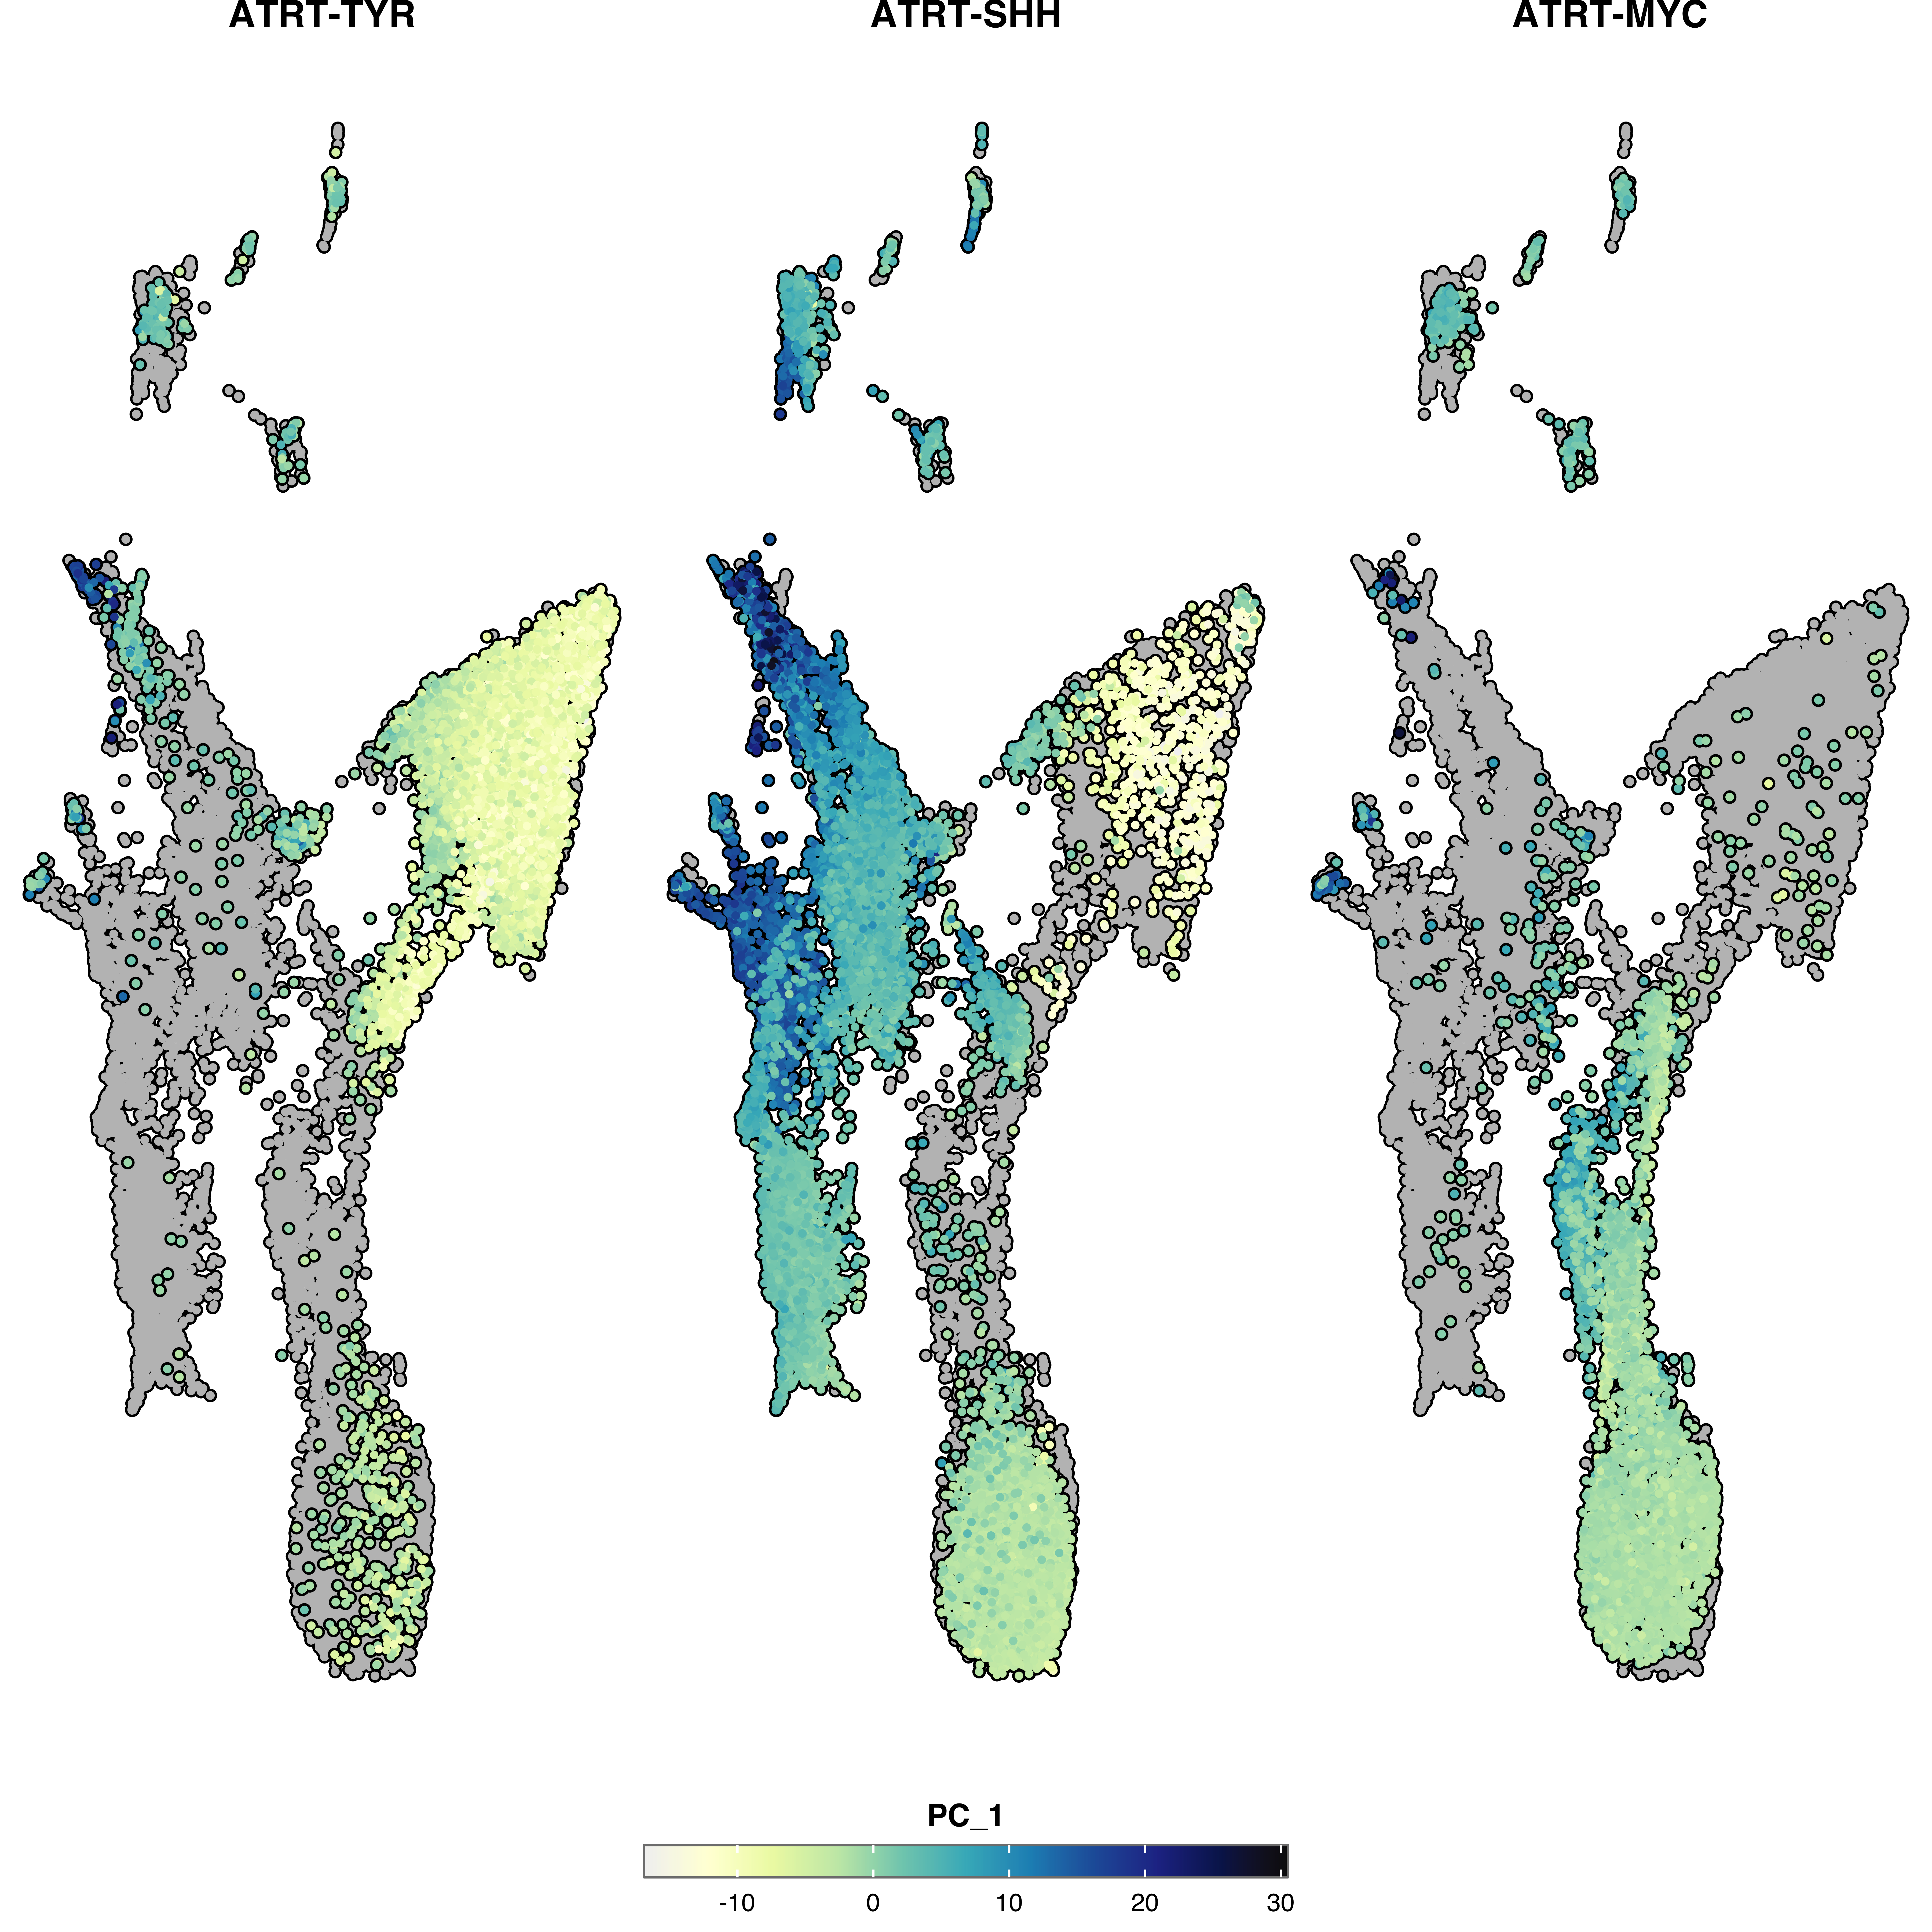
Display categorical group information alongside continuous values:
Add dots at cluster centers:
p <- SCpubr::do_FeaturePlot(sample = sample,
                            features = "PC_1",
                            group.by = "Annotation")
p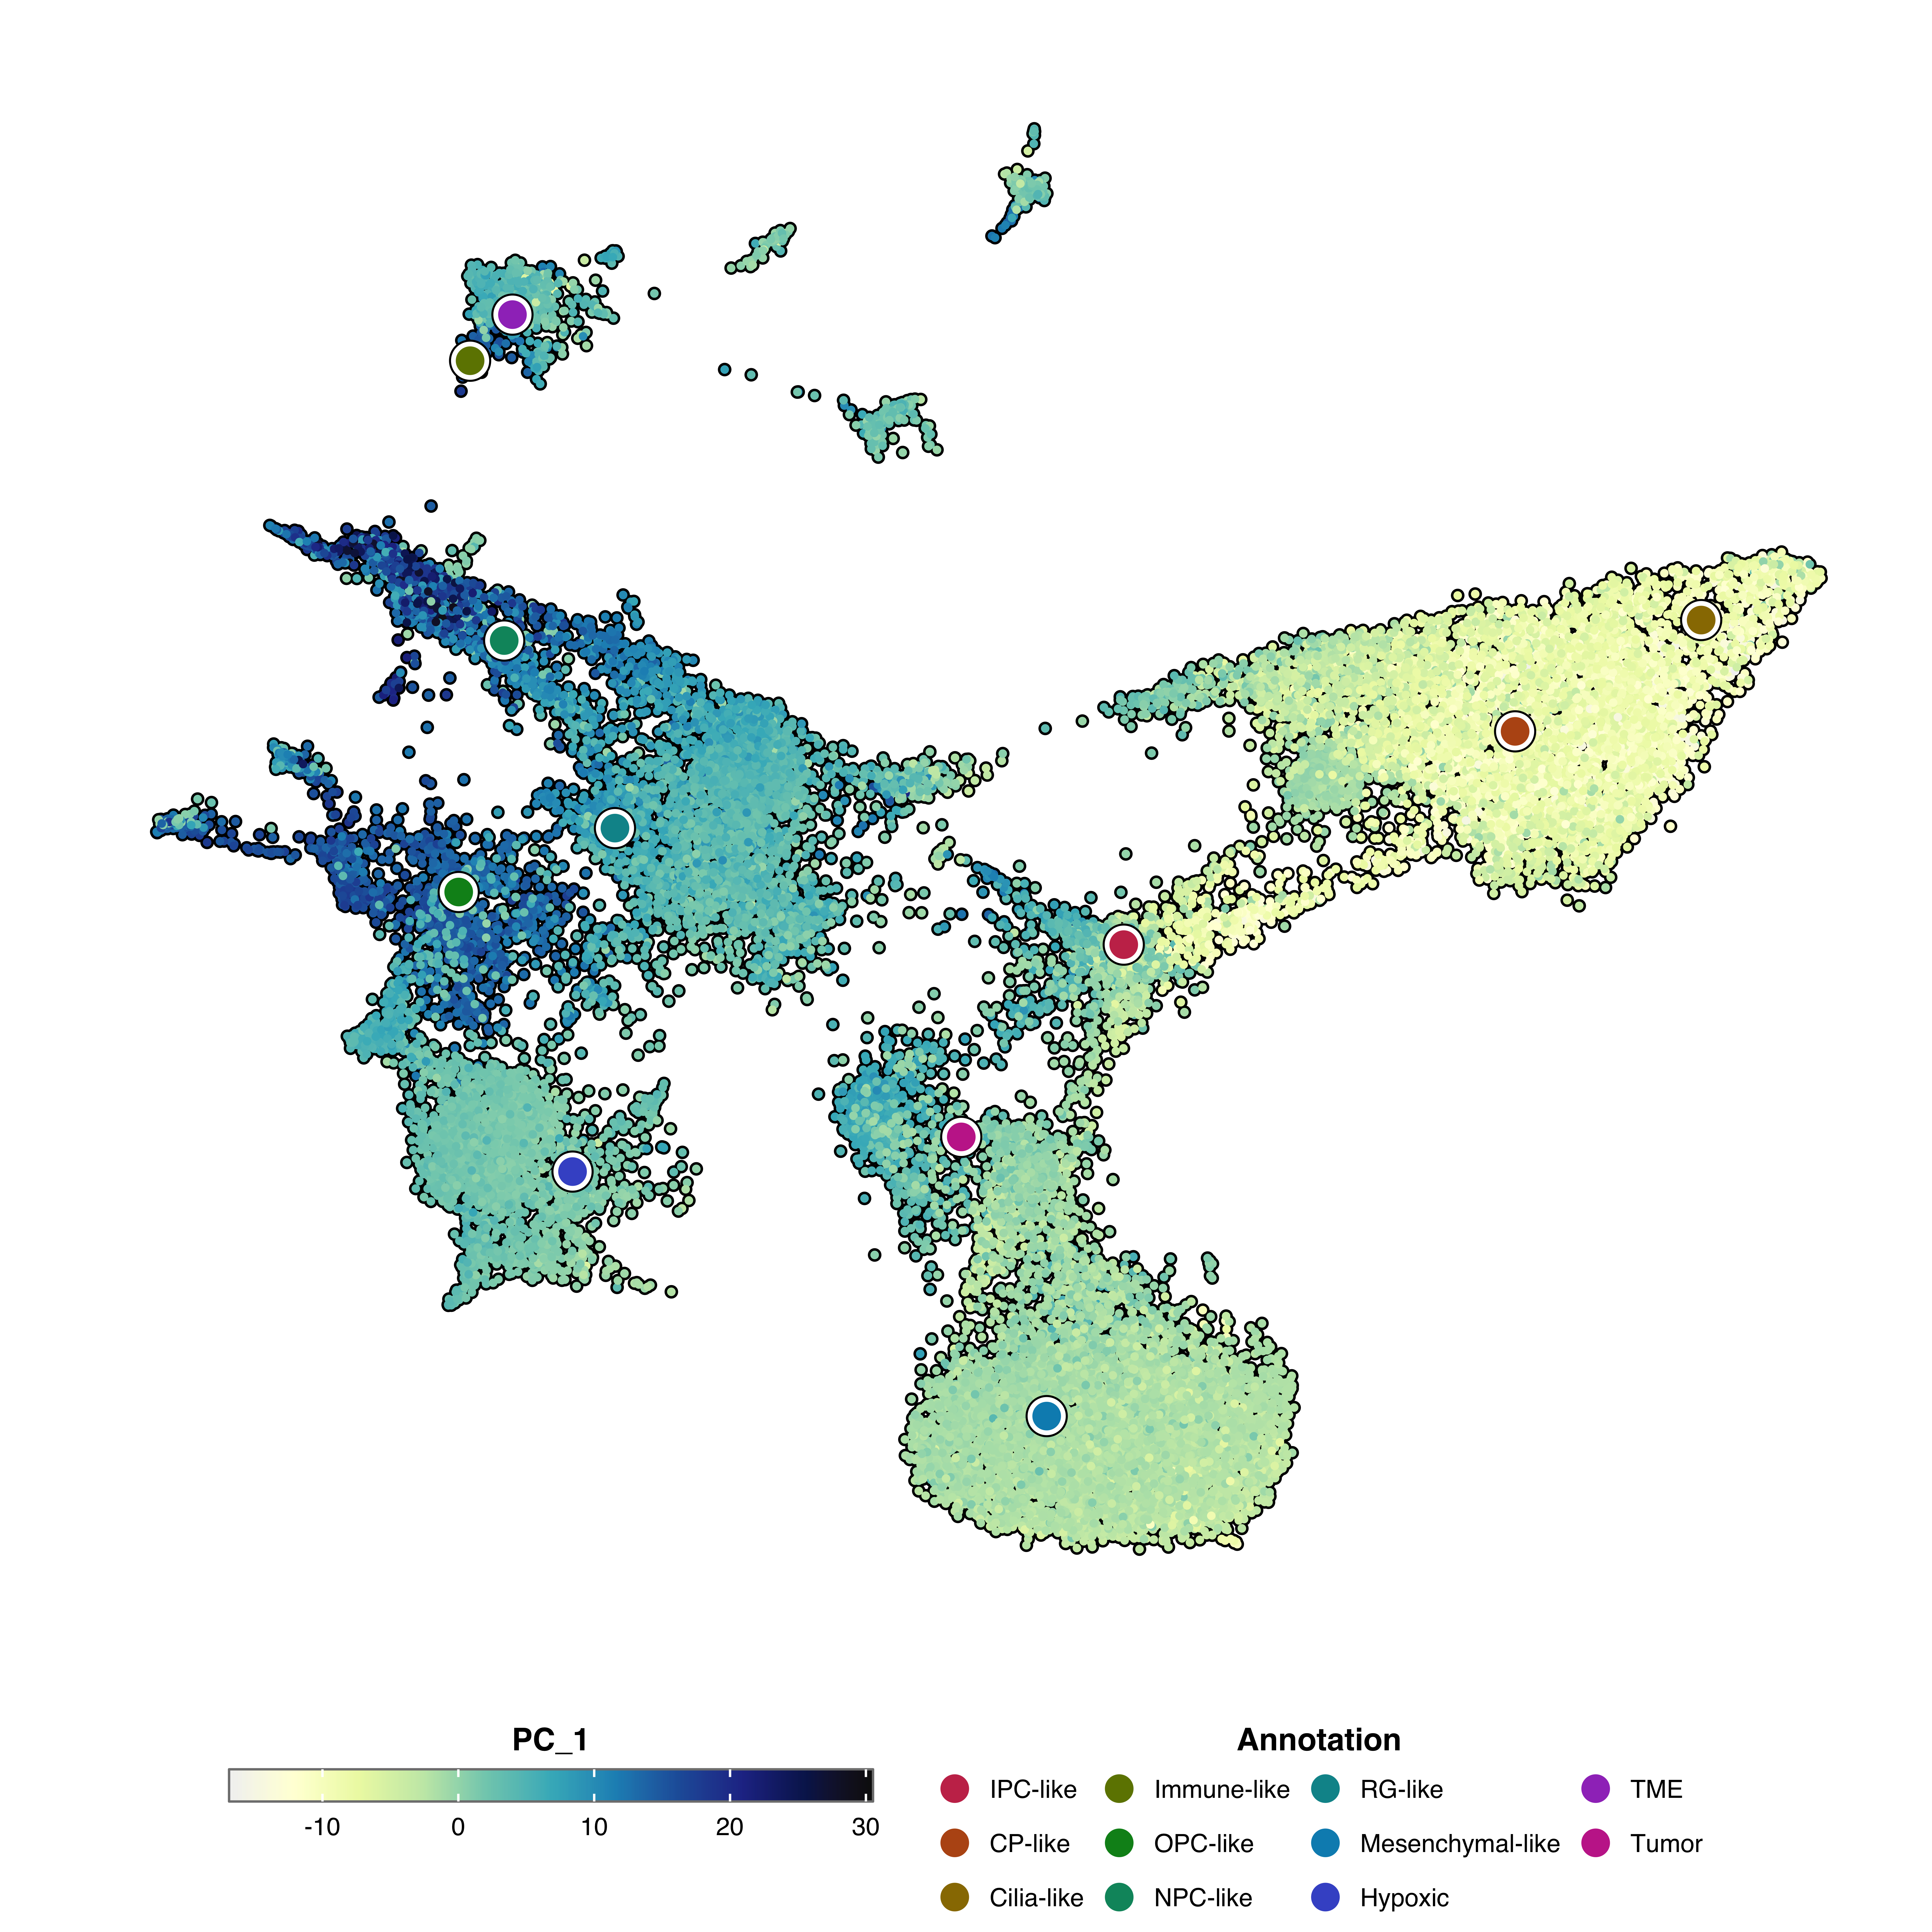
Add a colored shadow around cells showing group membership:
p <- SCpubr::do_FeaturePlot(sample = sample,
                            features = "PC_1",
                            group.by = "Annotation",
                            group.by.cell_borders = TRUE,
                            group.by.cell_borders.alpha = 0.1)
p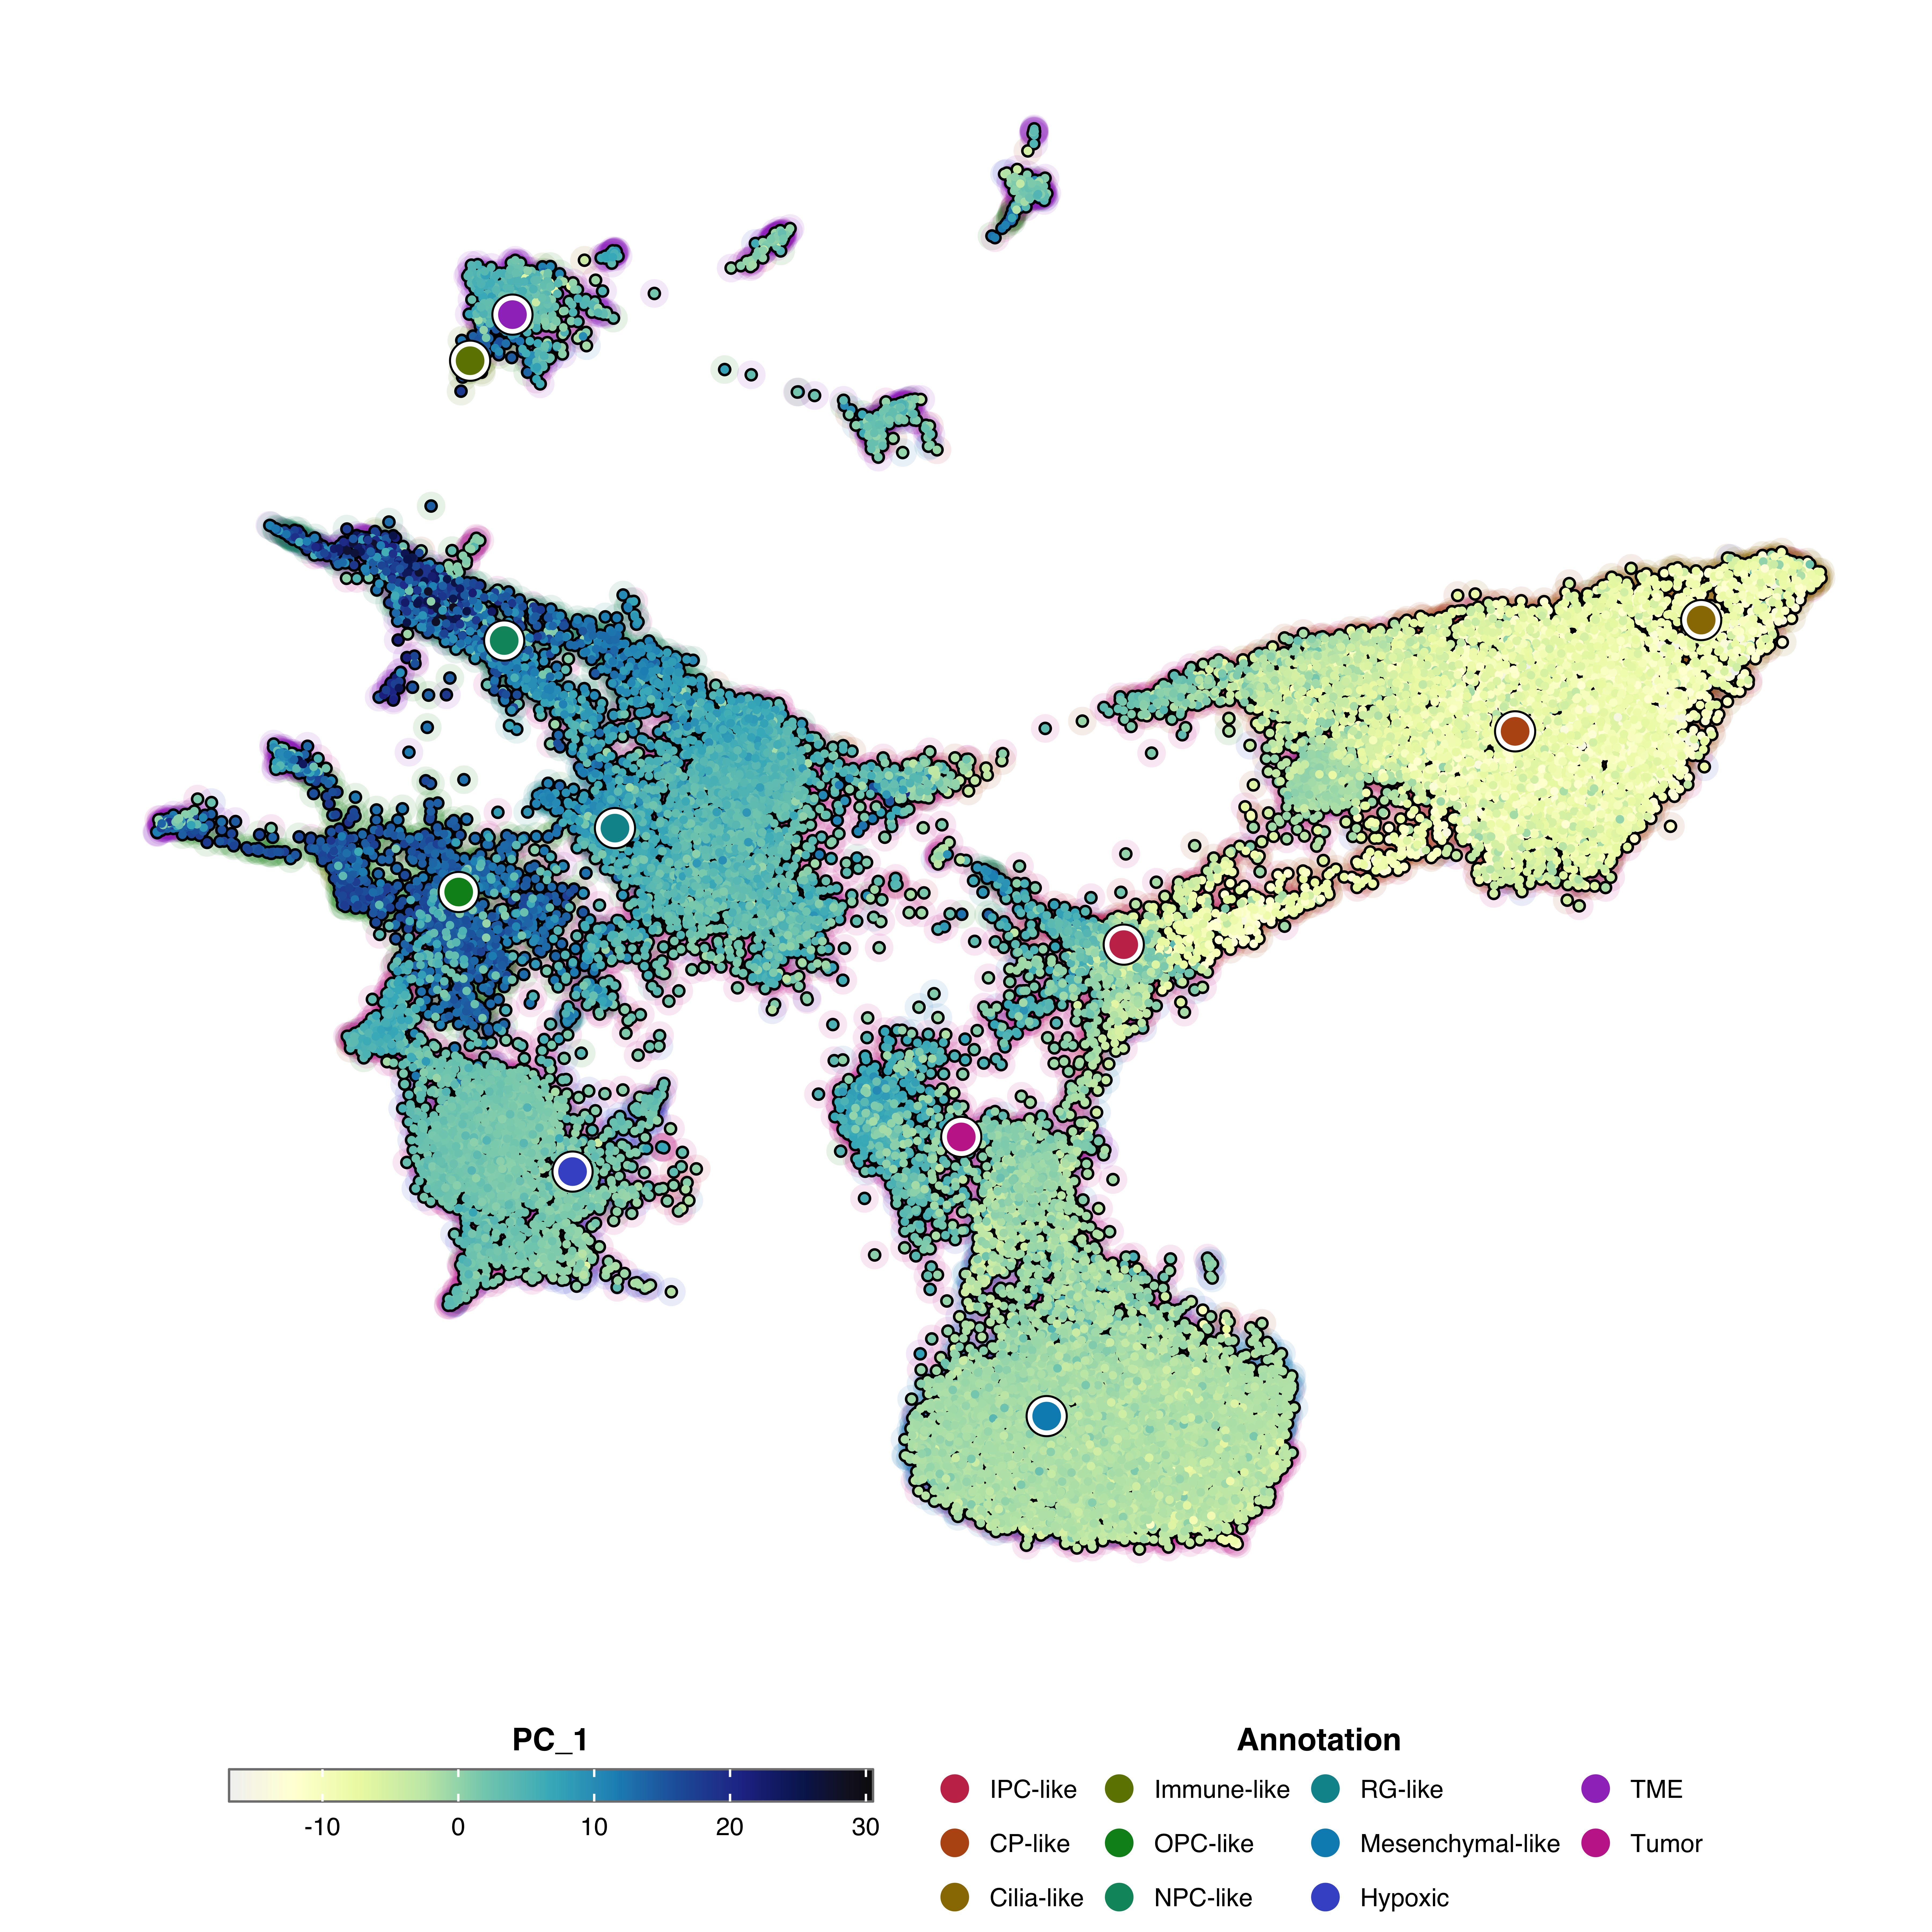
Add identity labels to the plot:
p <- SCpubr::do_FeaturePlot(sample = sample,
                            features = "PC_1",
                            label = TRUE,
                            label.color = "black",
                            label.size = 4)
p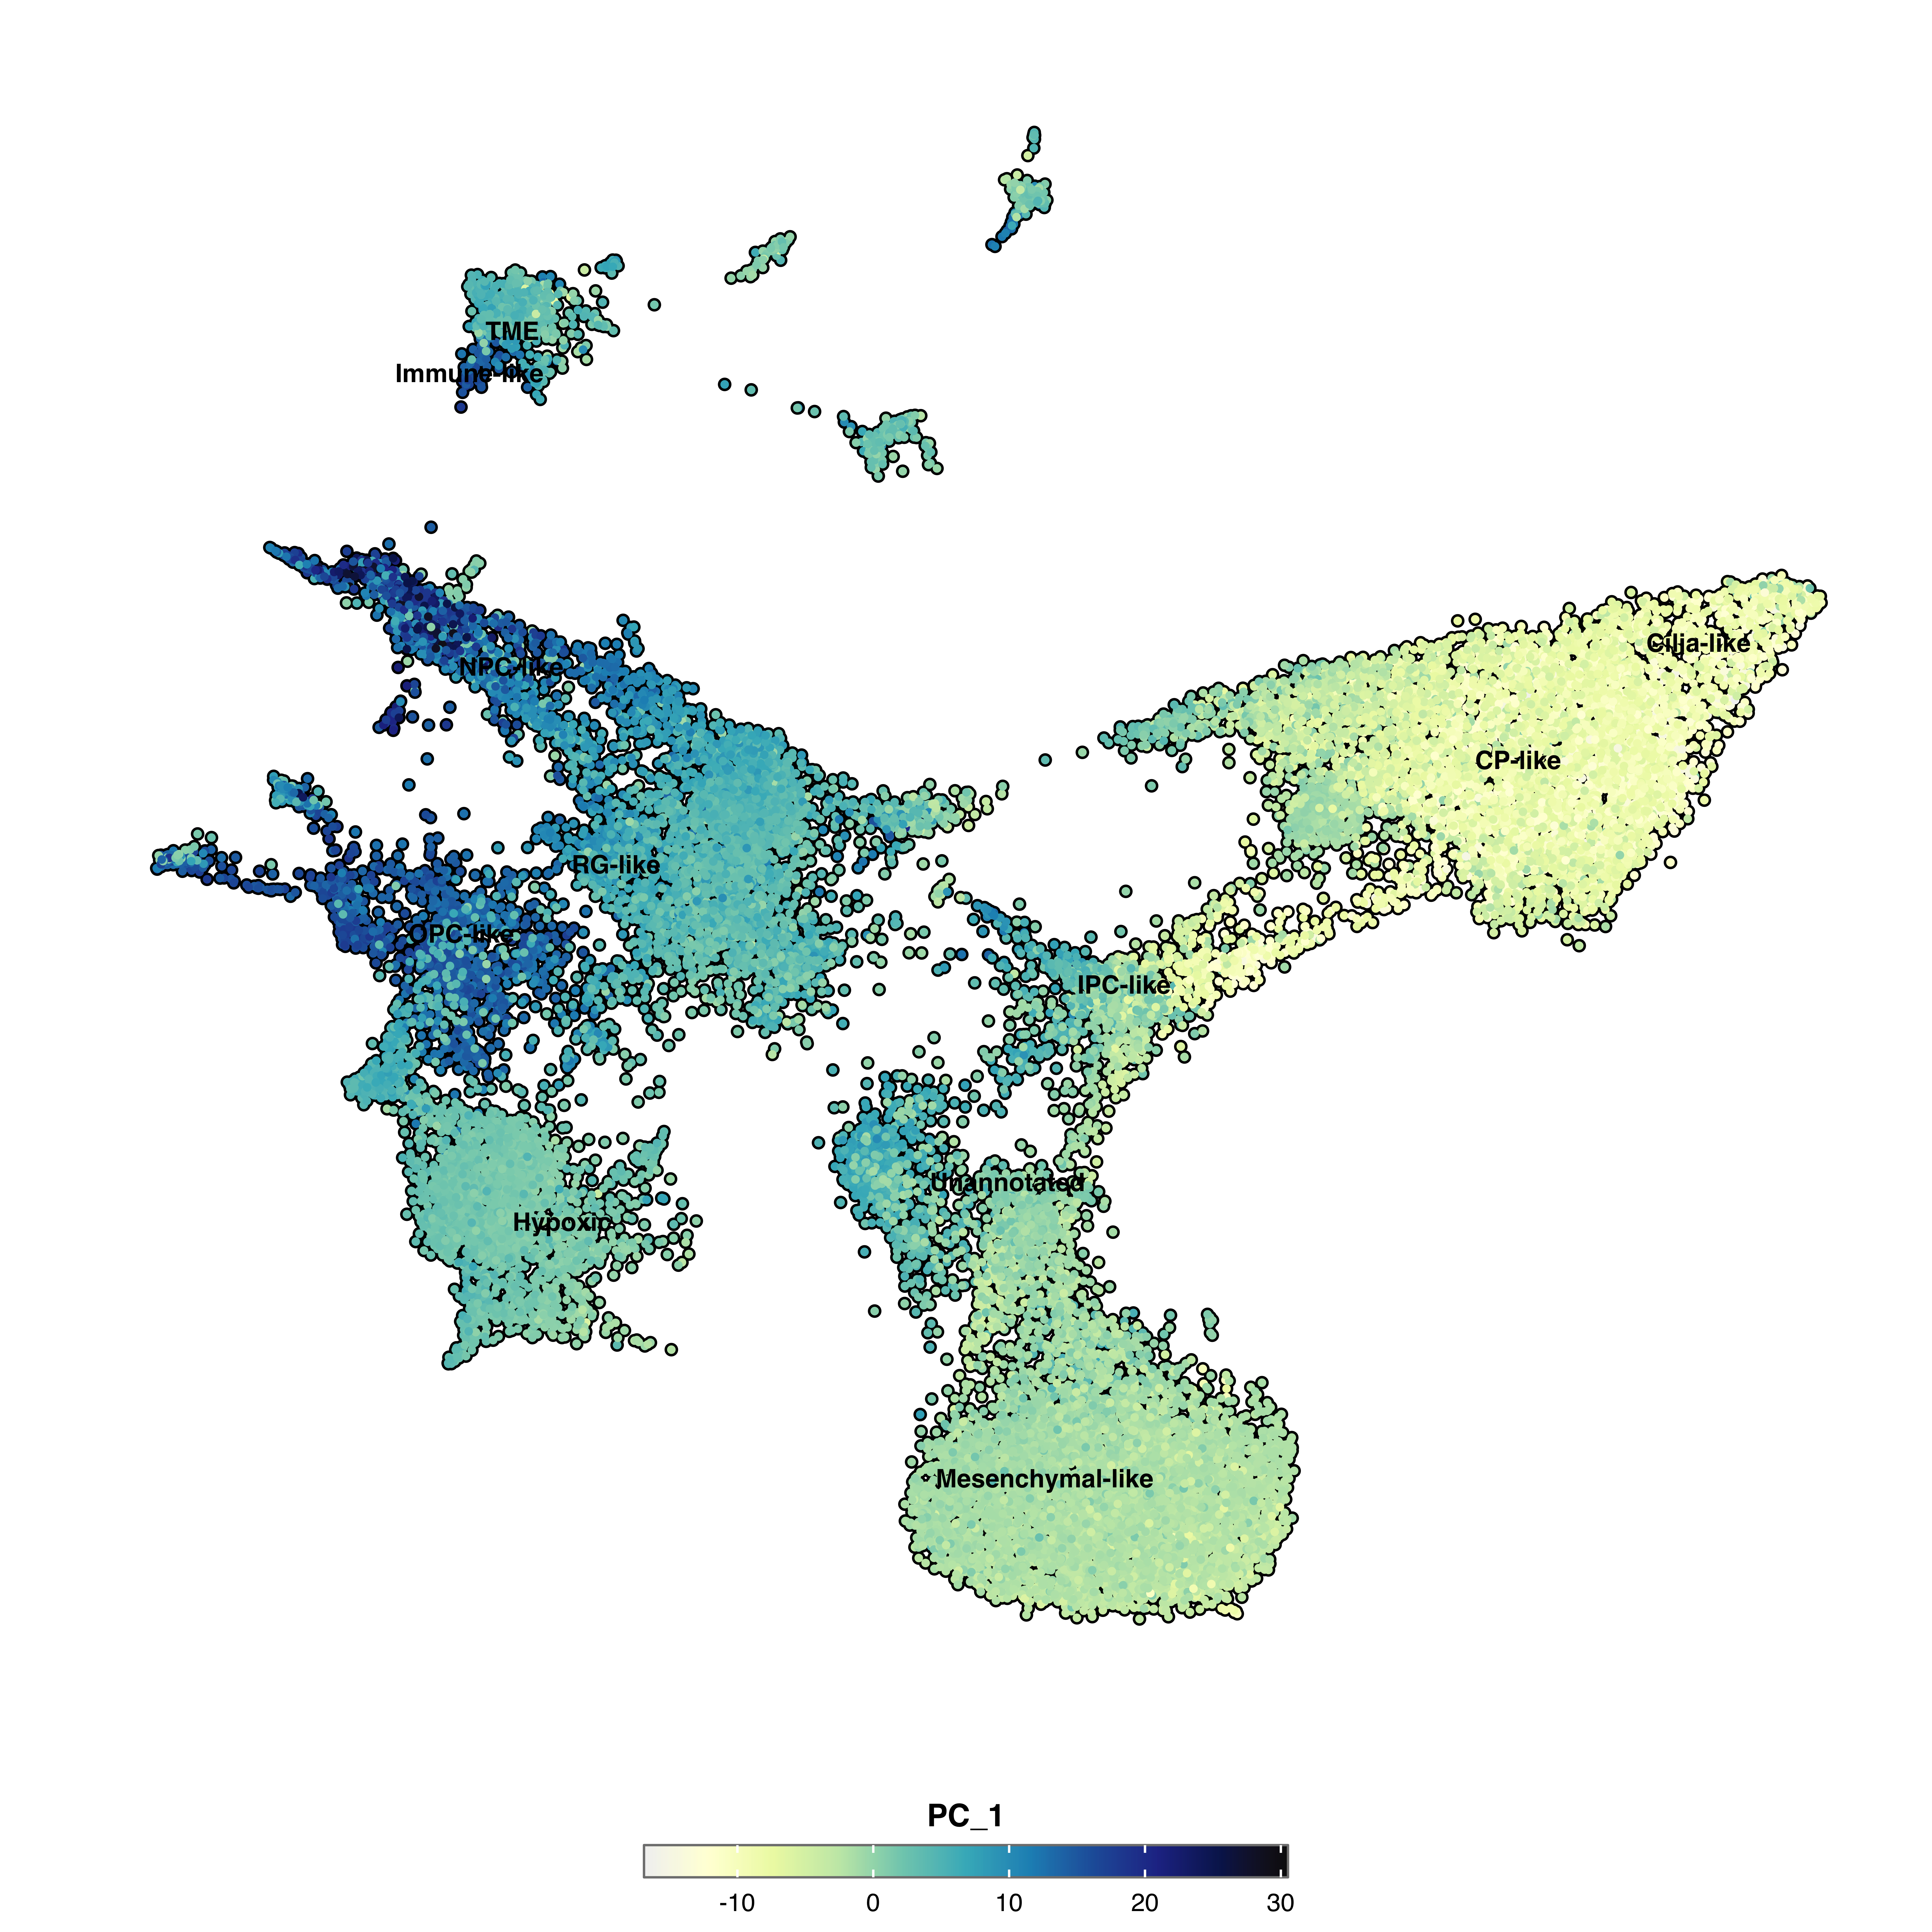
p <- SCpubr::do_FeaturePlot(sample = sample,
                            features = "PC_1",
                            plot_density_contour = TRUE,
                            contour.color = "grey50",
                            contour.position = "bottom")
p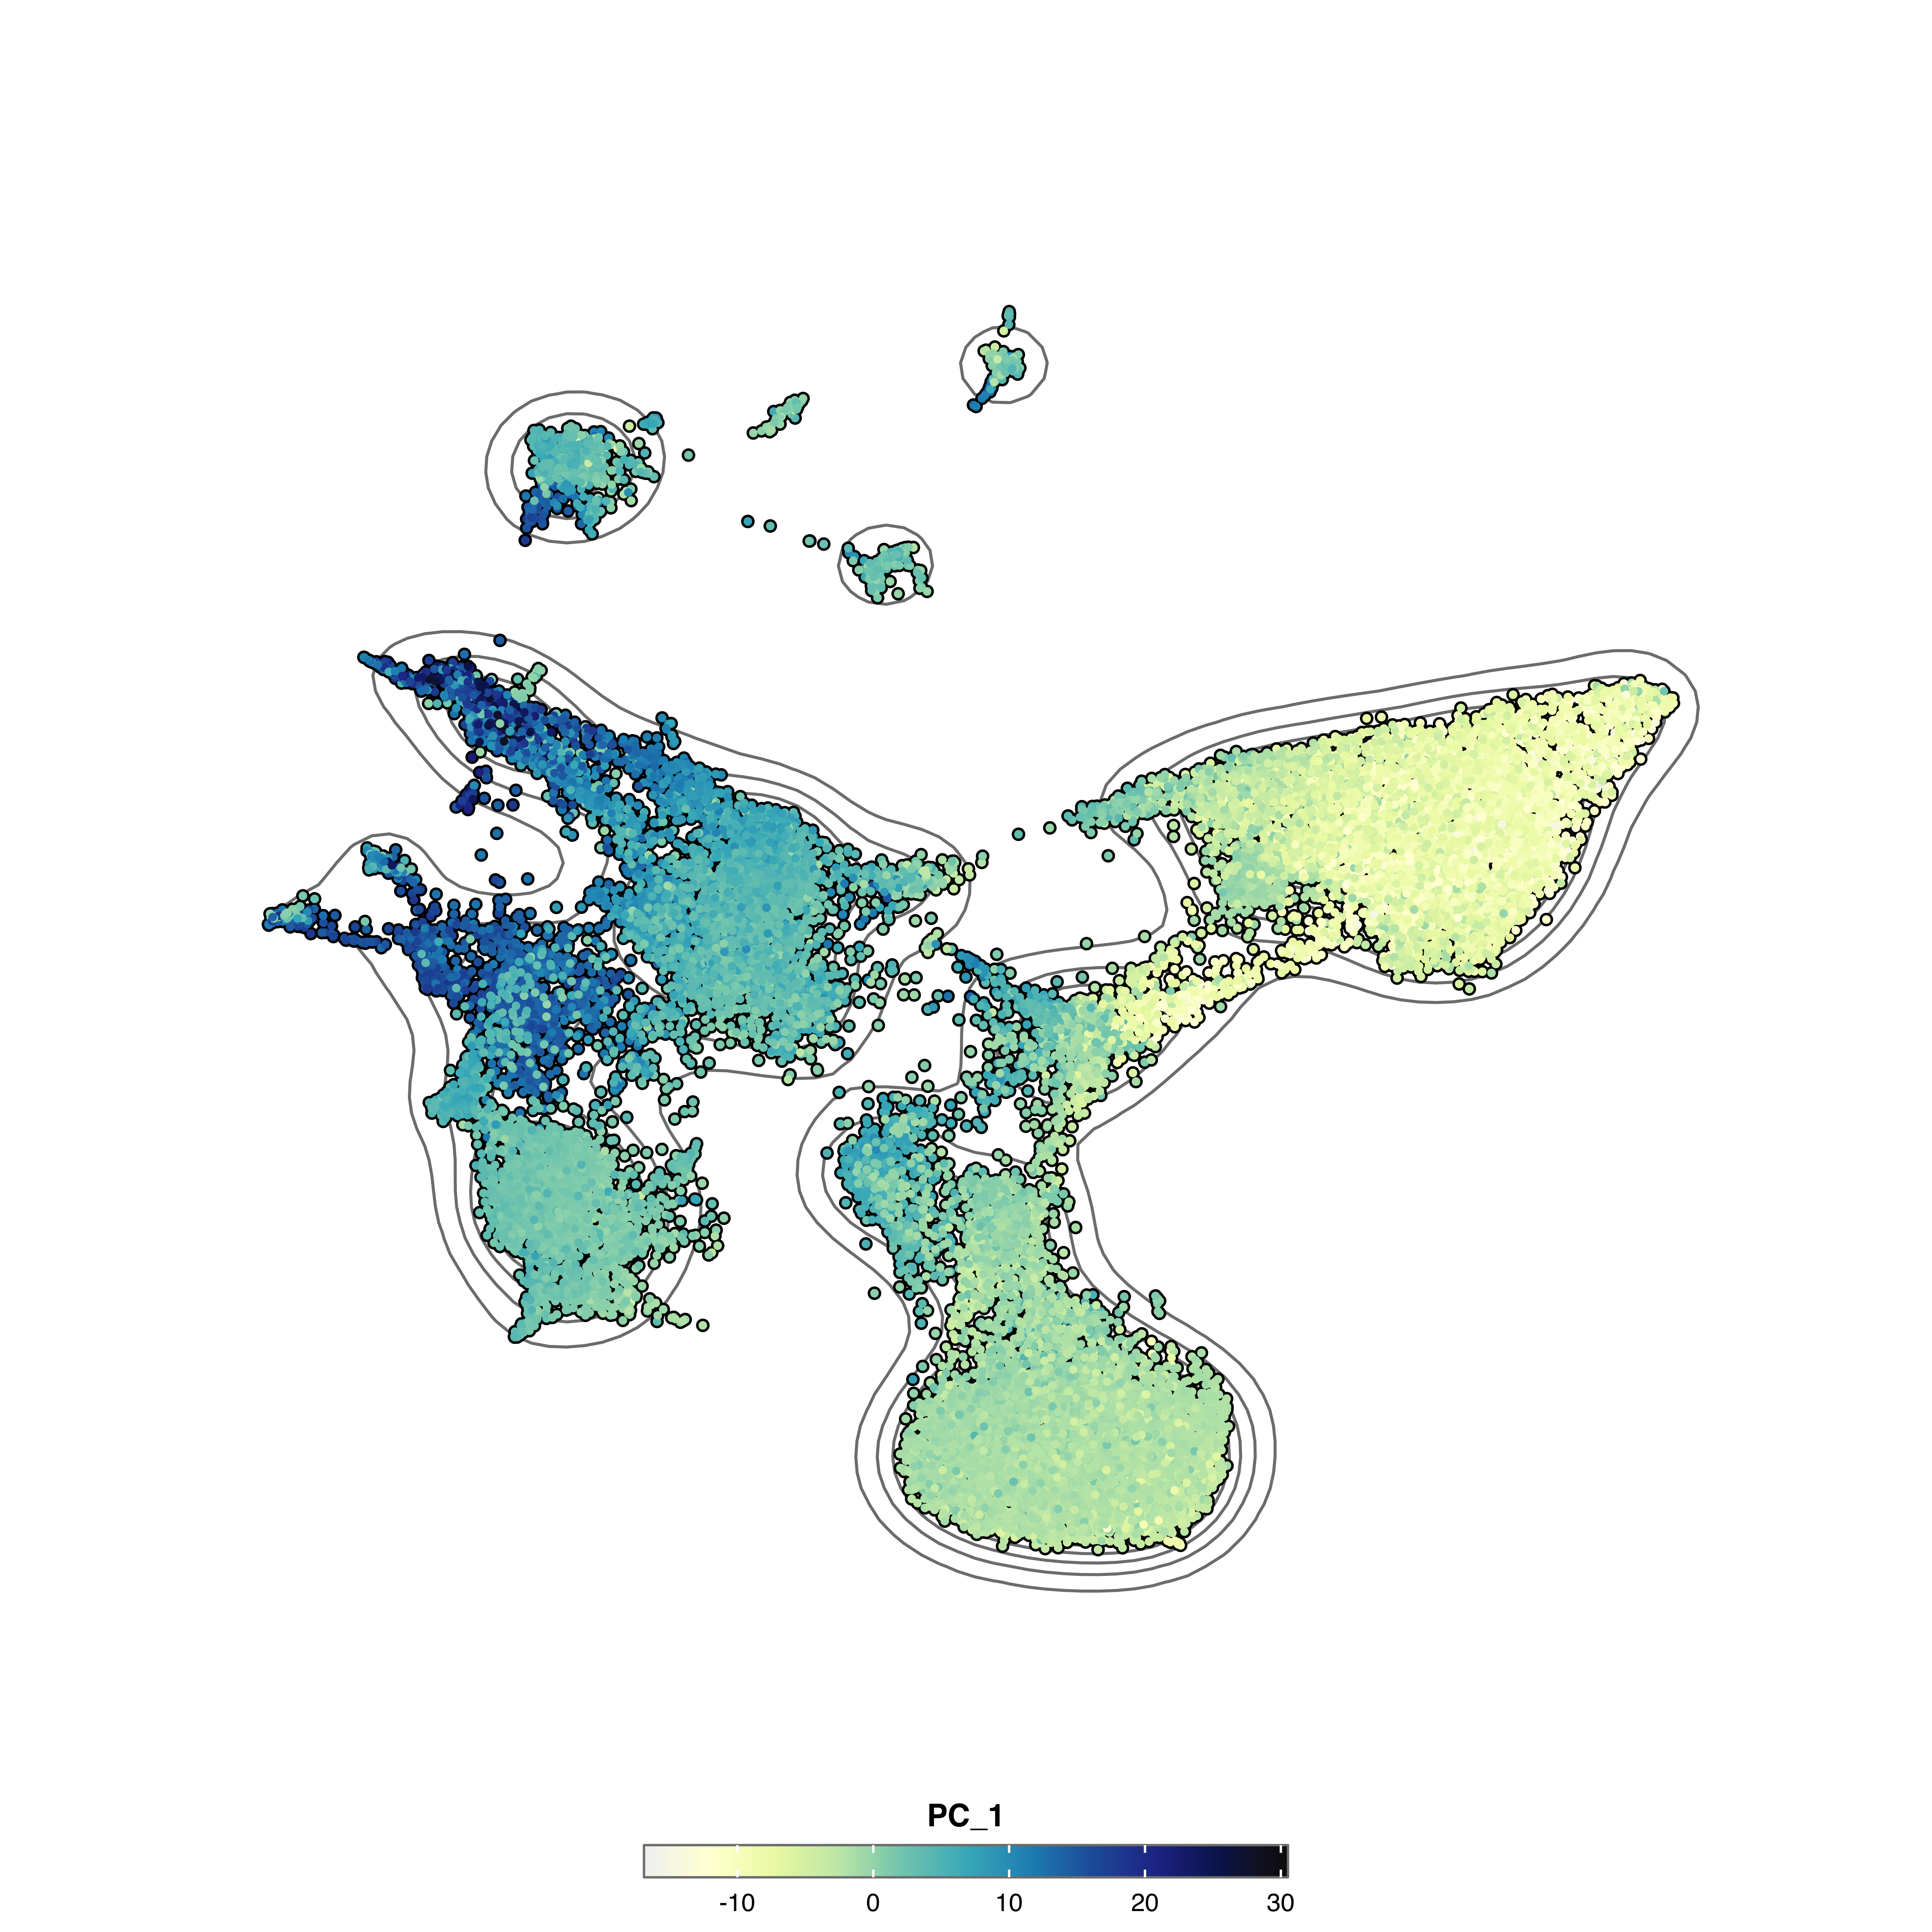
Plot cells with higher expression on top:
p <- SCpubr::do_FeaturePlot(sample = sample,
                            features = "KIF14",
                            order = TRUE)
p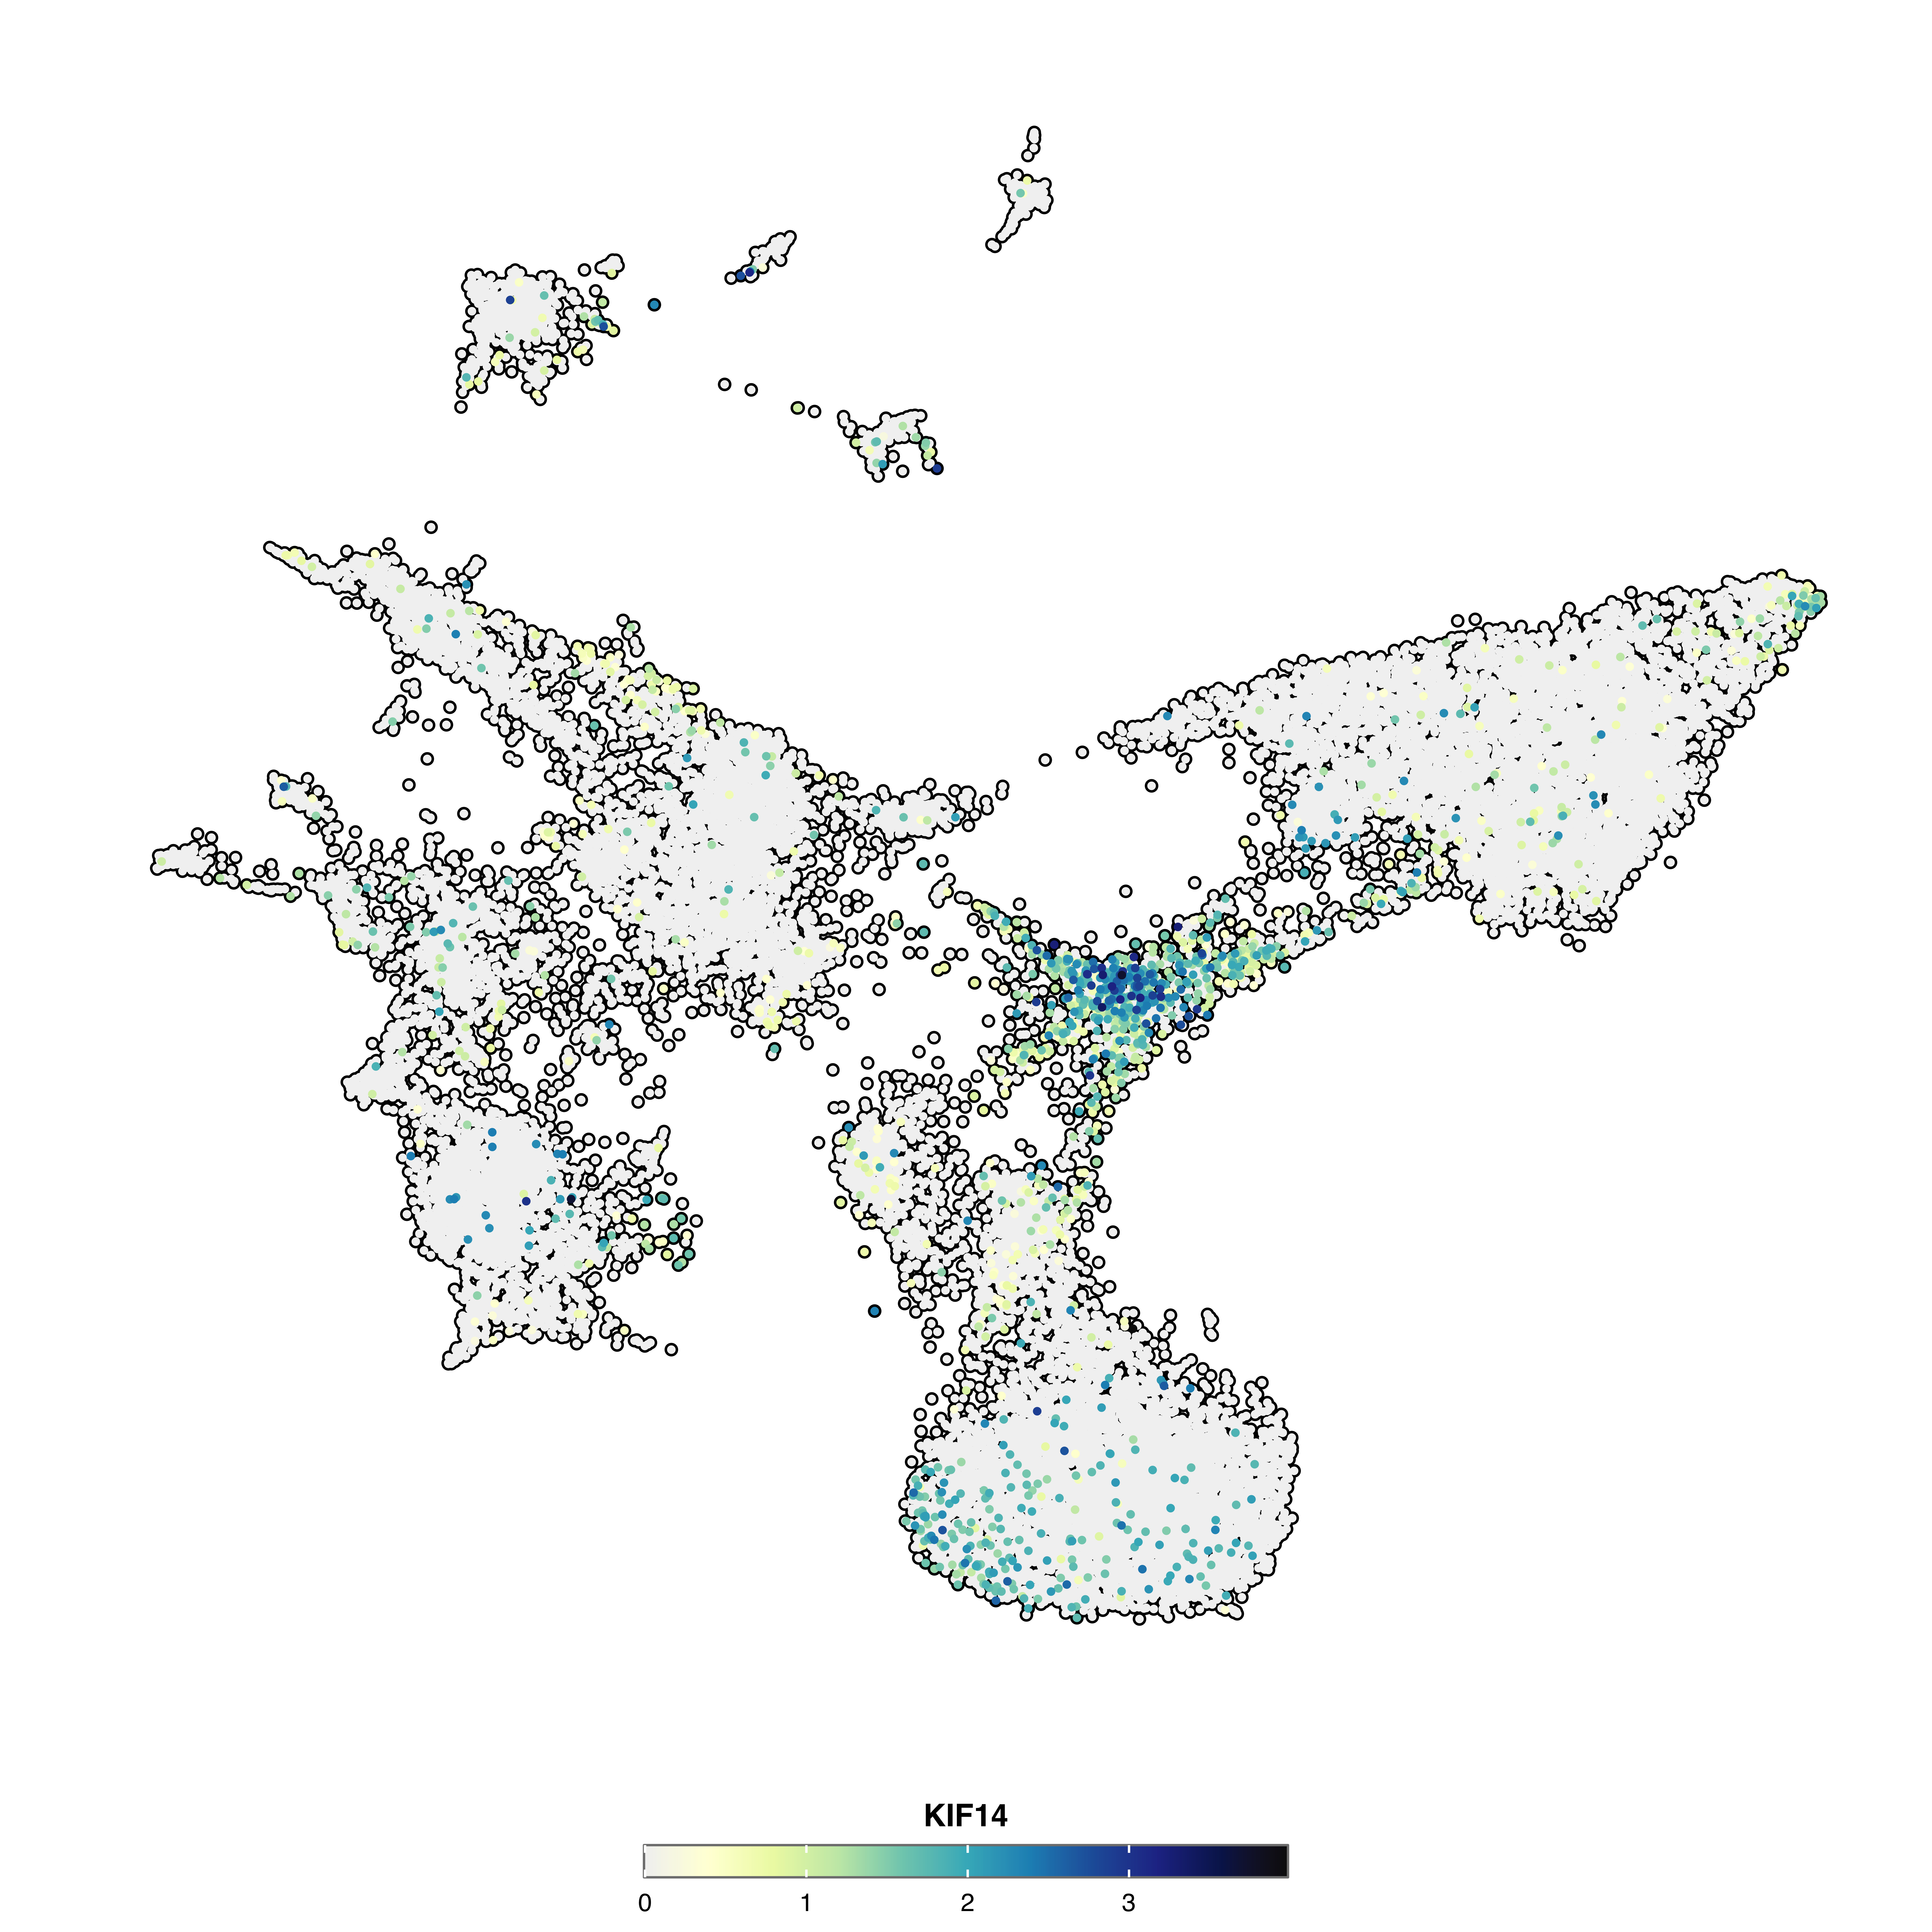
For parameters shared across many functions (color palettes, typography, legend styling, titles, cell borders, density contours, rendering), see Shared features.
| Parameter | Description | Default |
|---|---|---|
features |
Features to plot (genes, metadata, PCs) | — |
| Parameter | Description | Default |
|---|---|---|
scale.limits |
Fixed scale limits c(min, max)
|
NULL |
symmetry.type |
"absolute" or "centered"
|
"absolute" |
symmetry.center |
Center value for "centered" type |
NA |
| Parameter | Description | Default |
|---|---|---|
idents.keep |
Identities to display | NULL |
cells.highlight |
Cell barcodes to highlight | NULL |
idents.highlight |
Identities to highlight | NULL |
| Parameter | Description | Default |
|---|---|---|
group.by |
Metadata column for group overlay | NULL |
group.by.colors.use |
Colors for groups | Auto-generated |
group.by.legend |
Legend title for groups | Column name |
group.by.dot.size |
Size of center dots | 8 |
group.by.show.dots |
Show center dots | TRUE |
group.by.cell_borders |
Show colored borders | FALSE |
group.by.cell_borders.alpha |
Border transparency | 0.1 |
colorblind |
Colorblind-safe group colors | FALSE |
| Parameter | Description | Default |
|---|---|---|
individual.titles |
Title per feature | NULL |
individual.subtitles |
Subtitle per feature | NULL |
individual.captions |
Caption per feature | NULL |
| Parameter | Description | Default |
|---|---|---|
order |
Order cells by expression | FALSE |
ncol |
Columns for multiple features | NULL |
plot.axes |
Show axis lines | FALSE |
verbose |
Show messages | TRUE |