p <- SCpubr::do_BarPlot(sample = sample,
                        group.by = "Annotation")
p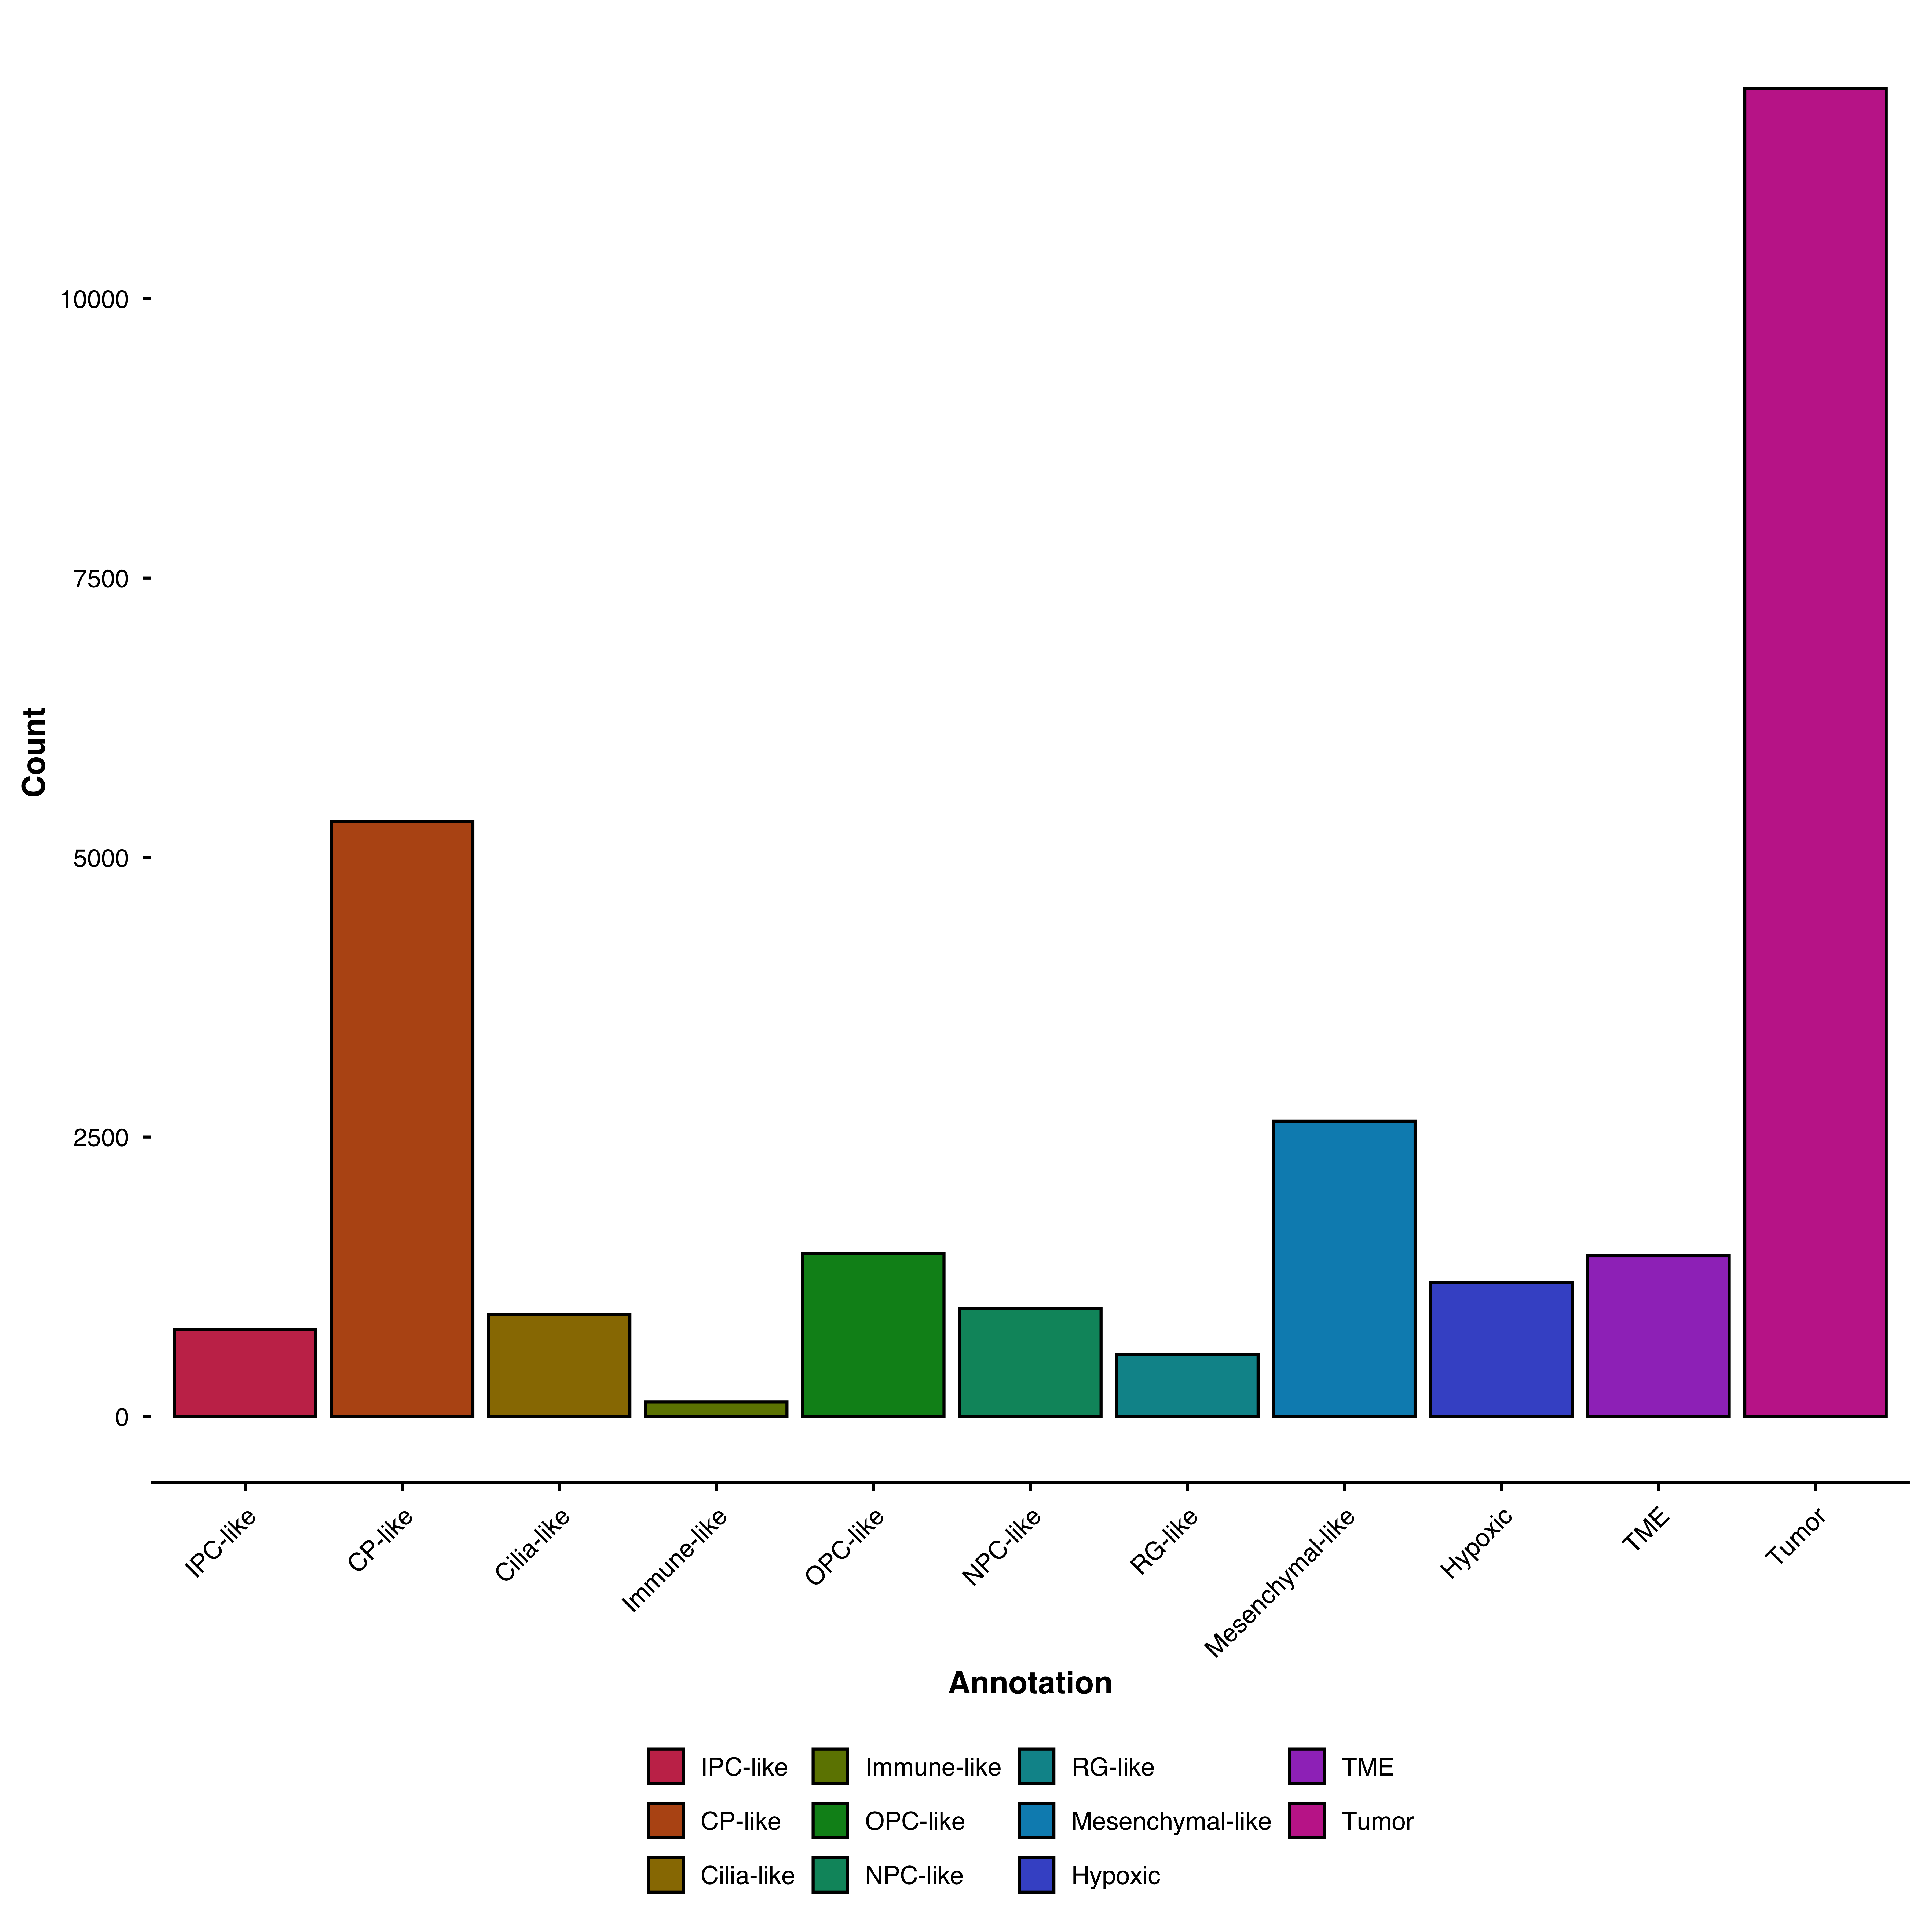
Bar plots display counts or proportions of categorical variables. Use them to compare cell type composition across samples, conditions, or any grouping variable.
Count cells per cluster:
p <- SCpubr::do_BarPlot(sample = sample,
group.by = "Annotation")
p
Show how clusters are distributed across samples:
p <- SCpubr::do_BarPlot(sample = sample,
                        group.by = "Annotation",
                        split.by = "ID",
                        position = "stack")
p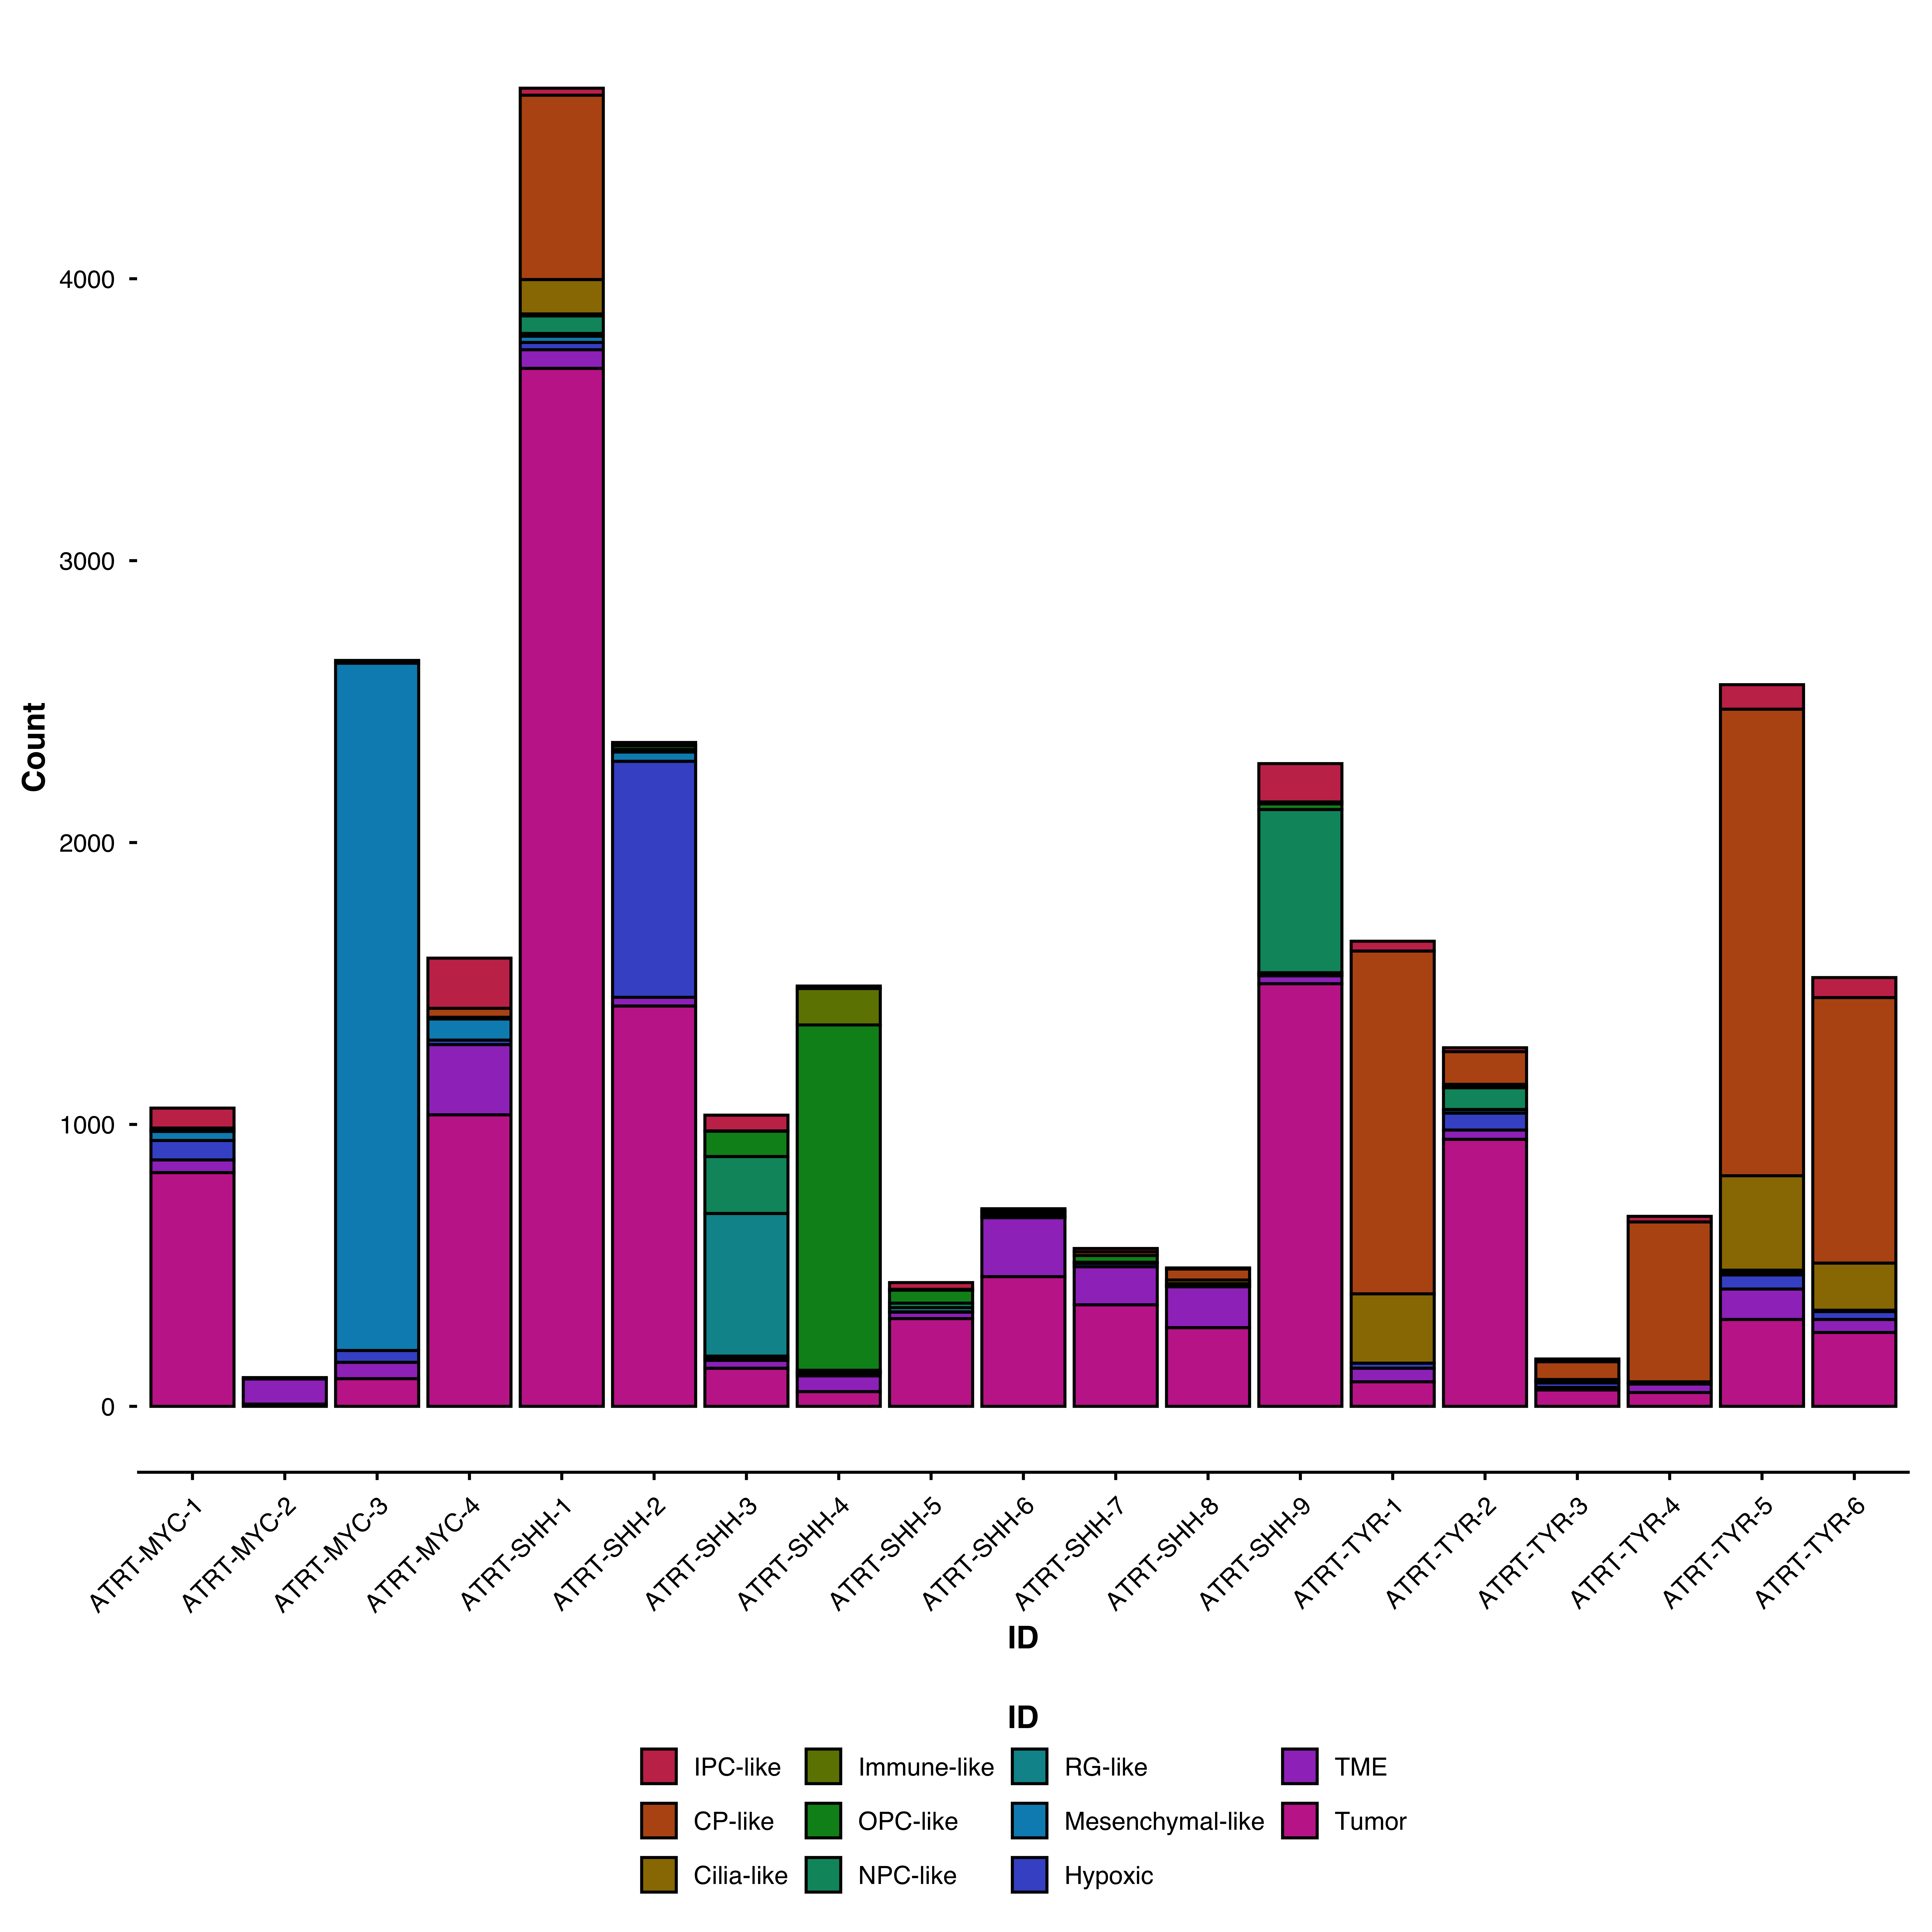
Think of it as: - group.by: What creates the bars (total counts per value) - split.by: How each bar is subdivided
Use position = "fill" to normalize bars to the same height:
p <- SCpubr::do_BarPlot(sample = sample,
                        group.by = "Annotation",
                        split.by = "ID",
                        position = "fill",
                        flip = TRUE)
p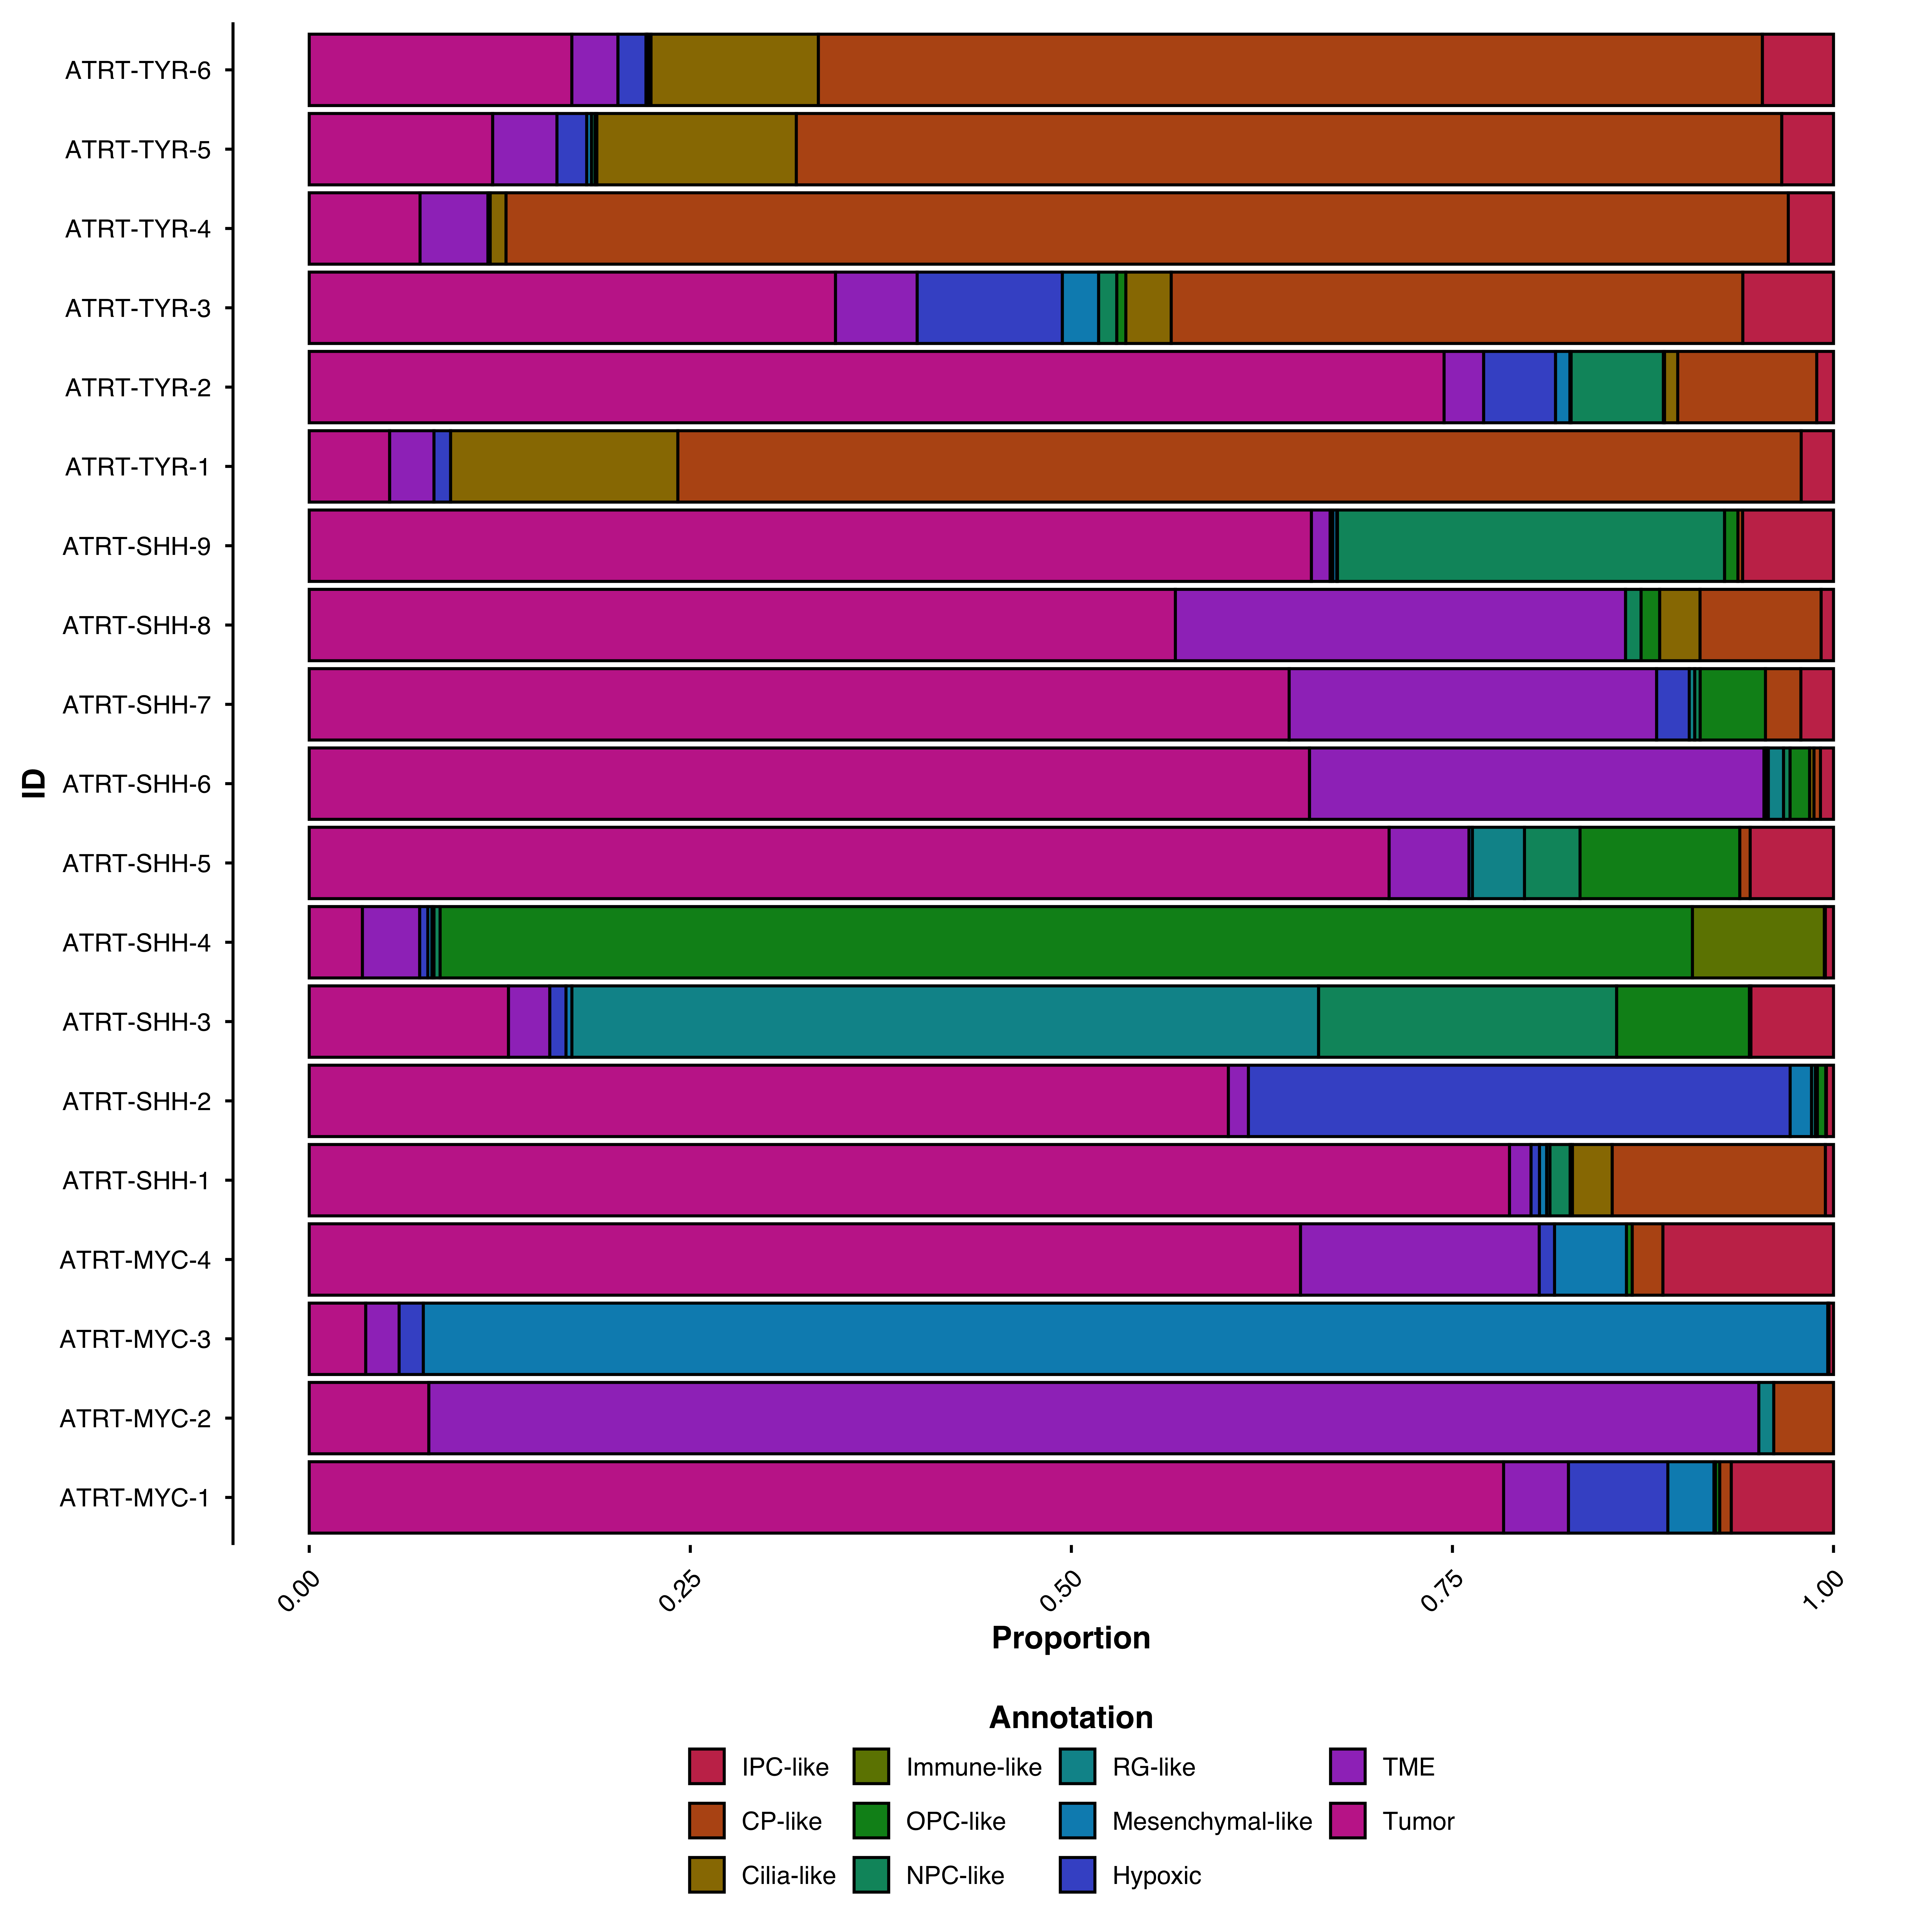
Display the total cell count on each bar:
p <- SCpubr::do_BarPlot(sample = sample,
                        group.by = "Annotation",
                        split.by = "ID",
                        position = "fill",
                        flip = TRUE,
                        add.n = TRUE,
                        add.n.size = 4,
                        add.n.expand = c(0, 1.15))
p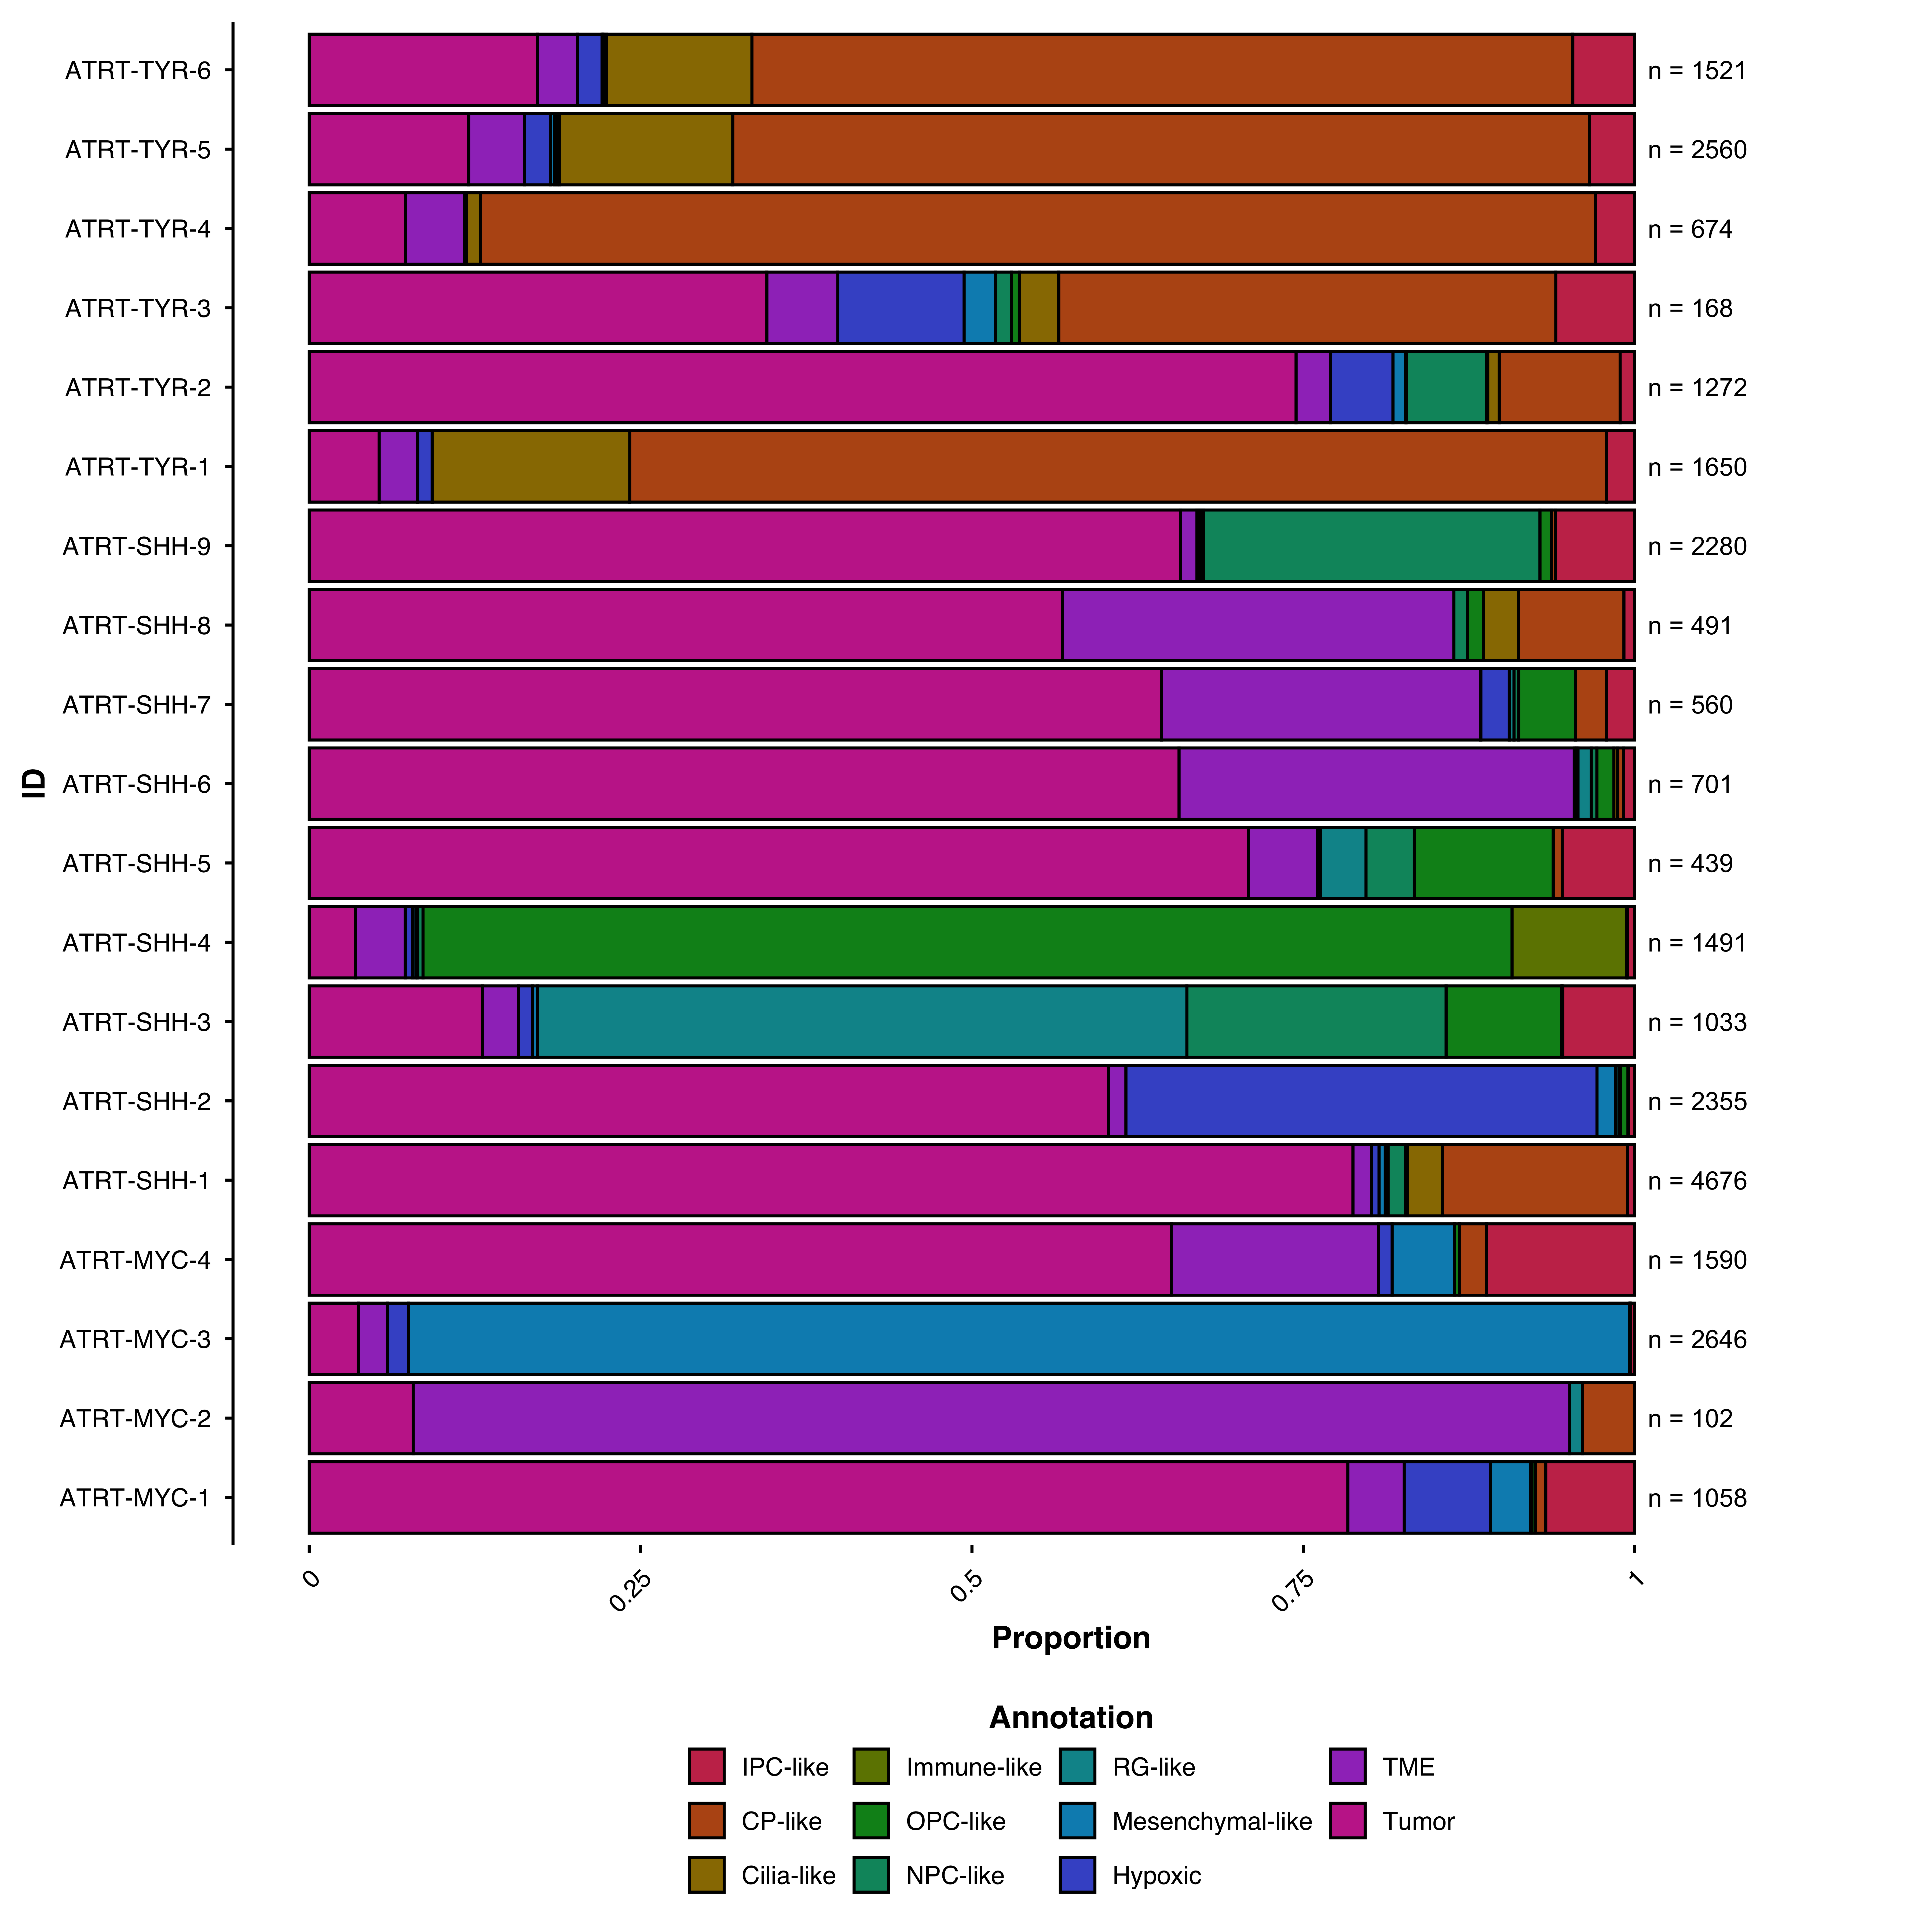
Order by total count or by a specific group’s value:
# Order by total count
p <- SCpubr::do_BarPlot(sample = sample,
                        group.by = "Annotation",
                        order = TRUE)

p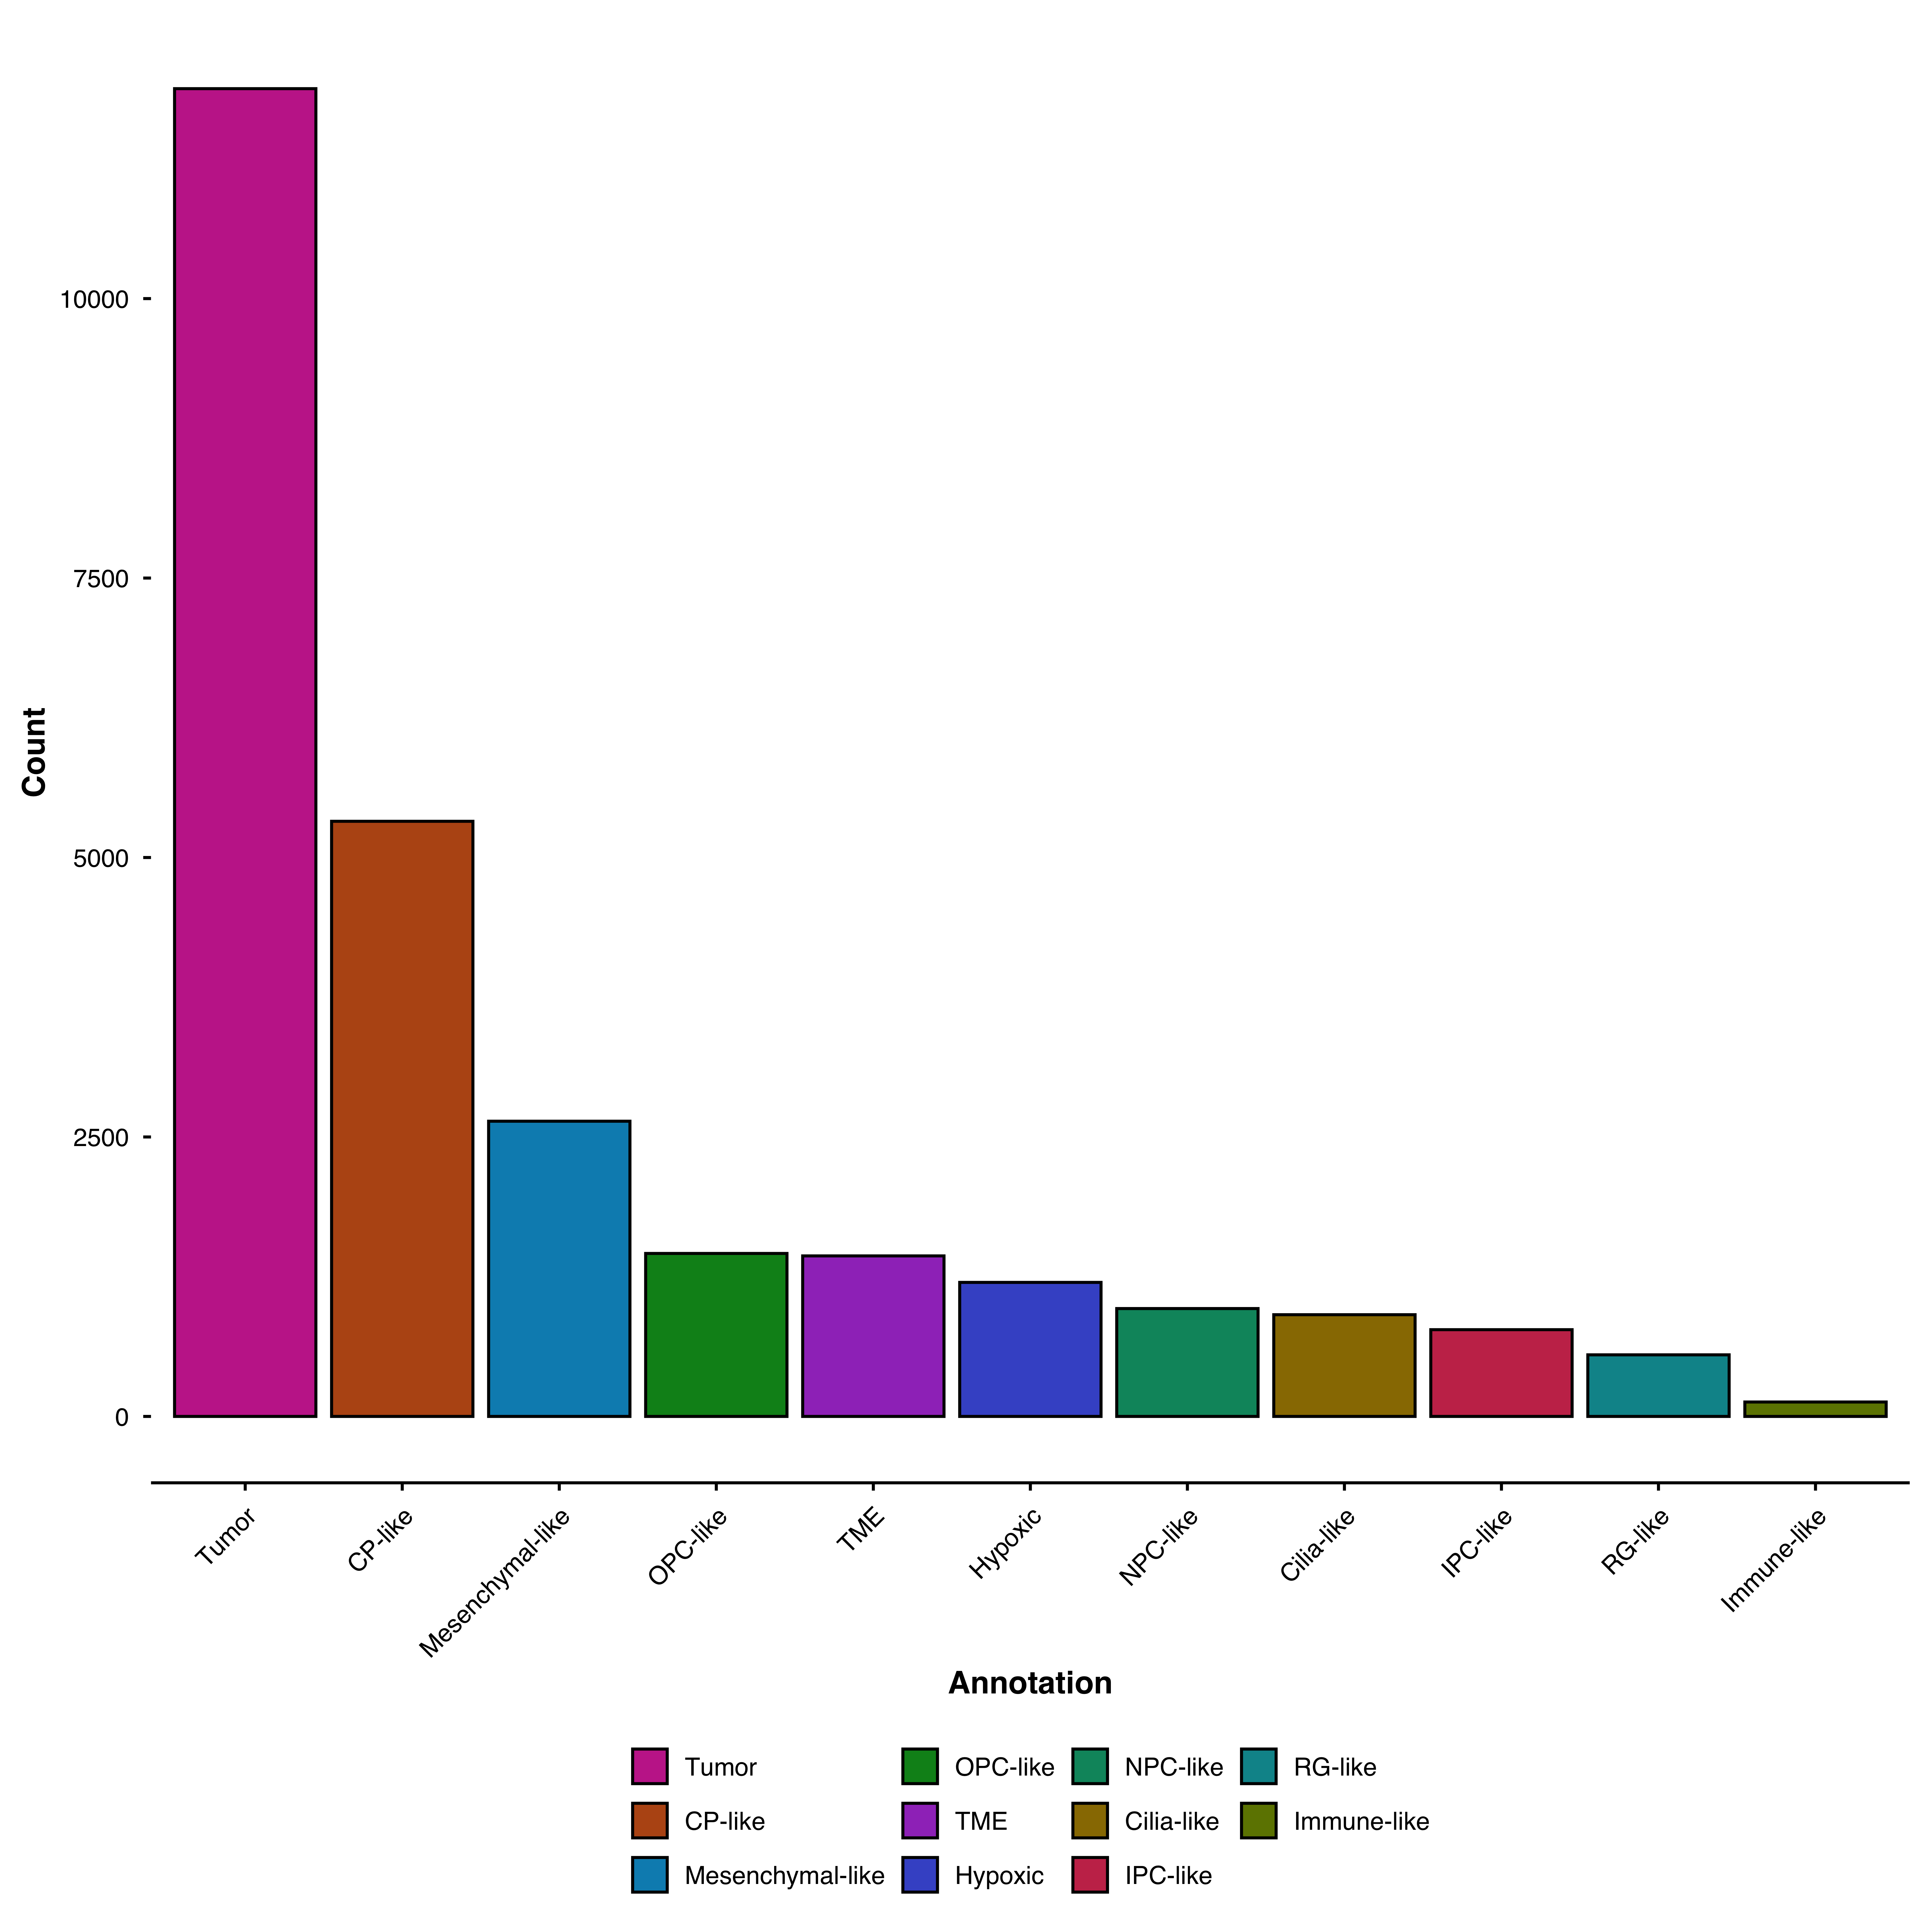
Break down bars by an additional grouping:
p <- SCpubr::do_BarPlot(sample = sample,
                        group.by = "Annotation",
                        split.by = "ID",
                        facet.by = "subtype",
                        position = "fill",
                        flip = TRUE)
p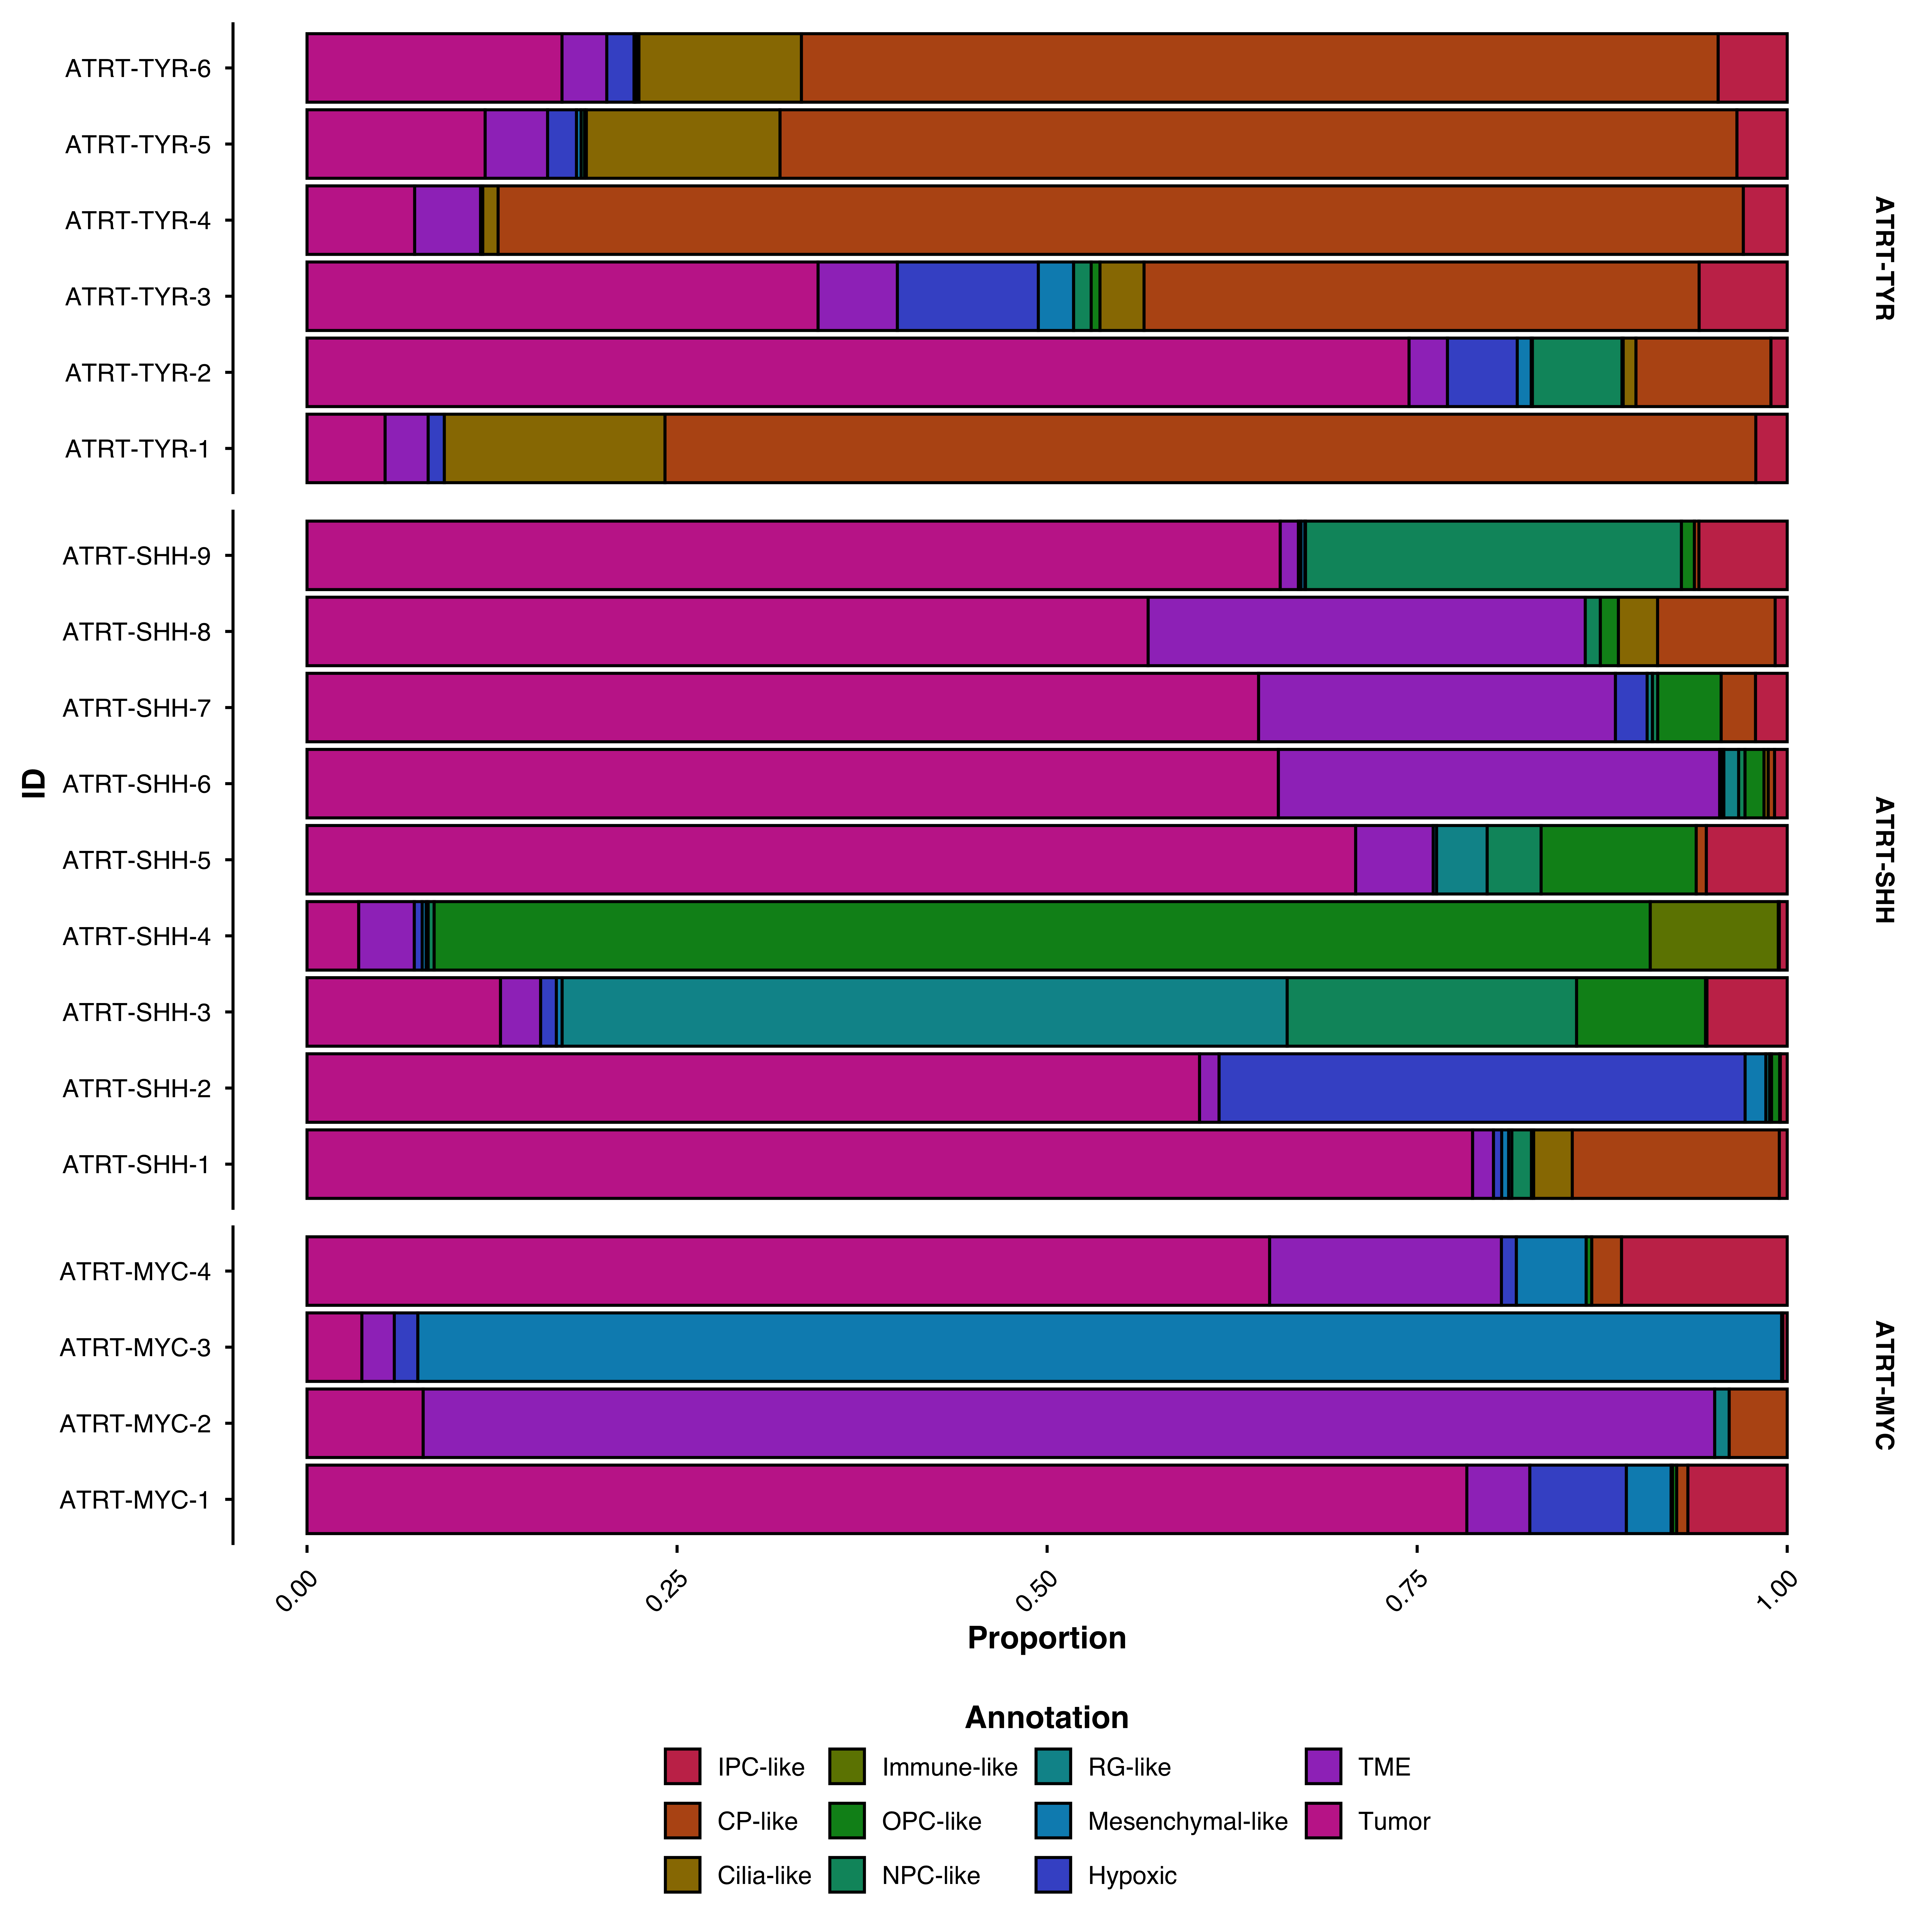
Get the underlying count/proportion data:
result <- SCpubr::do_BarPlot(sample = sample,
                             group.by = "Annotation",
                             split.by = "ID",
                             return_data = TRUE)

head(result$Data)
#> # A tibble: 6 × 4
#>   ID             n    freq Annotation
#>   <chr>      <dbl>   <dbl> <chr>
#> 1 ATRT-MYC-1     8 0.00756 CP-like
#> 2 ATRT-MYC-1     0 0       Cilia-like
#> 3 ATRT-MYC-1    69 0.0652  Hypoxic
#> 4 ATRT-MYC-1    71 0.0671  IPC-like
#> 5 ATRT-MYC-1     0 0       Immune-like
#> 6 ATRT-MYC-1 32 0.0302 Mesenchymal-likeFor parameters shared across many functions (color palettes, typography, legend styling), see Shared features.
| Parameter | Description | Default |
|---|---|---|
group.by |
Metadata column for bars | — |
split.by |
Metadata column to subdivide bars | NULL |
facet.by |
Metadata column to facet by | NULL |
position |
"stack" (counts) or "fill" (proportions) |
"stack" |
| Parameter | Description | Default |
|---|---|---|
order |
Order bars by descending count | FALSE |
order.by |
Value of split.by to order by |
NULL |
| Parameter | Description | Default |
|---|---|---|
add.n |
Show total counts on bars | FALSE |
add.n.size |
Label text size | 4 |
add.n.face |
Label font face | "bold" |
add.n.expand |
Y-axis expansion for labels | c(0, 1.15) |
| Parameter | Description | Default |
|---|---|---|
return_data |
Return data instead of plot | FALSE |