p <- SCpubr::do_BeeSwarmPlot(sample = sample,
                             feature_to_rank = "nCount_RNA")
p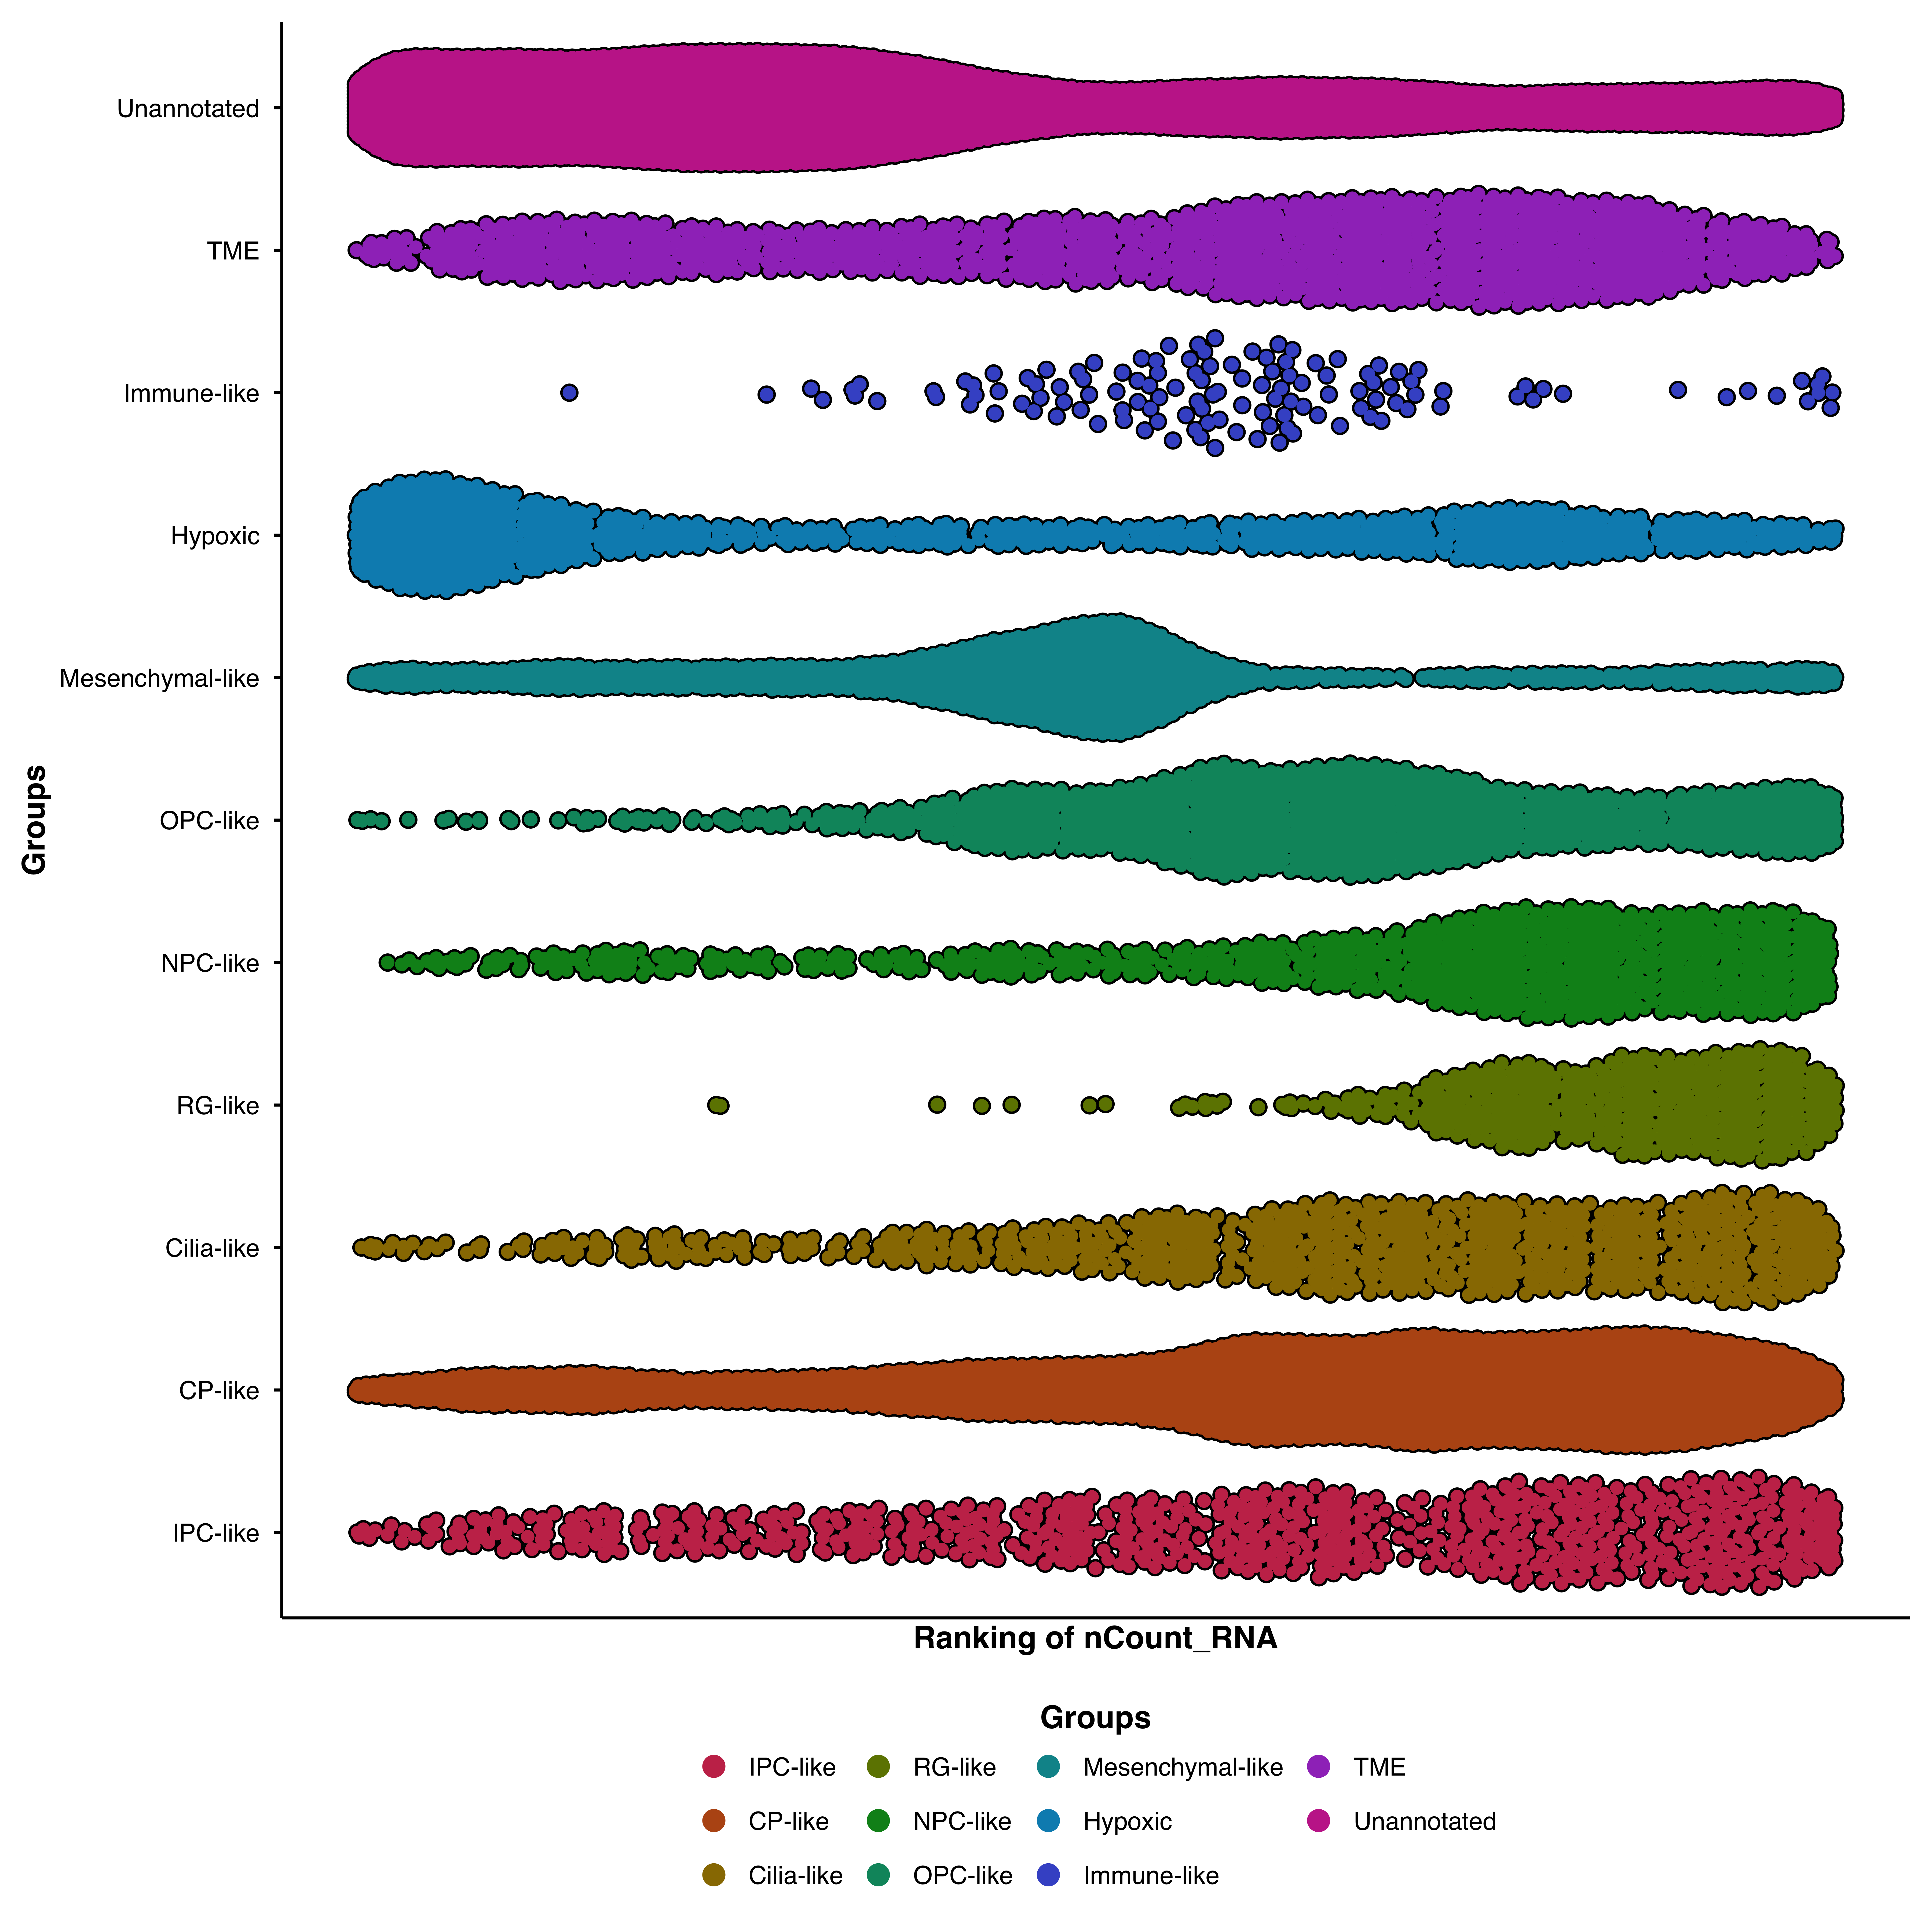
Beeswarm plots display individual cells as ranked points, with beeswarm-style jittering to avoid overlaps. Cells are ranked by a feature (e.g., enrichment score) and colored by categorical or continuous values. Built on the ggbeeswarm package.
Rank cells by a feature (typically a score in metadata):
p <- SCpubr::do_BeeSwarmPlot(sample = sample,
feature_to_rank = "nCount_RNA")
p
p <- SCpubr::do_BeeSwarmPlot(sample = sample,
                             feature_to_rank = "nCount_RNA",
                             continuous_feature = TRUE)
p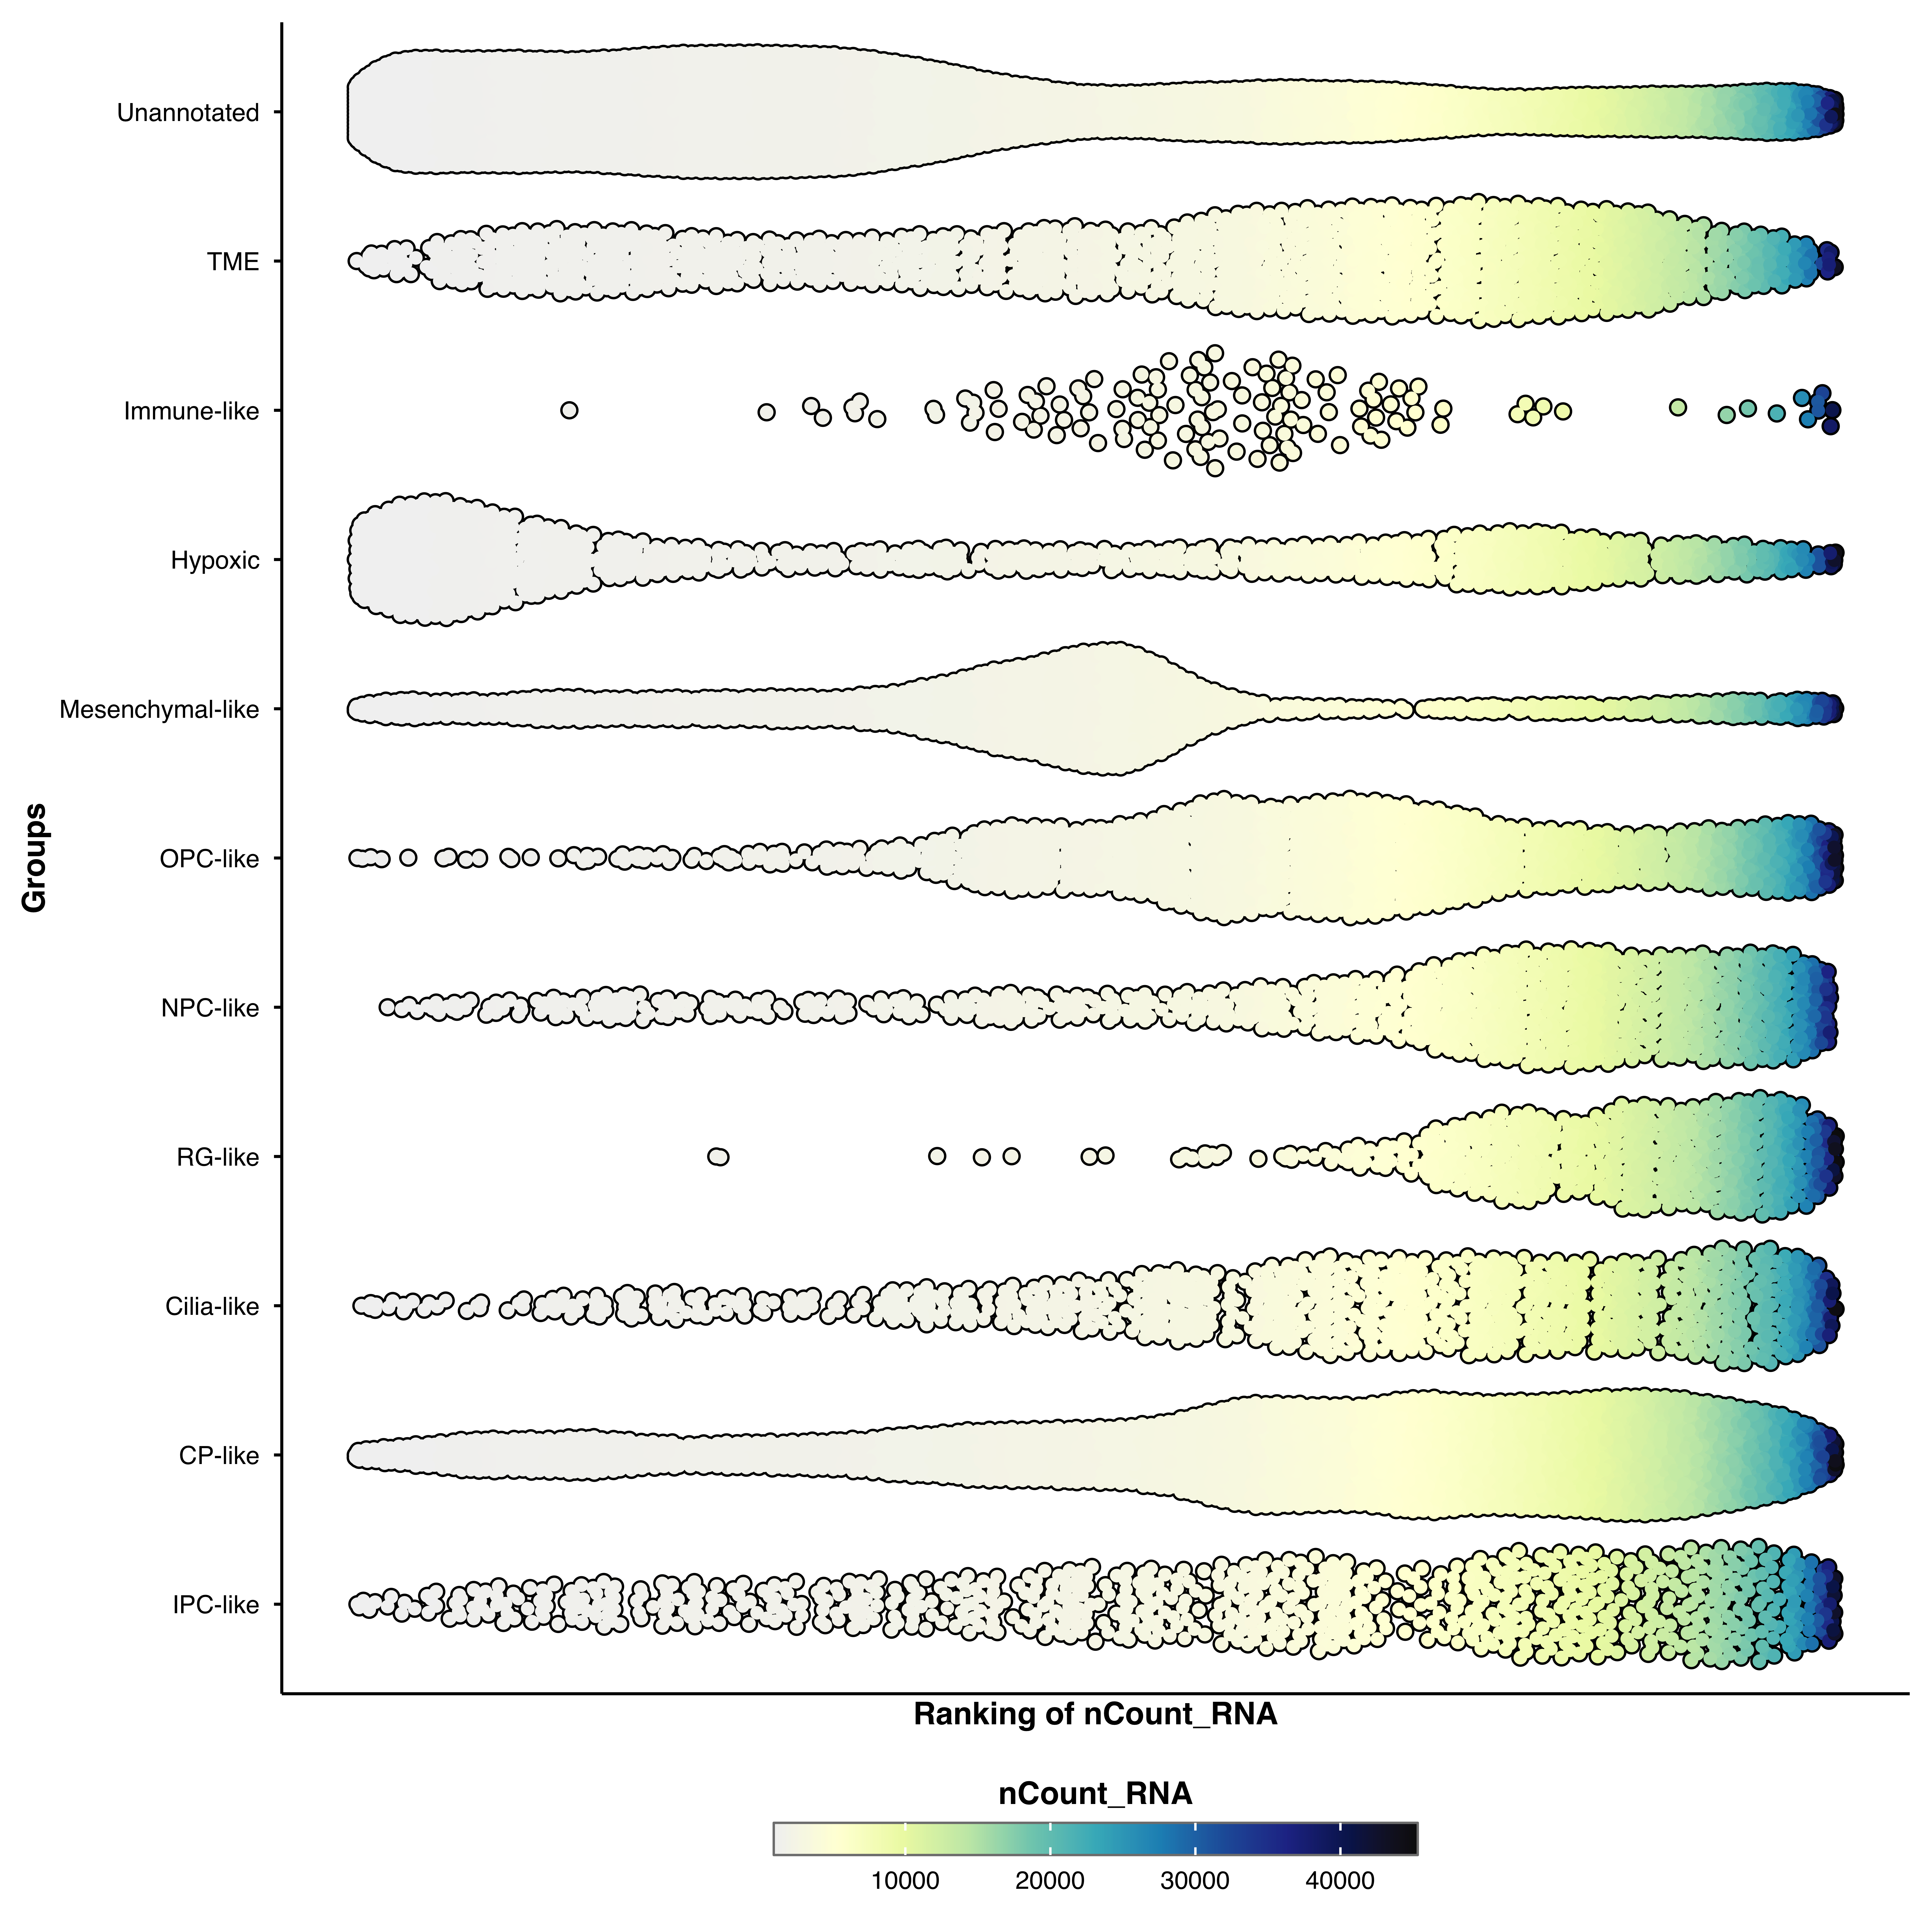
p <- SCpubr::do_BeeSwarmPlot(sample = sample,
                             feature_to_rank = "nCount_RNA",
                             continuous_feature = FALSE)
p
p <- SCpubr::do_BeeSwarmPlot(sample = sample,
                             feature_to_rank = "nCount_RNA",
                             order = TRUE)
p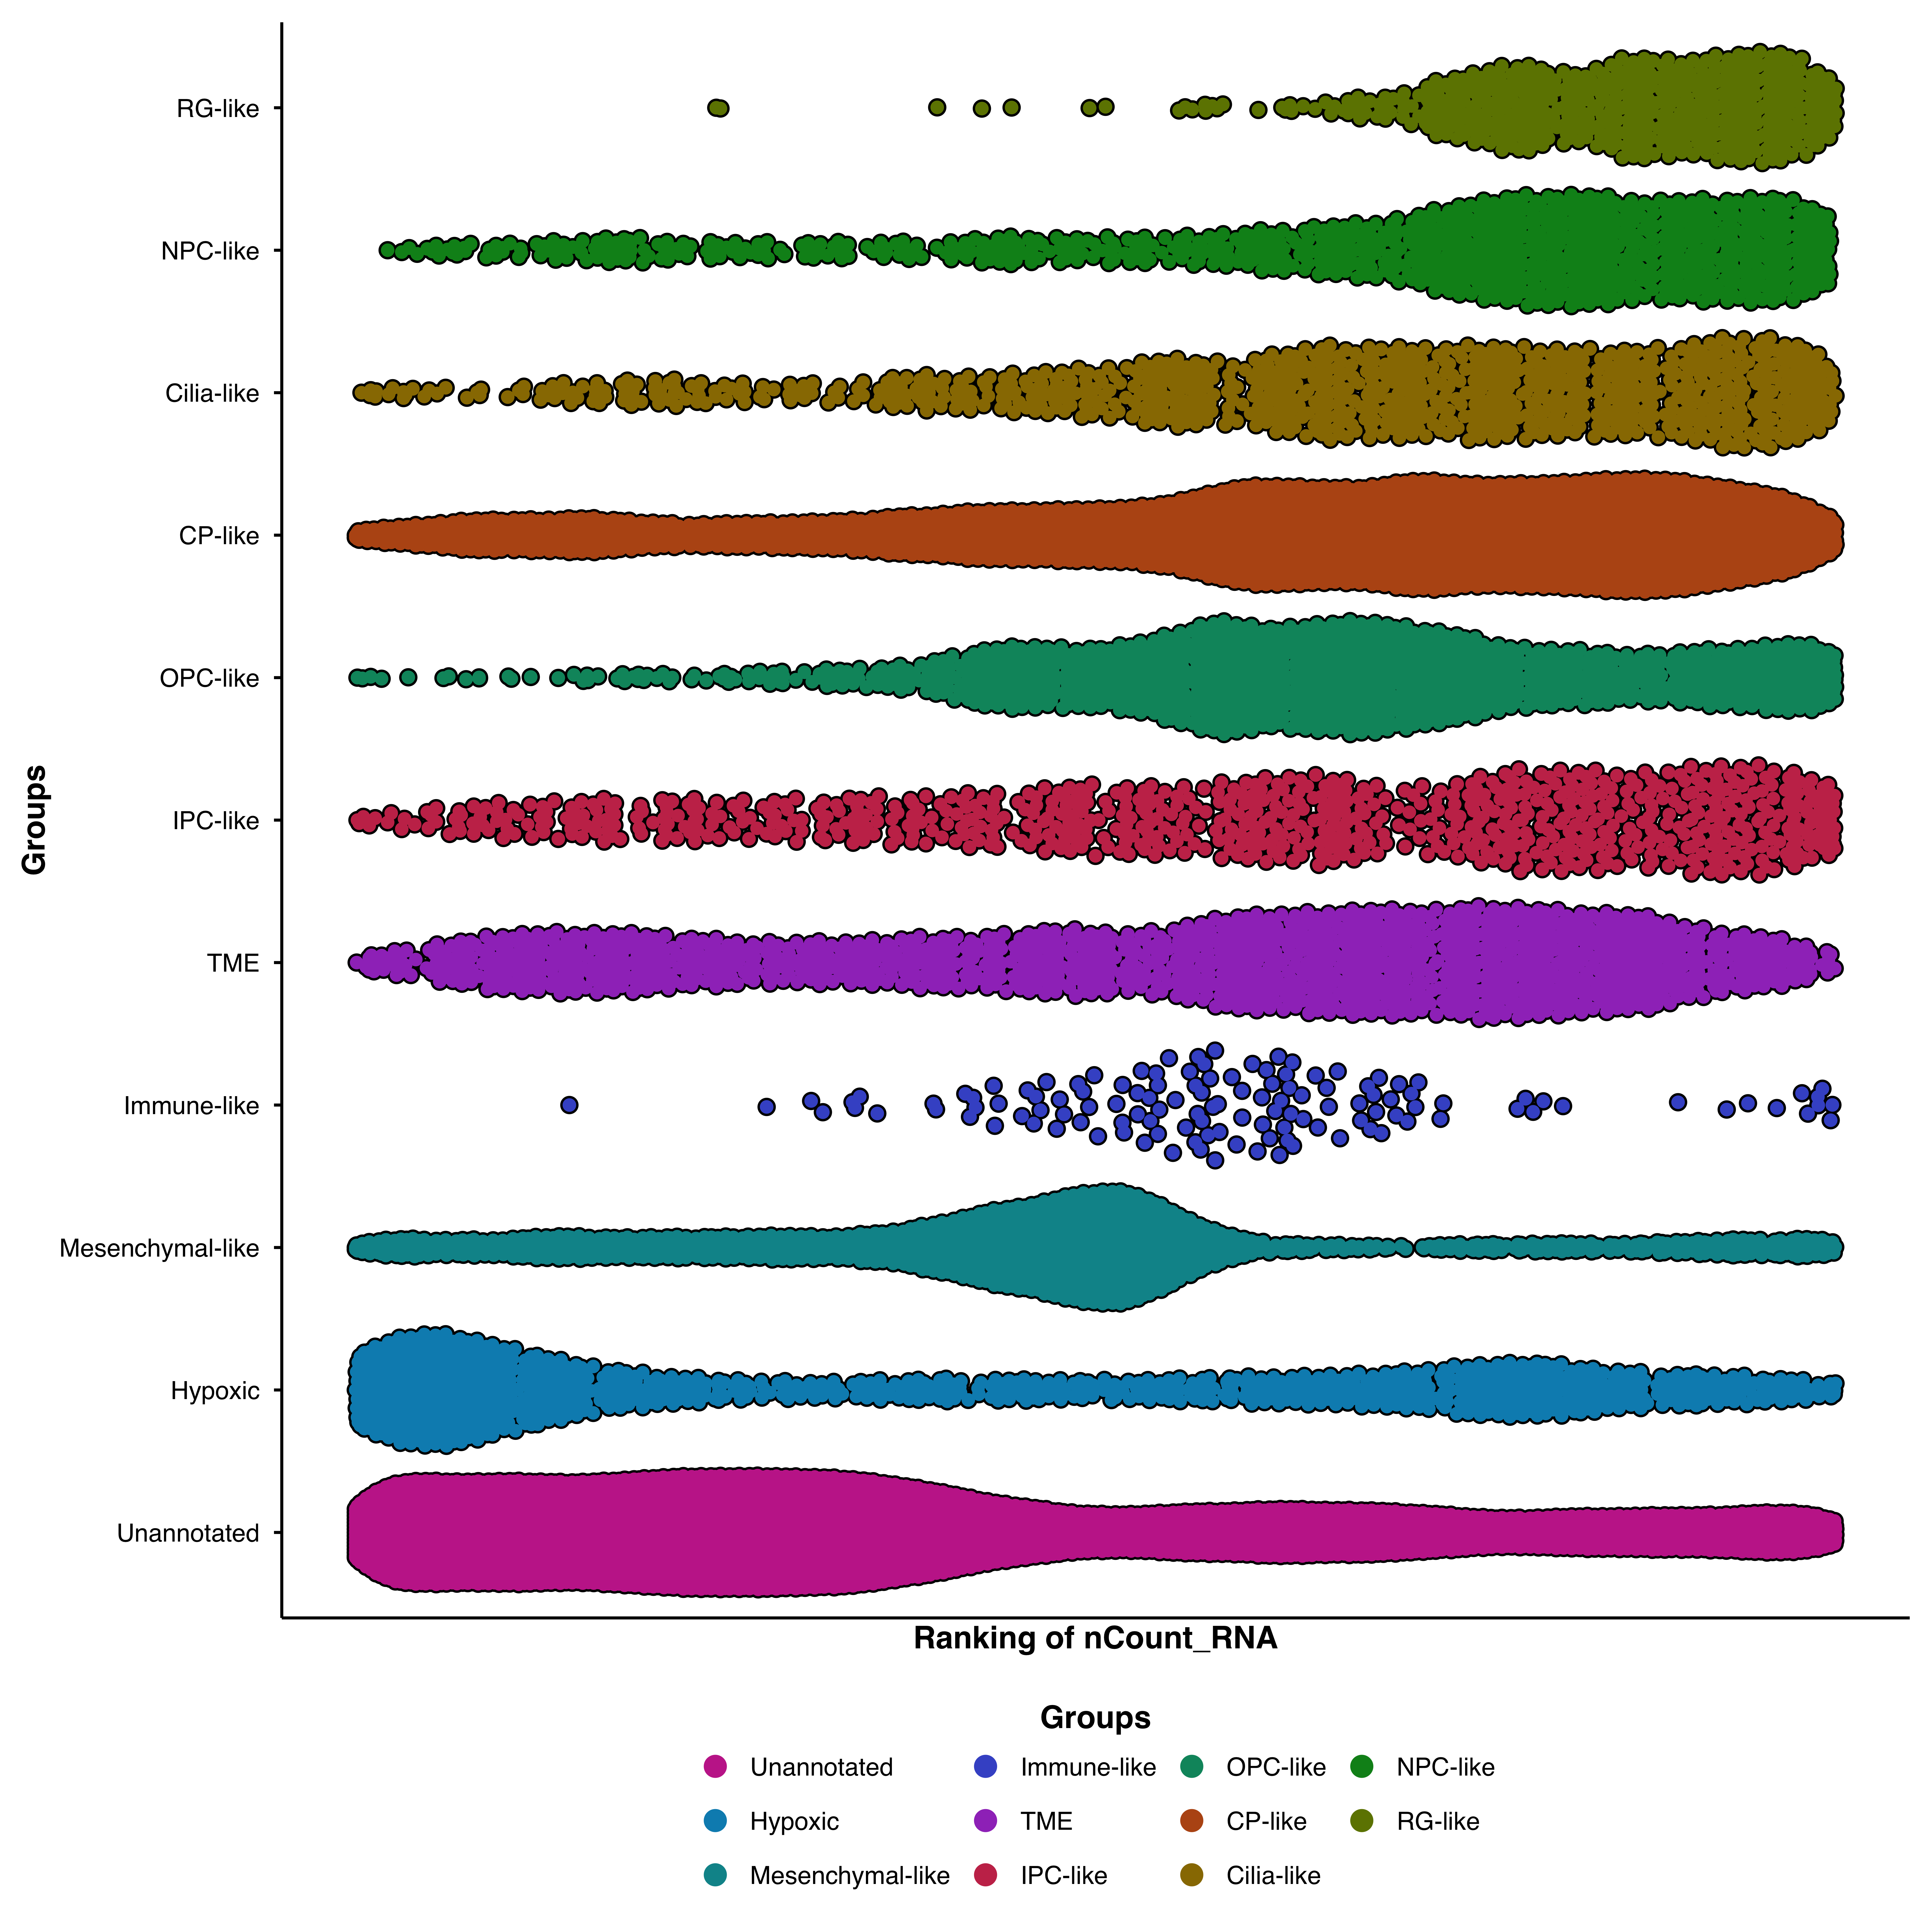
p <- SCpubr::do_BeeSwarmPlot(sample = sample,
                             feature_to_rank = "nCount_RNA",
                             remove_x_axis = TRUE,
                             remove_y_axis = TRUE)
p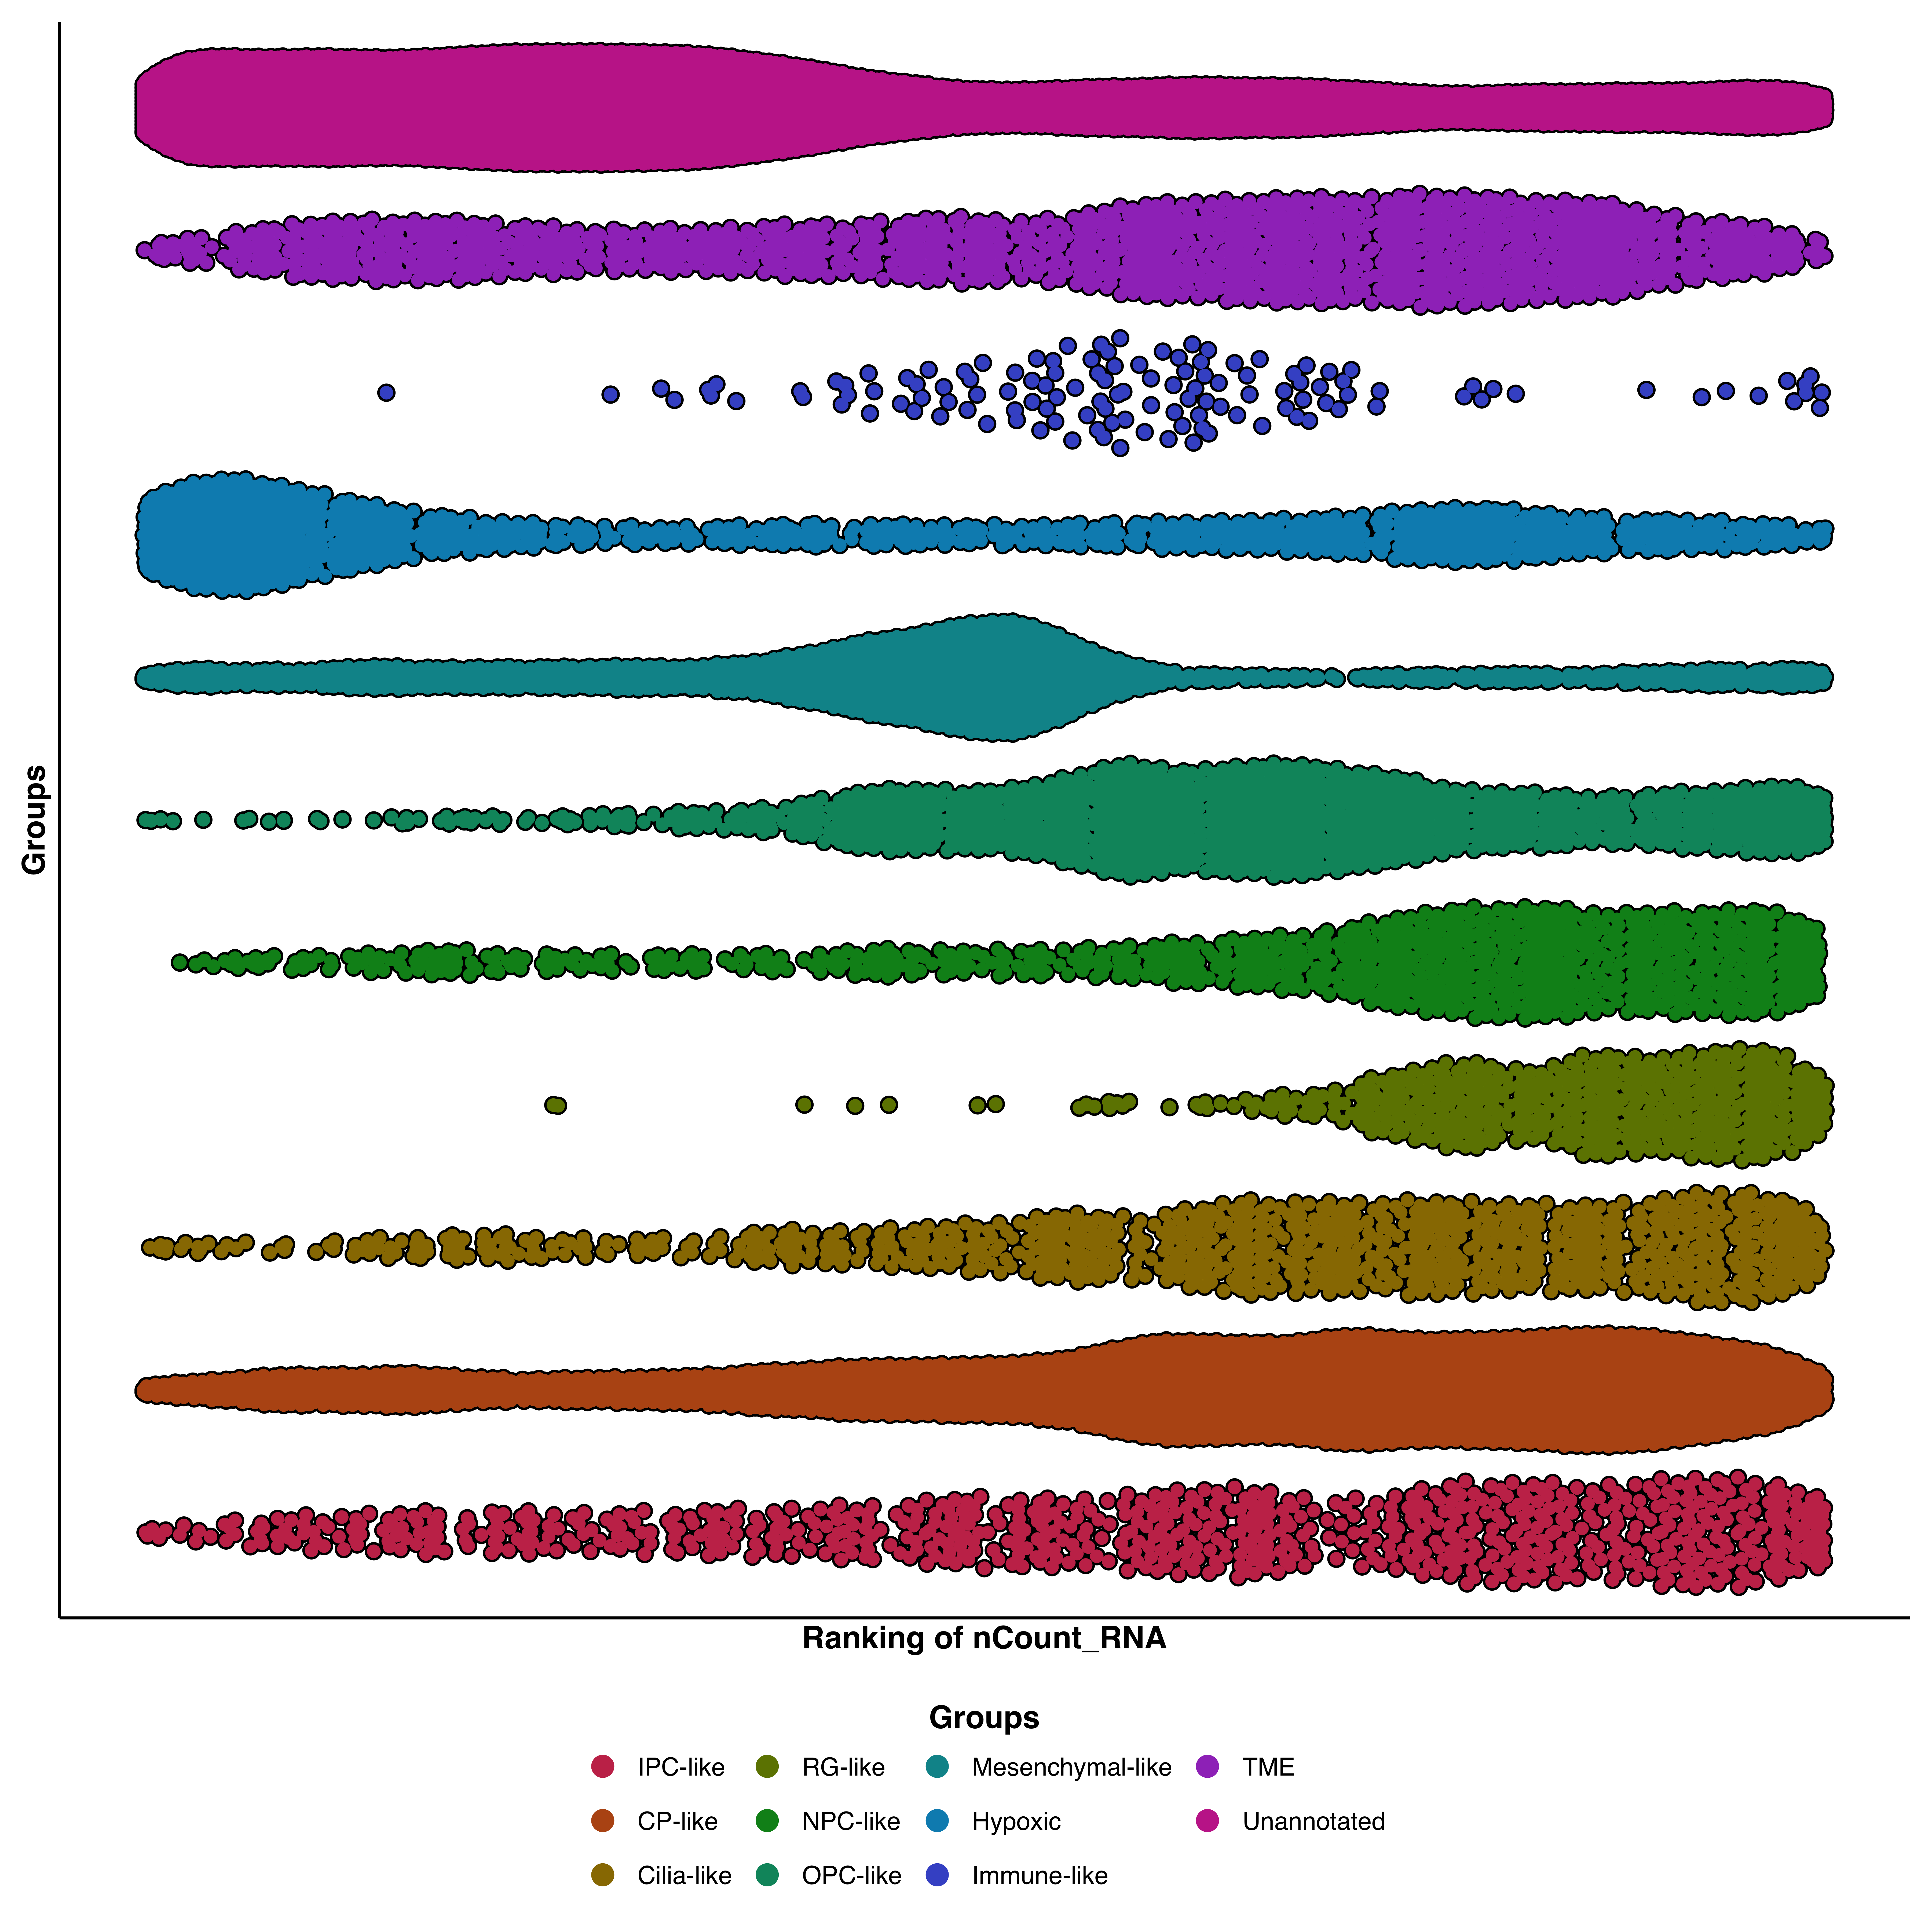
For parameters shared across many functions (color palettes, typography, legend styling, cell borders, rendering), see Shared features.
| Parameter | Description | Default |
|---|---|---|
feature_to_rank |
Feature to rank cells by | — |
continuous_feature |
Is feature continuous? | FALSE |
| Parameter | Description | Default |
|---|---|---|
order |
Order groups by median | FALSE |
remove_x_axis |
Hide X-axis | FALSE |
remove_y_axis |
Hide Y-axis | FALSE |