Welcome to Bioconductor

    Vignettes contain introductory material; view
    with 'browseVignettes()'. To cite Bioconductor,
    see 'citation("Biobase")', and for packages
    'citation("pkgname")'.
Loading required package: IRanges
Loading required package: S4Vectors
Attaching package: 'S4Vectors'
The following object is masked from 'package:utils':

    findMatches
The following objects are masked from 'package:base':

    expand.grid, I, unname
Attaching package: 'IRanges'
The following object is masked from 'package:sp':

    %over%
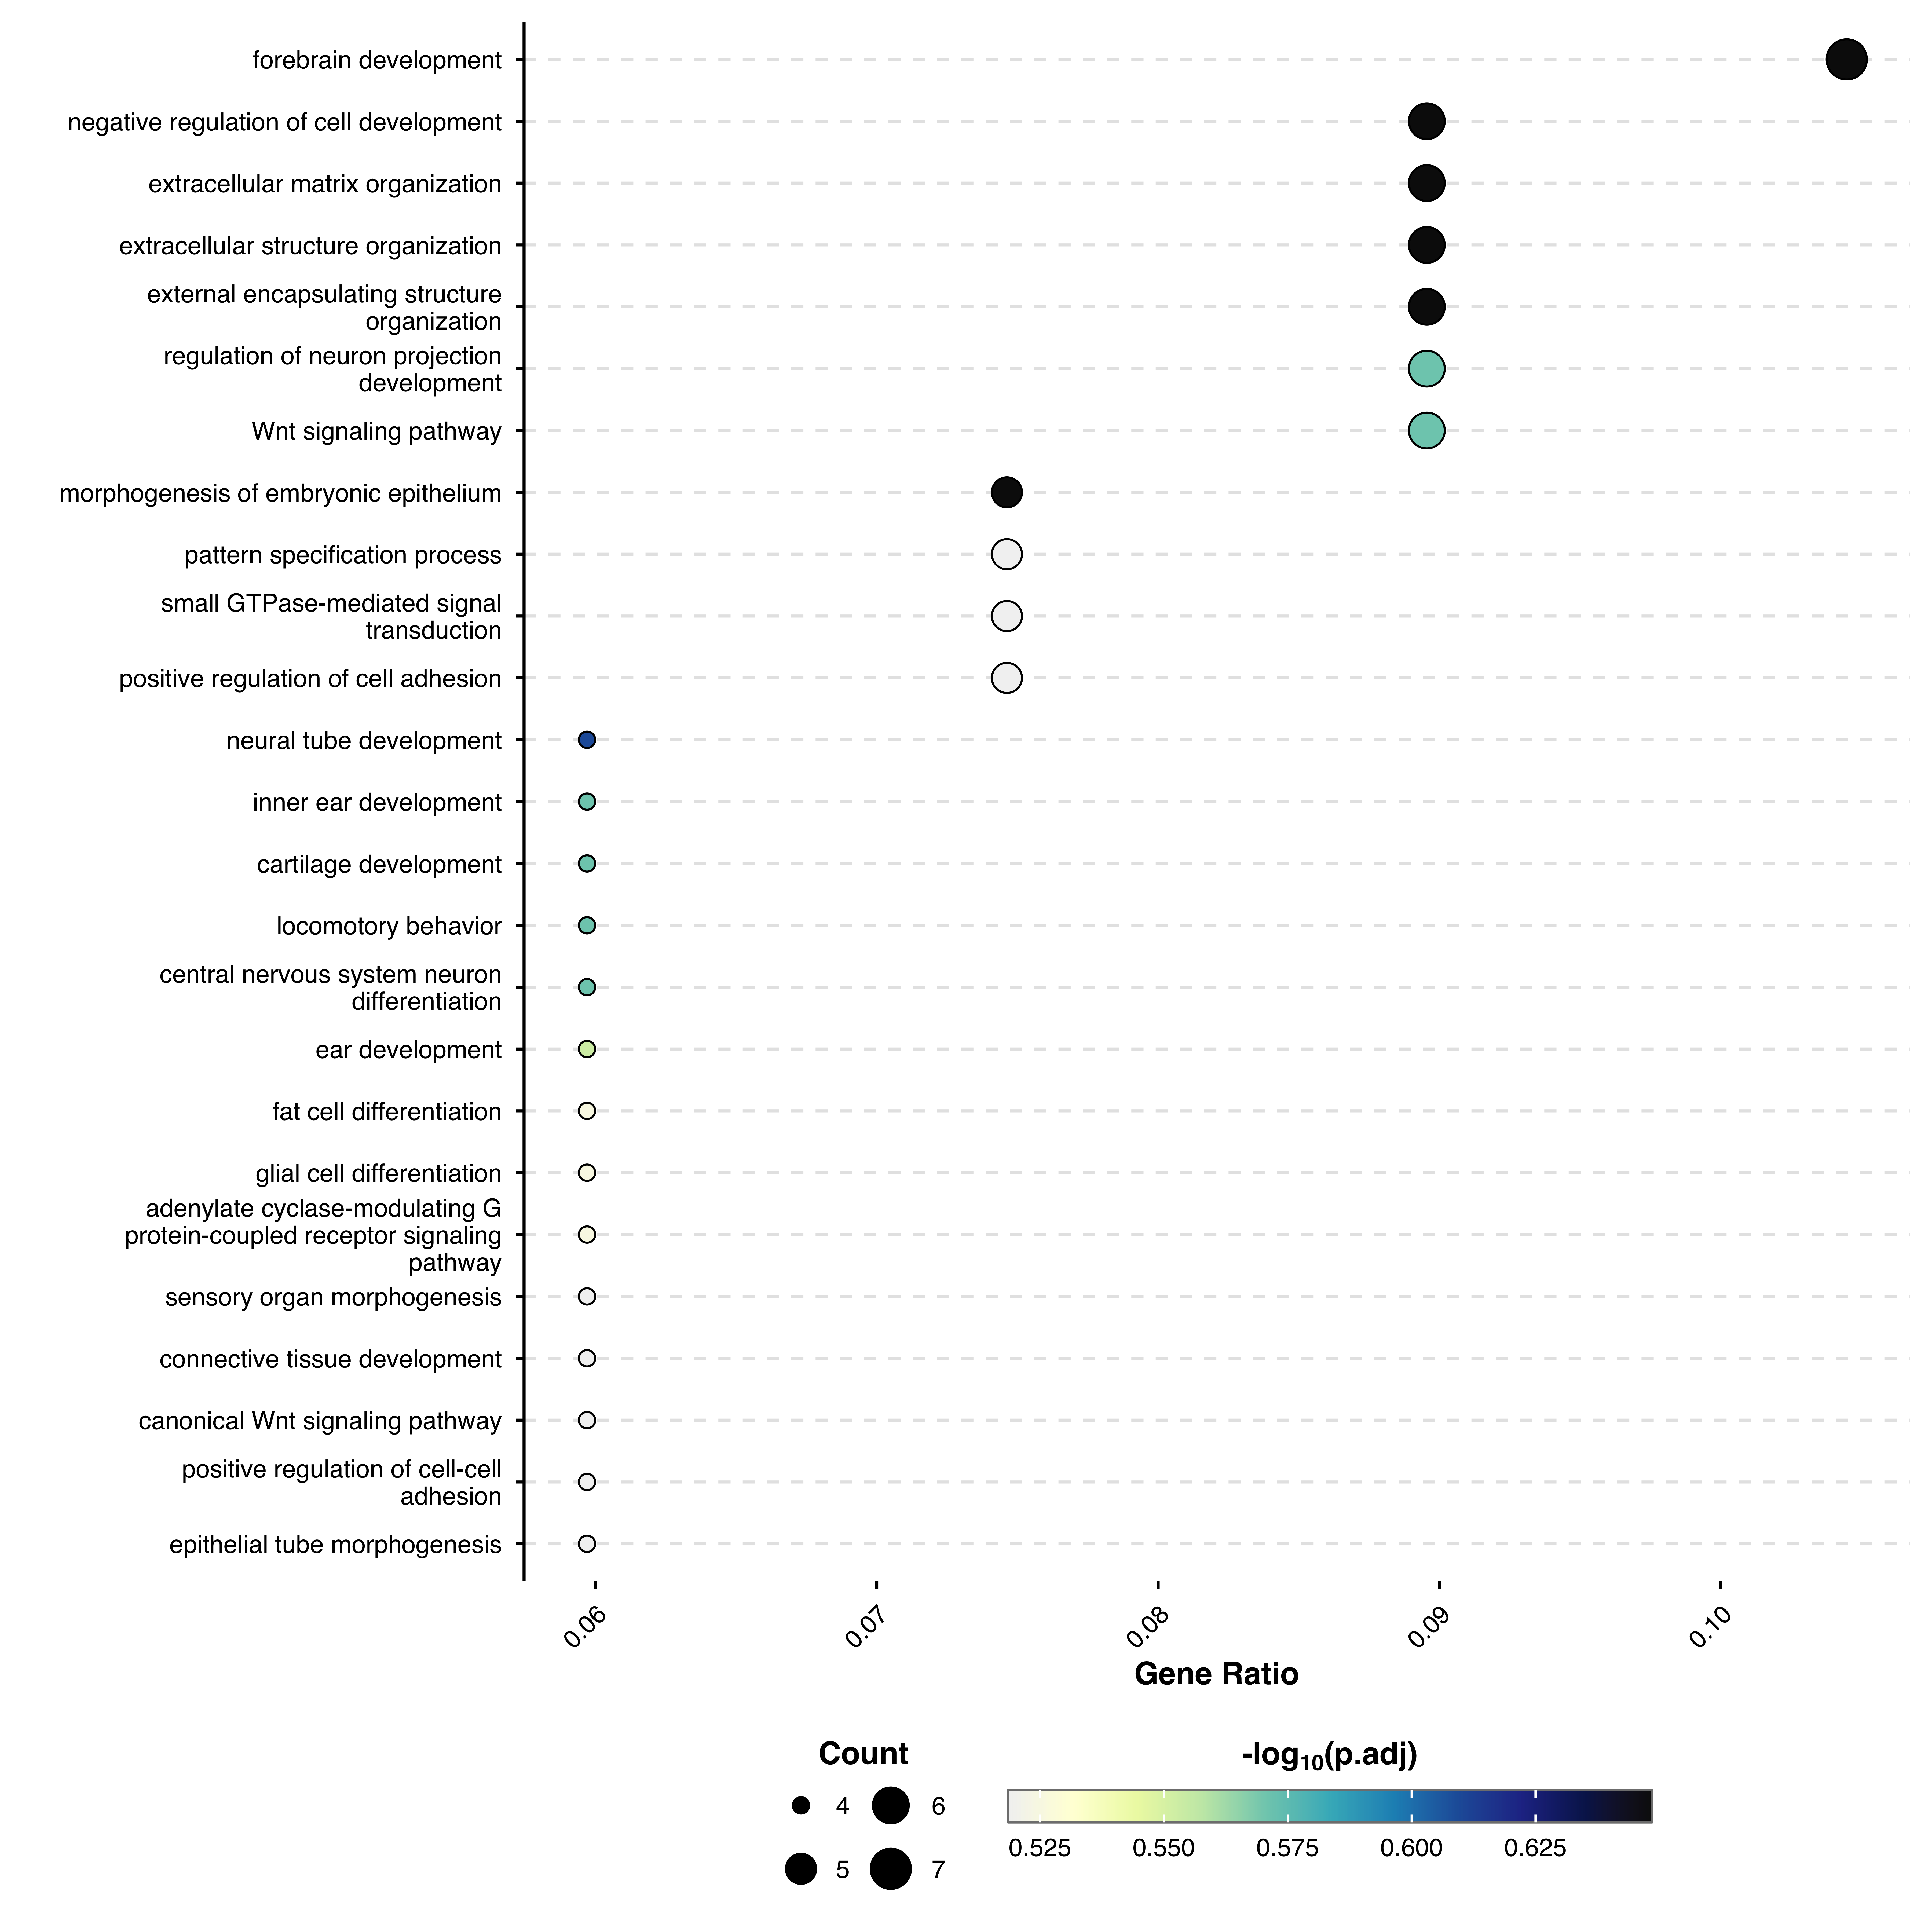
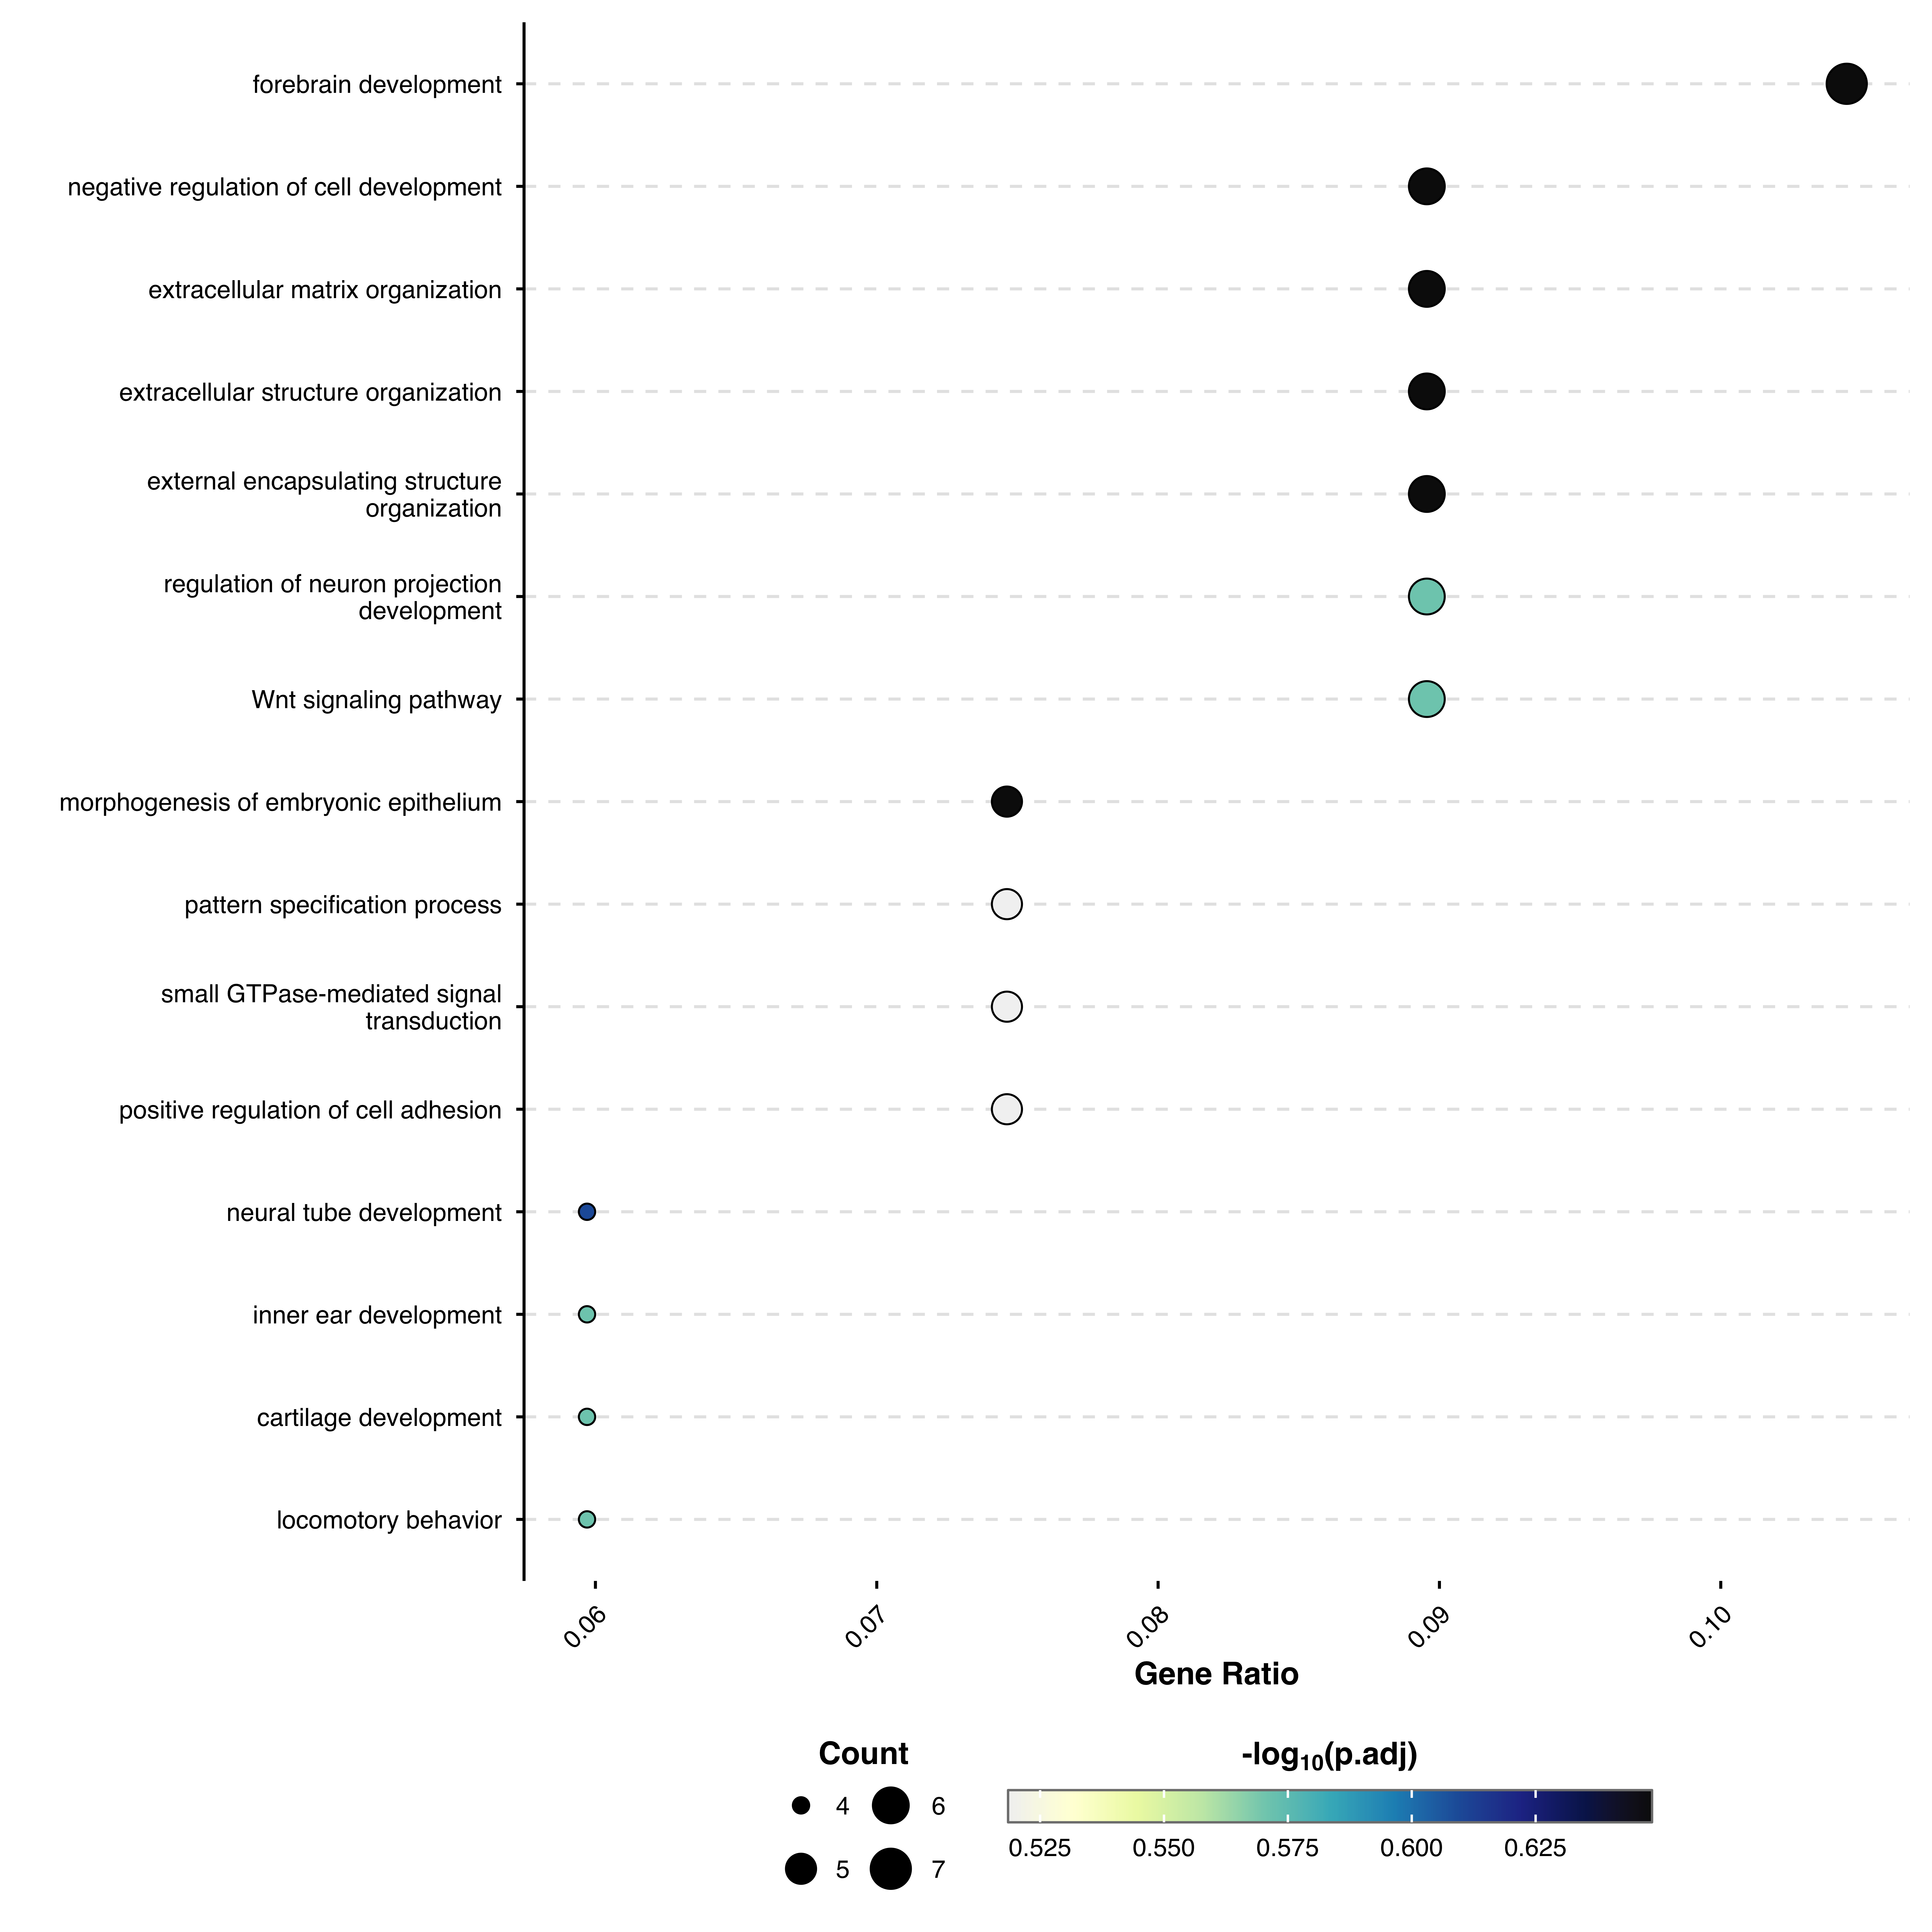
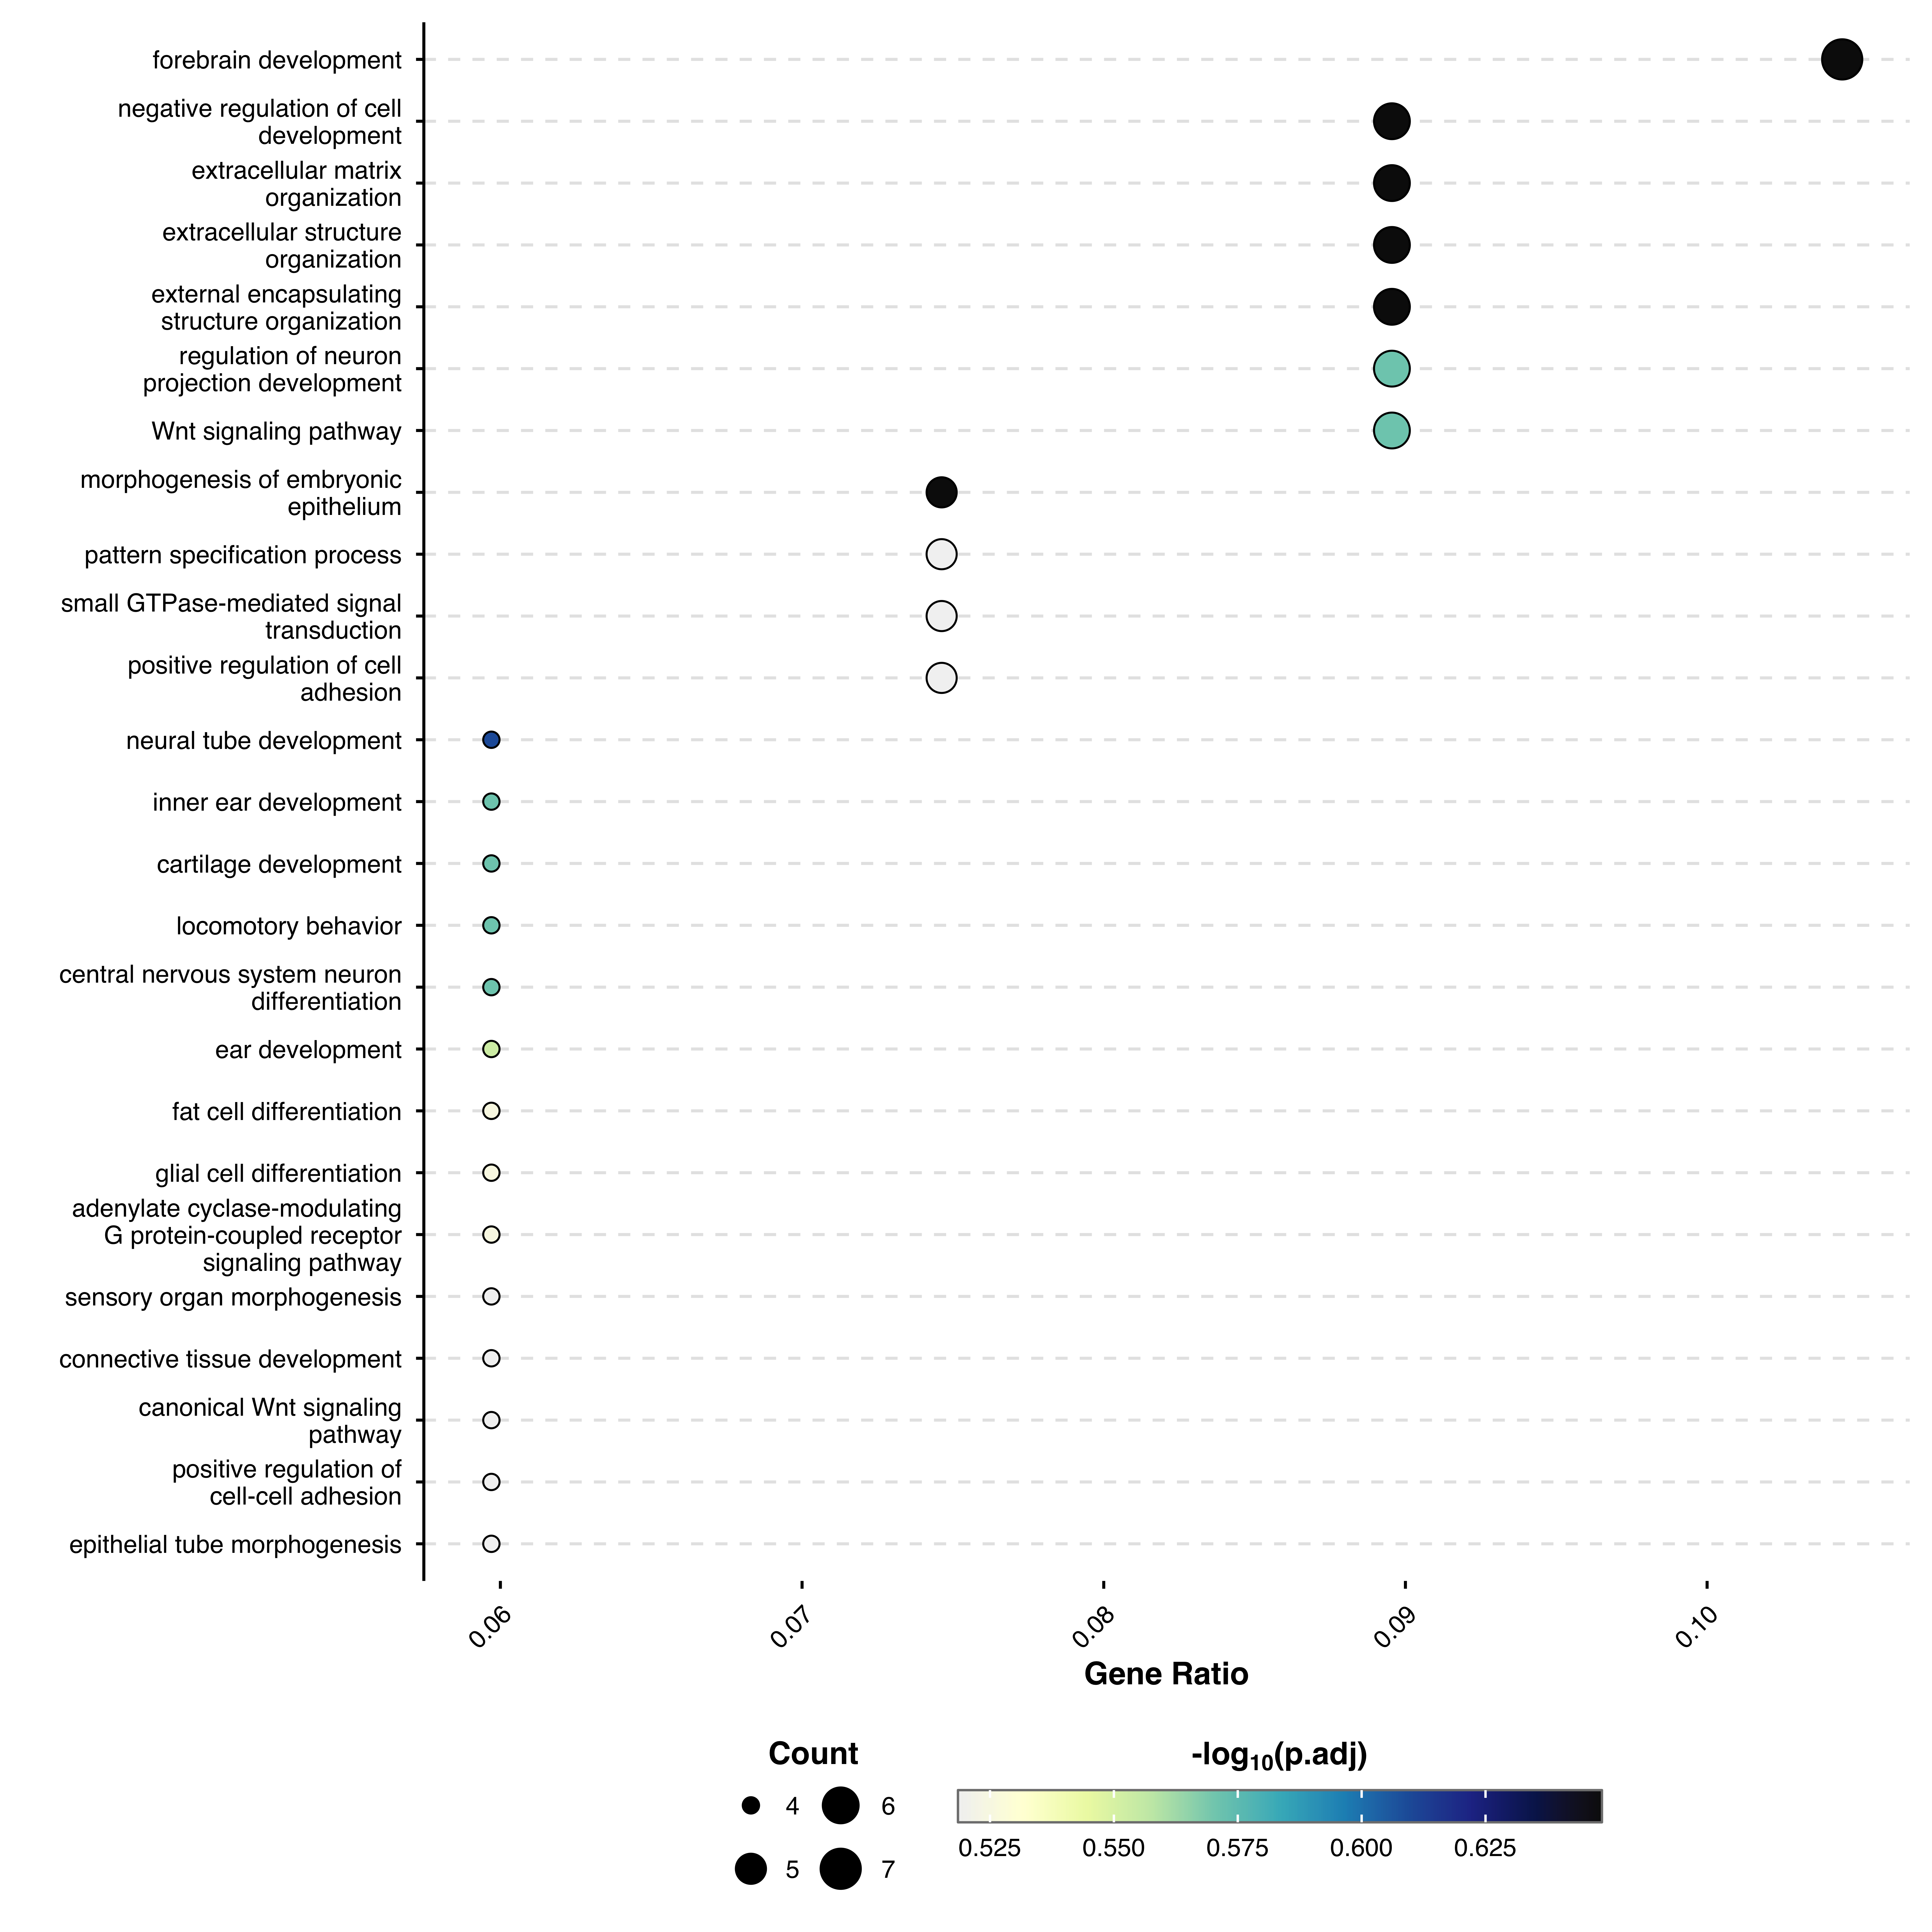
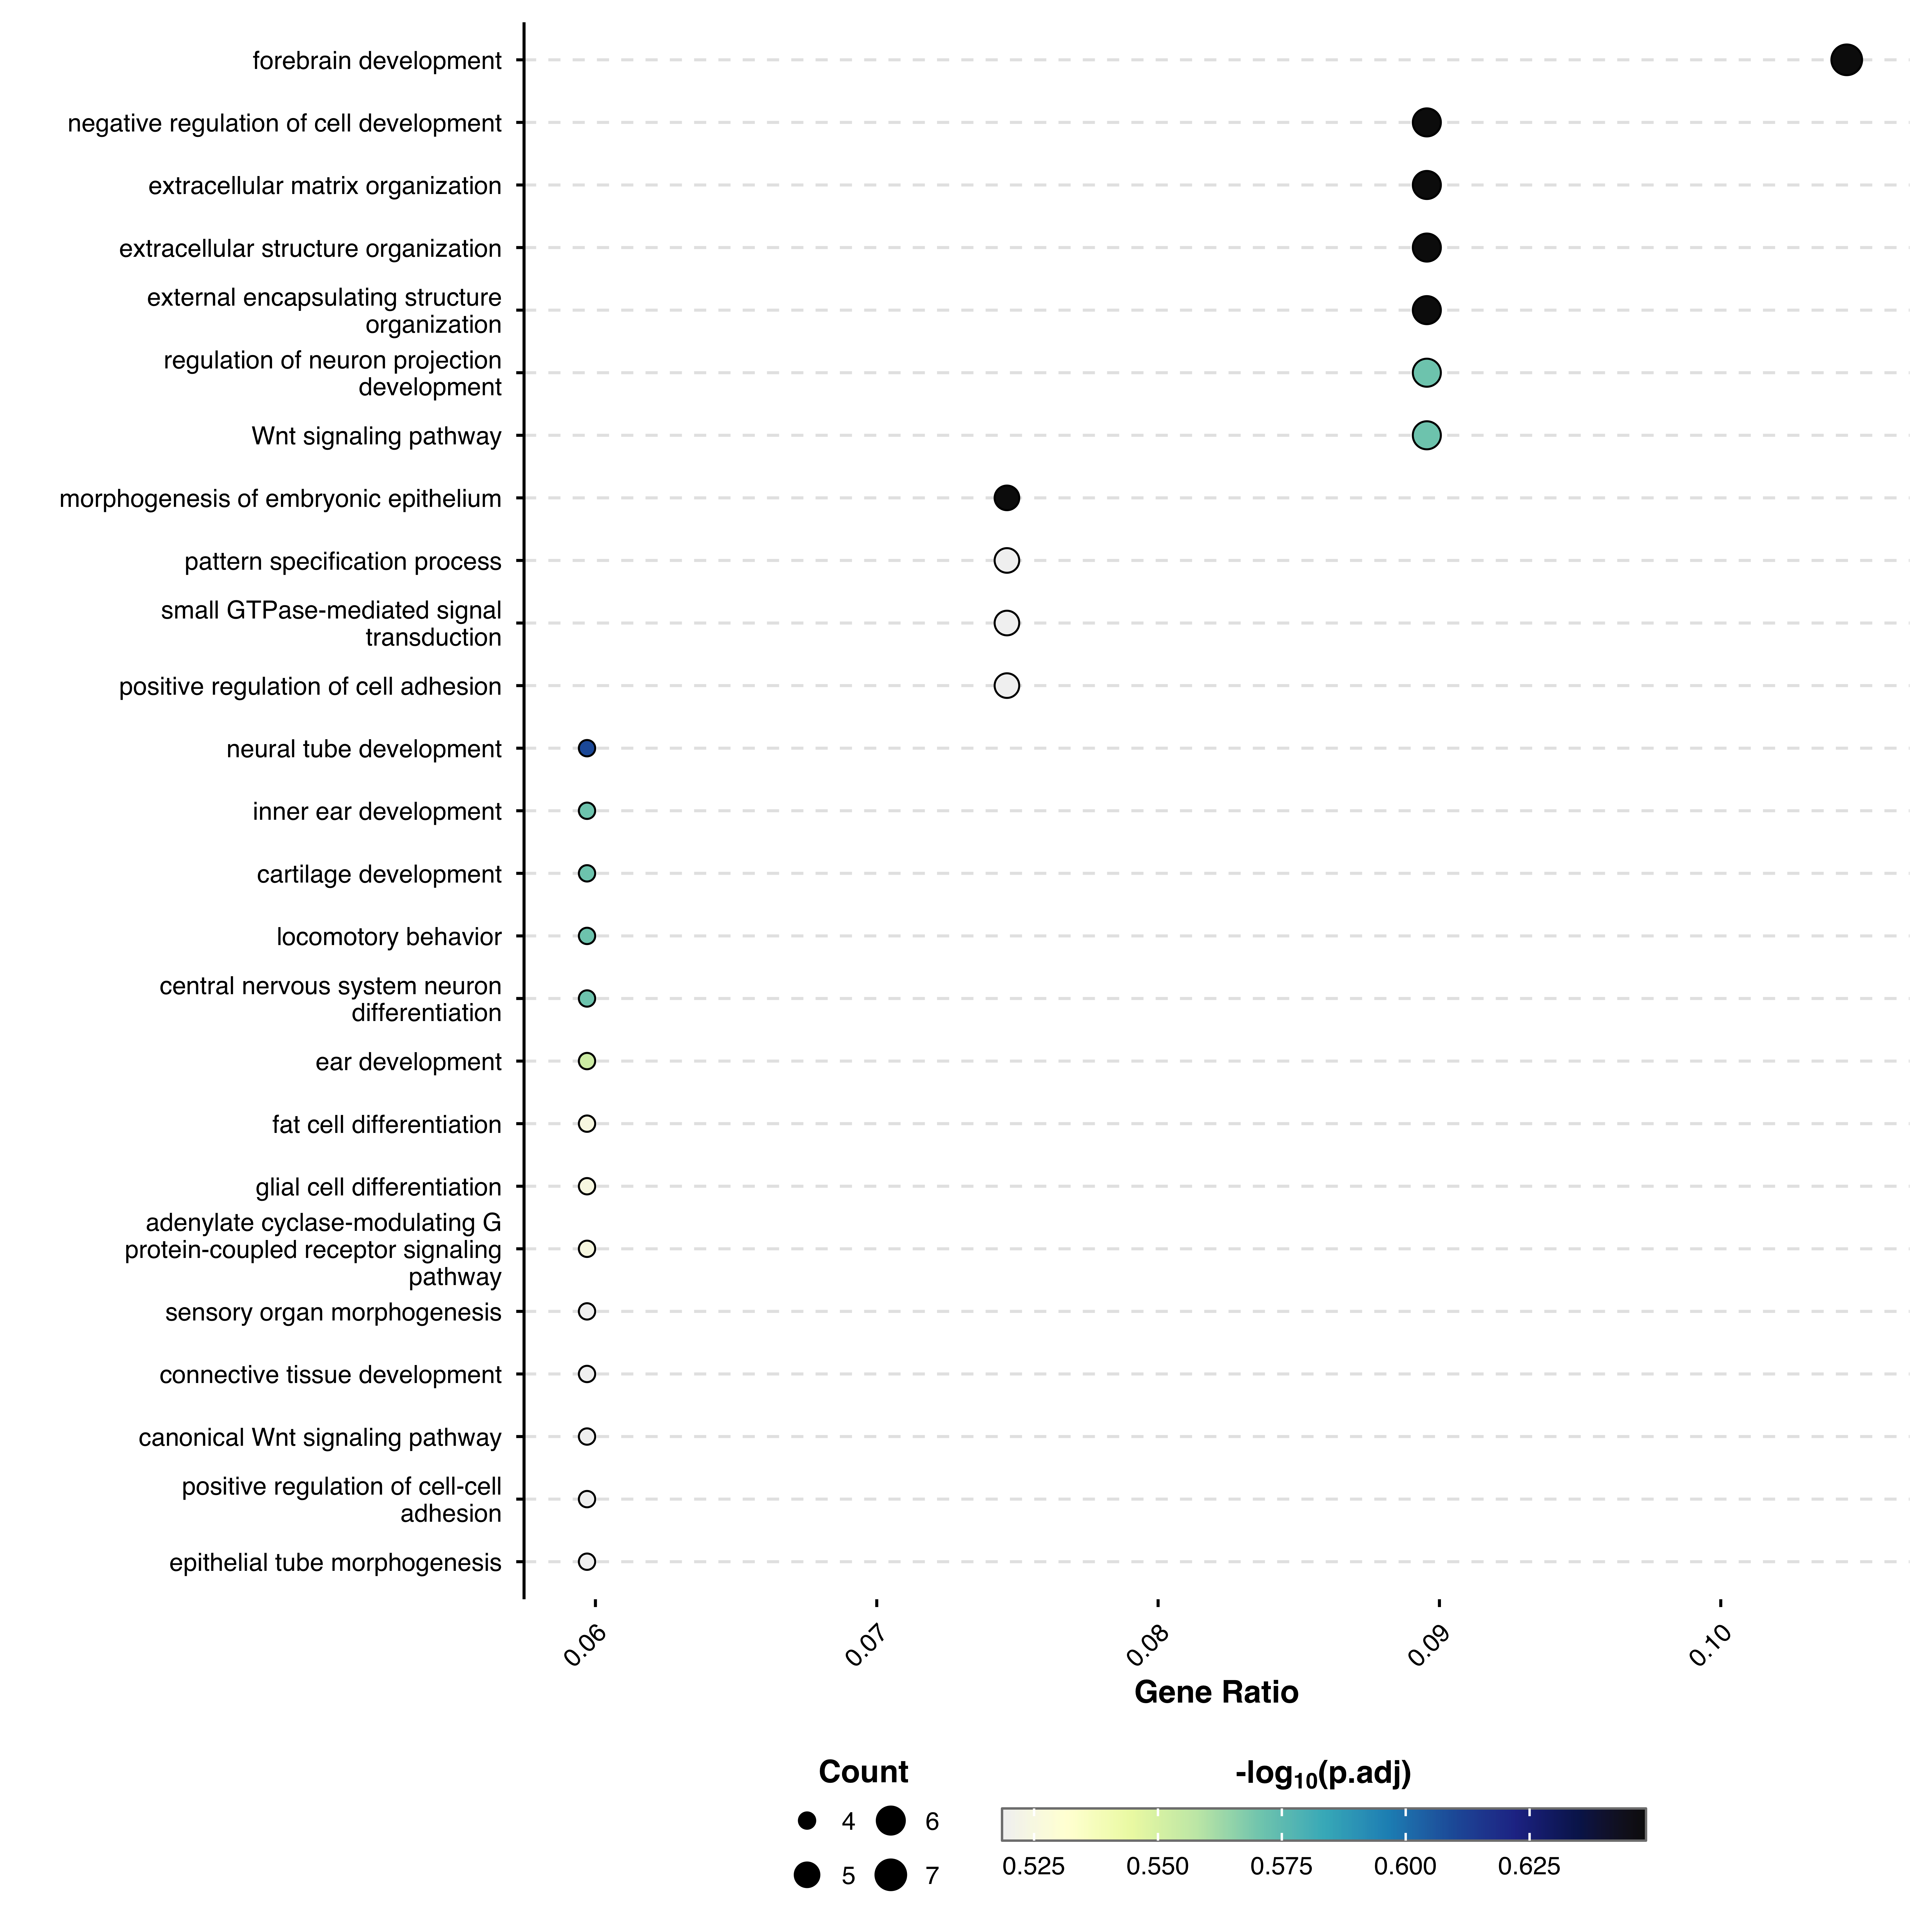
This function visualizes enriched GO terms or pathways from over-representation analysis (e.g., using clusterProfiler). Displays terms as a dot plot with gene count and p-values.
Basic usage
First run enrichment analysis:
# Using clusterProfilerenrichment_result<-clusterProfiler::enrichGO( gene =Seurat::VariableFeatures(sample)[1:100], OrgDb =org.Hs.eg.db, keyType ="SYMBOL", ont ="BP")p<-SCpubr::do_TermEnrichmentPlot(mat =enrichment_result@result)p