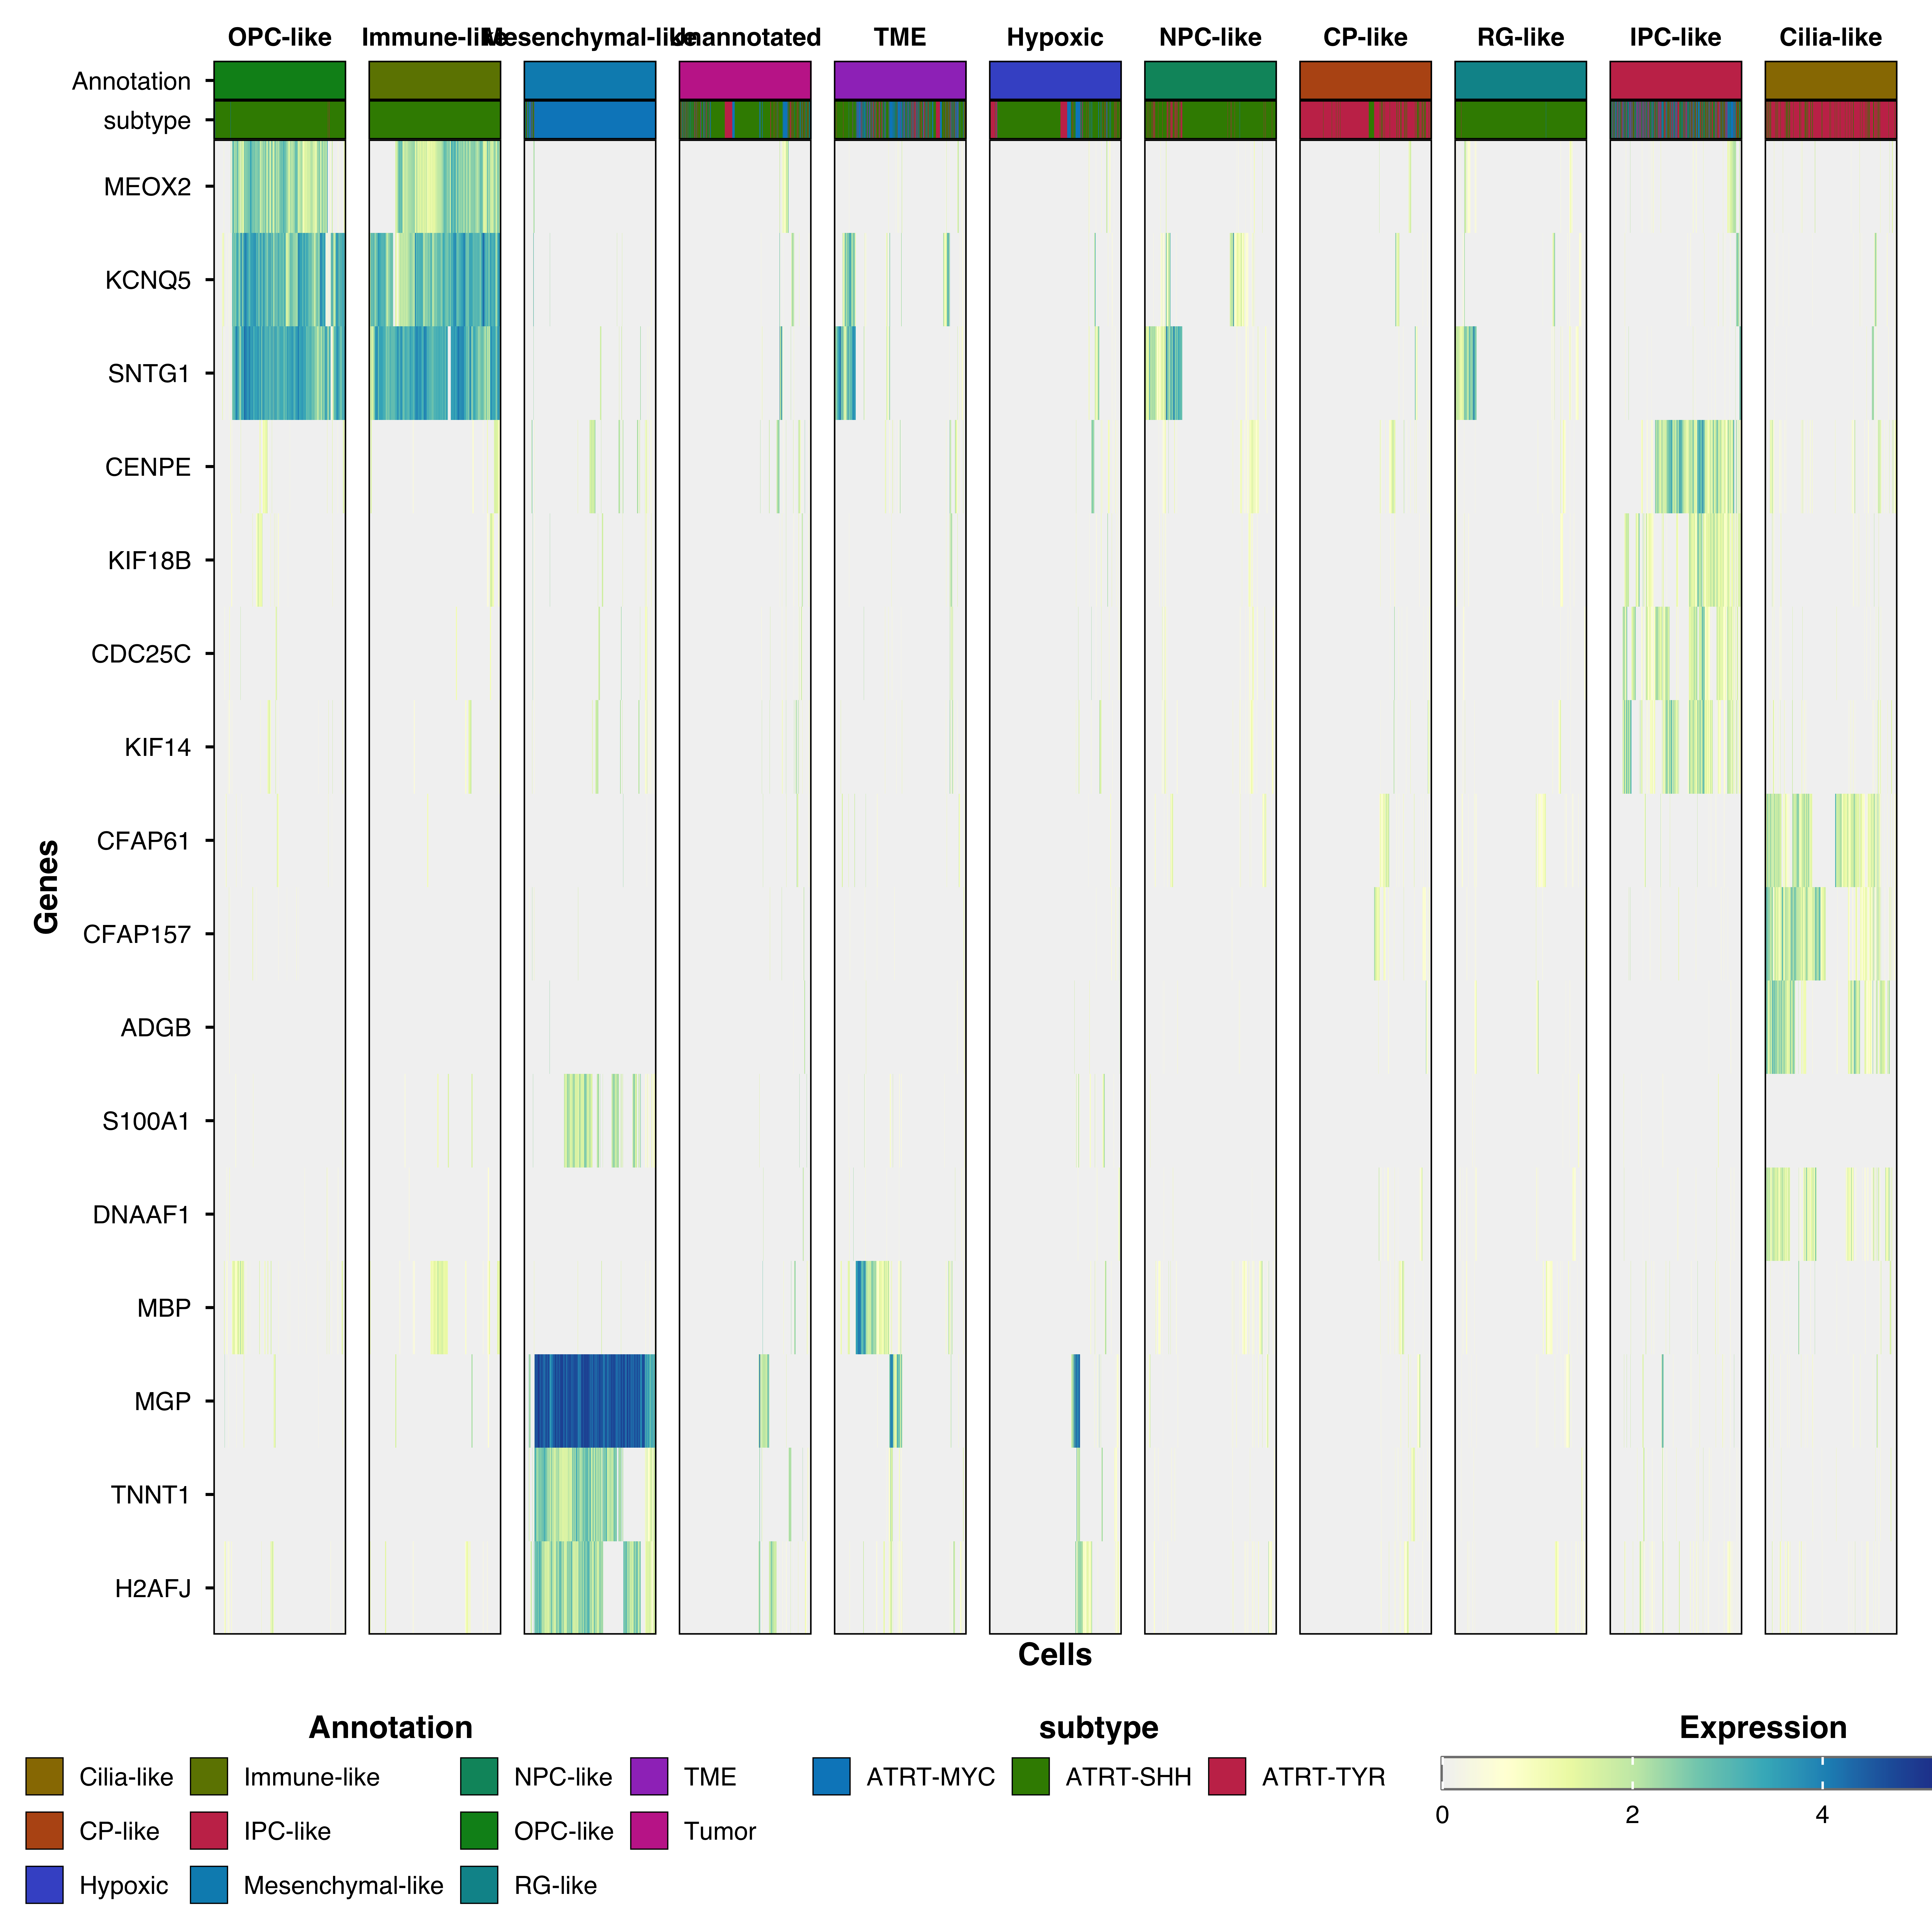
Single-cell expression heatmaps display gene expression at individual cell resolution . Cells are ordered by group, and optional metadata tracks can be added alongside the main heatmap. Inspired by Seurat’s DoHeatmap.
Basic usage
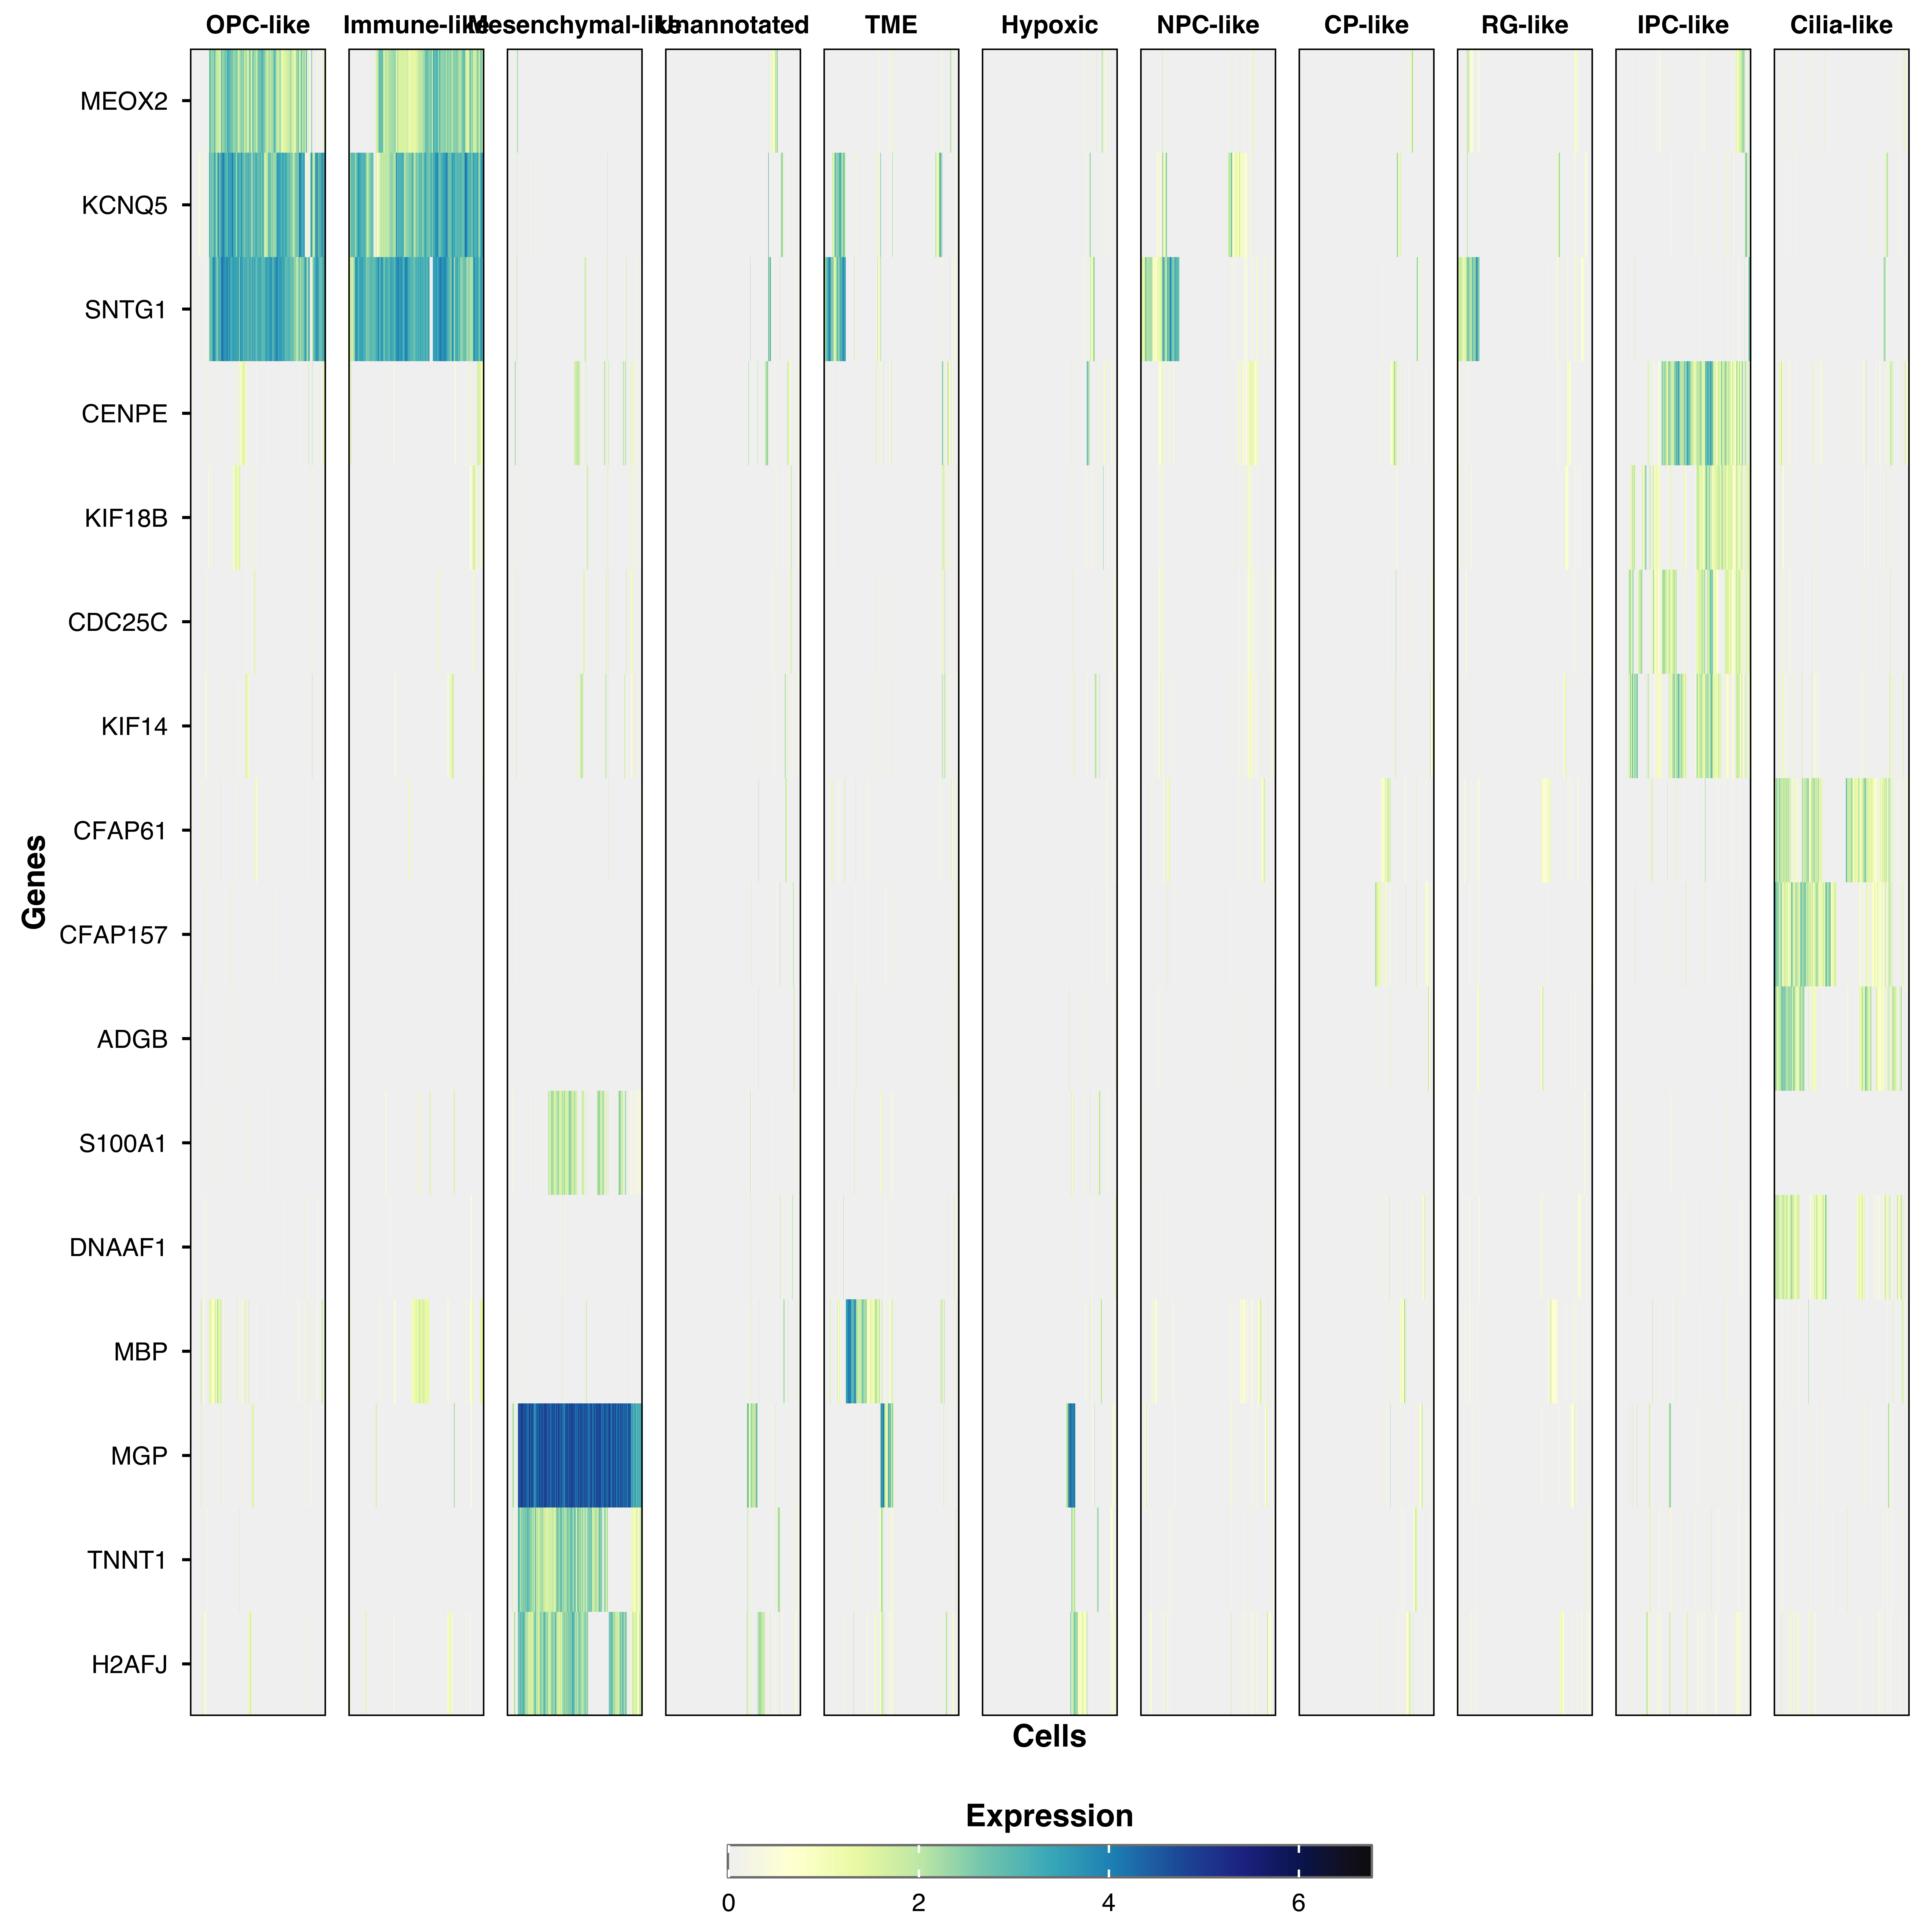
genes <- c ( "CDC25C" , "KIF18B" , "KIF14" , "CENPE" , "DNAAF1" , "ADGB" , "CFAP61" , "CFAP157" ,
"KCNQ5" , "MEOX2" , "MBP" , "SNTG1" ,
"S100A1" , "MGP" , "TNNT1" , "H2AFJ" )
p <- SCpubr :: do_SCExpressionHeatmap ( sample = sample , features = genes )
p
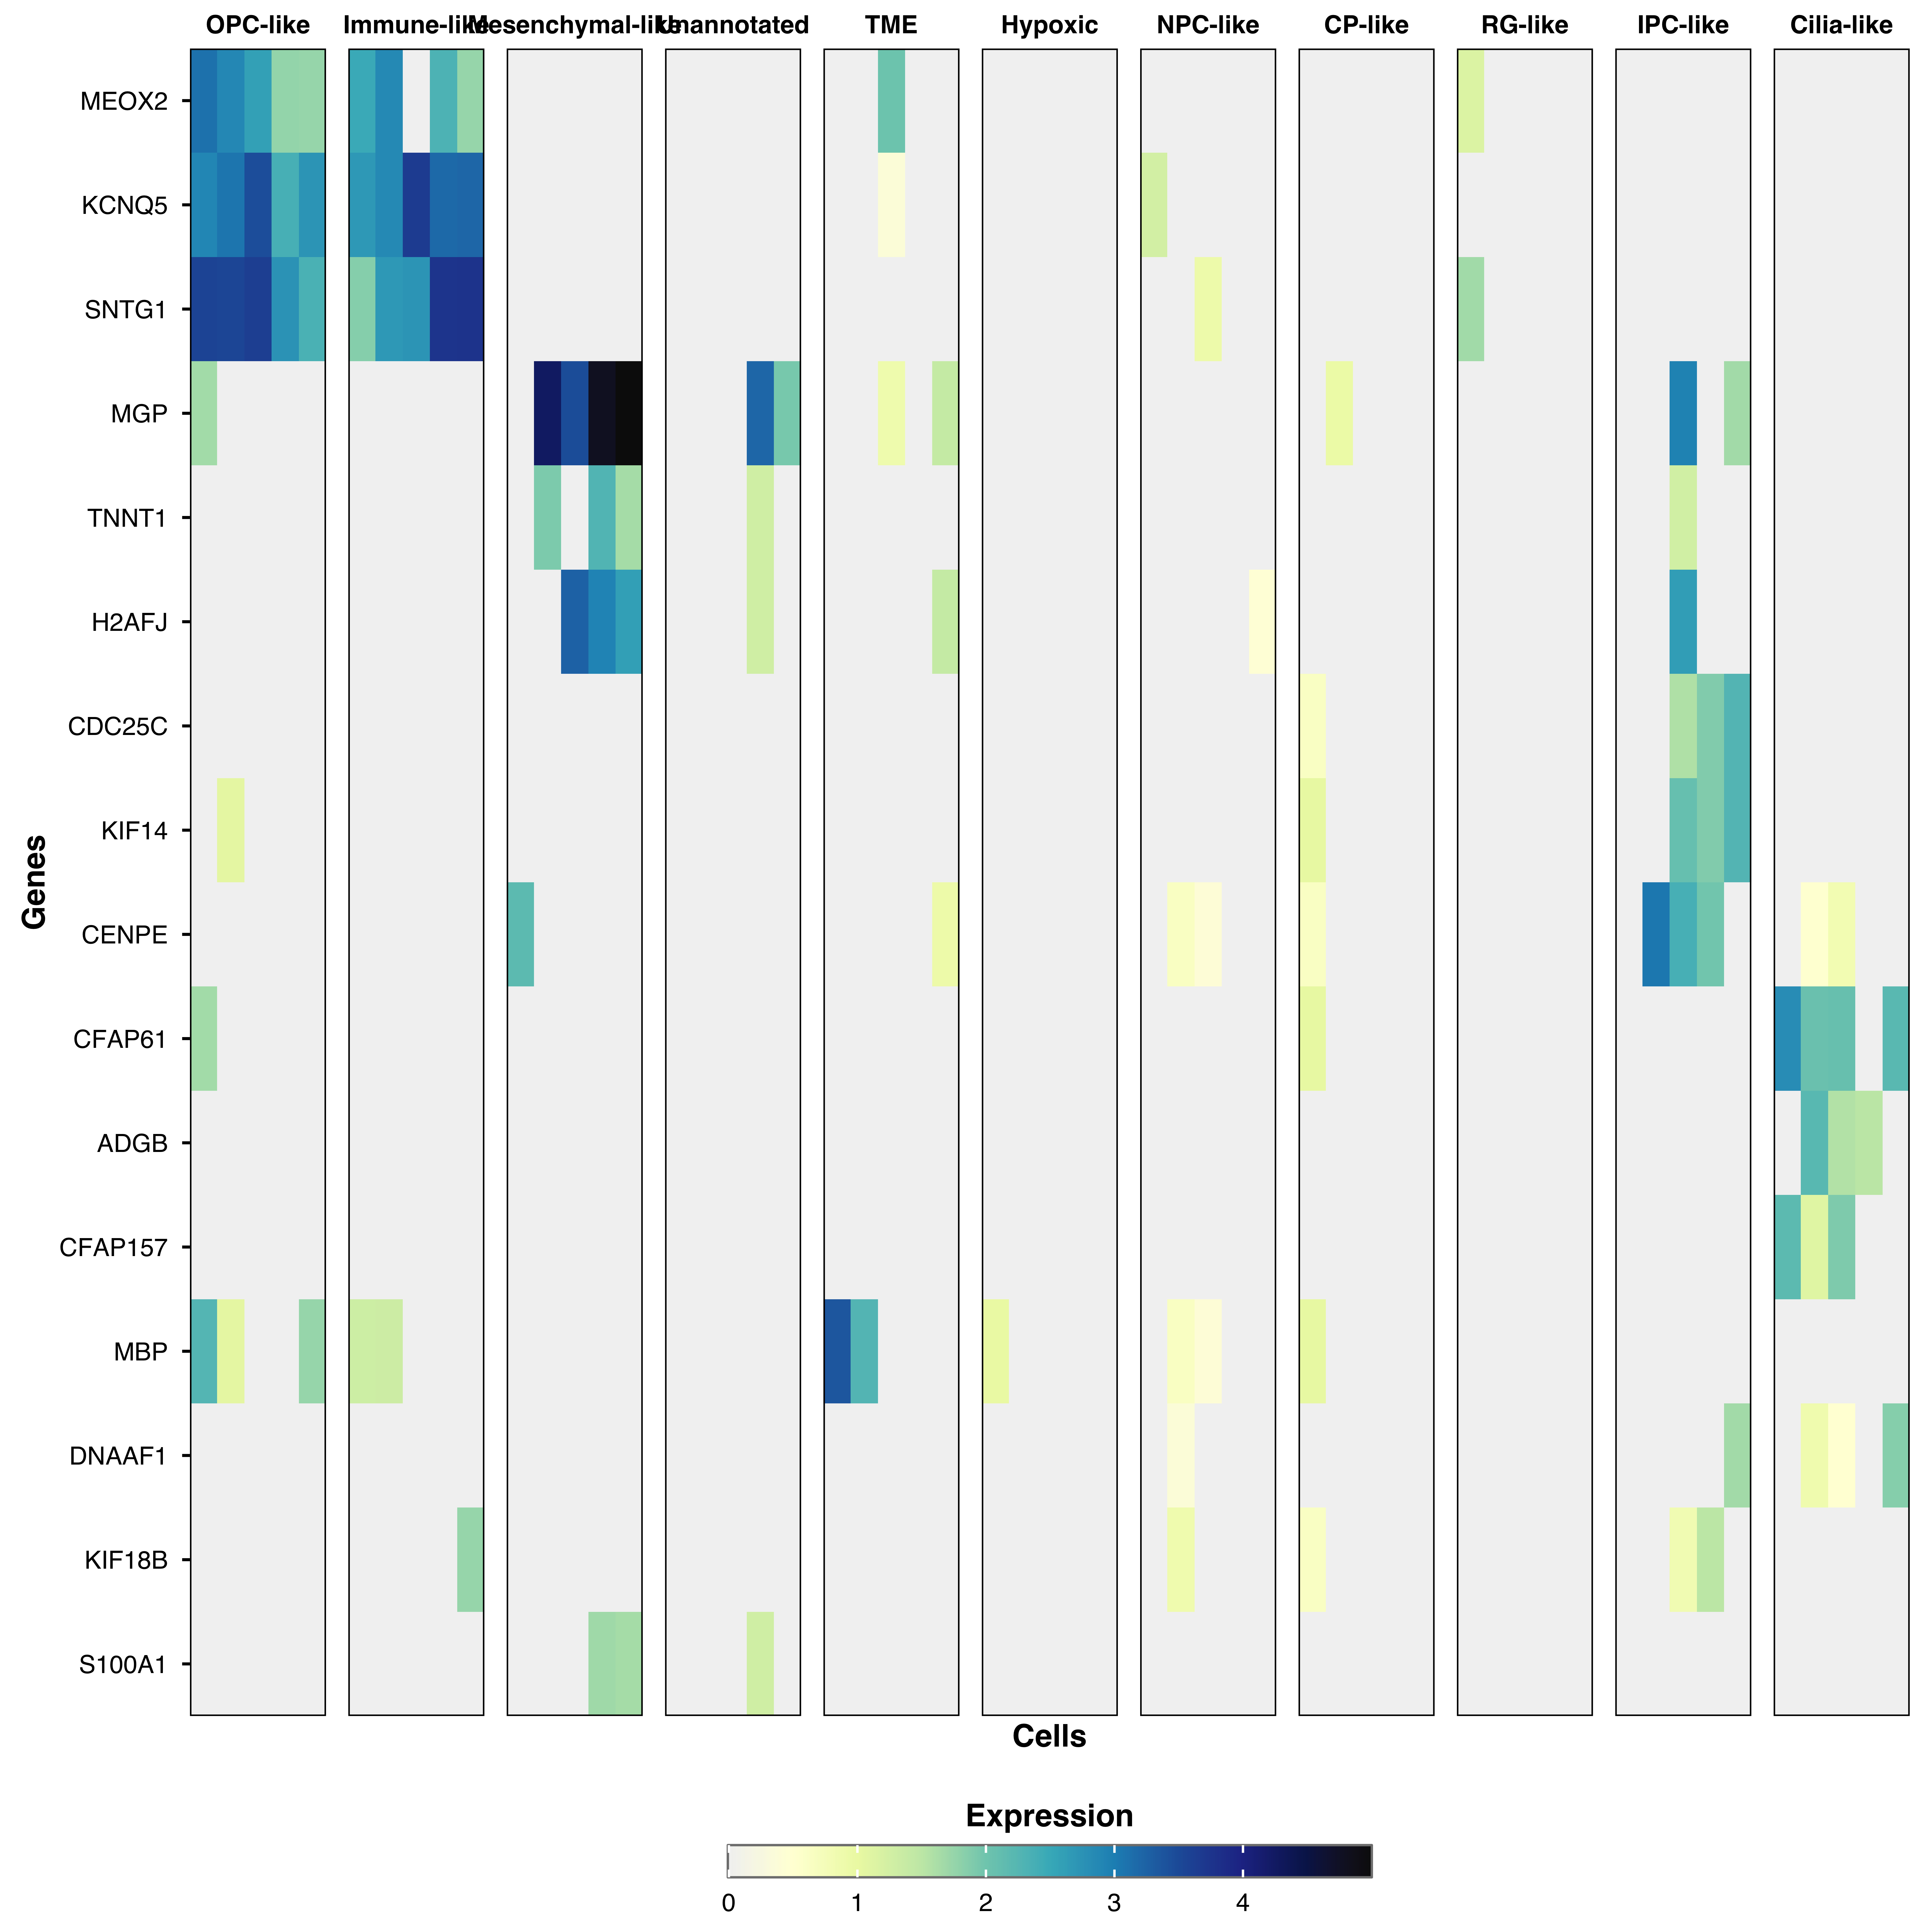
Subsampling
For large datasets, subsample cells to reduce memory and improve rendering:
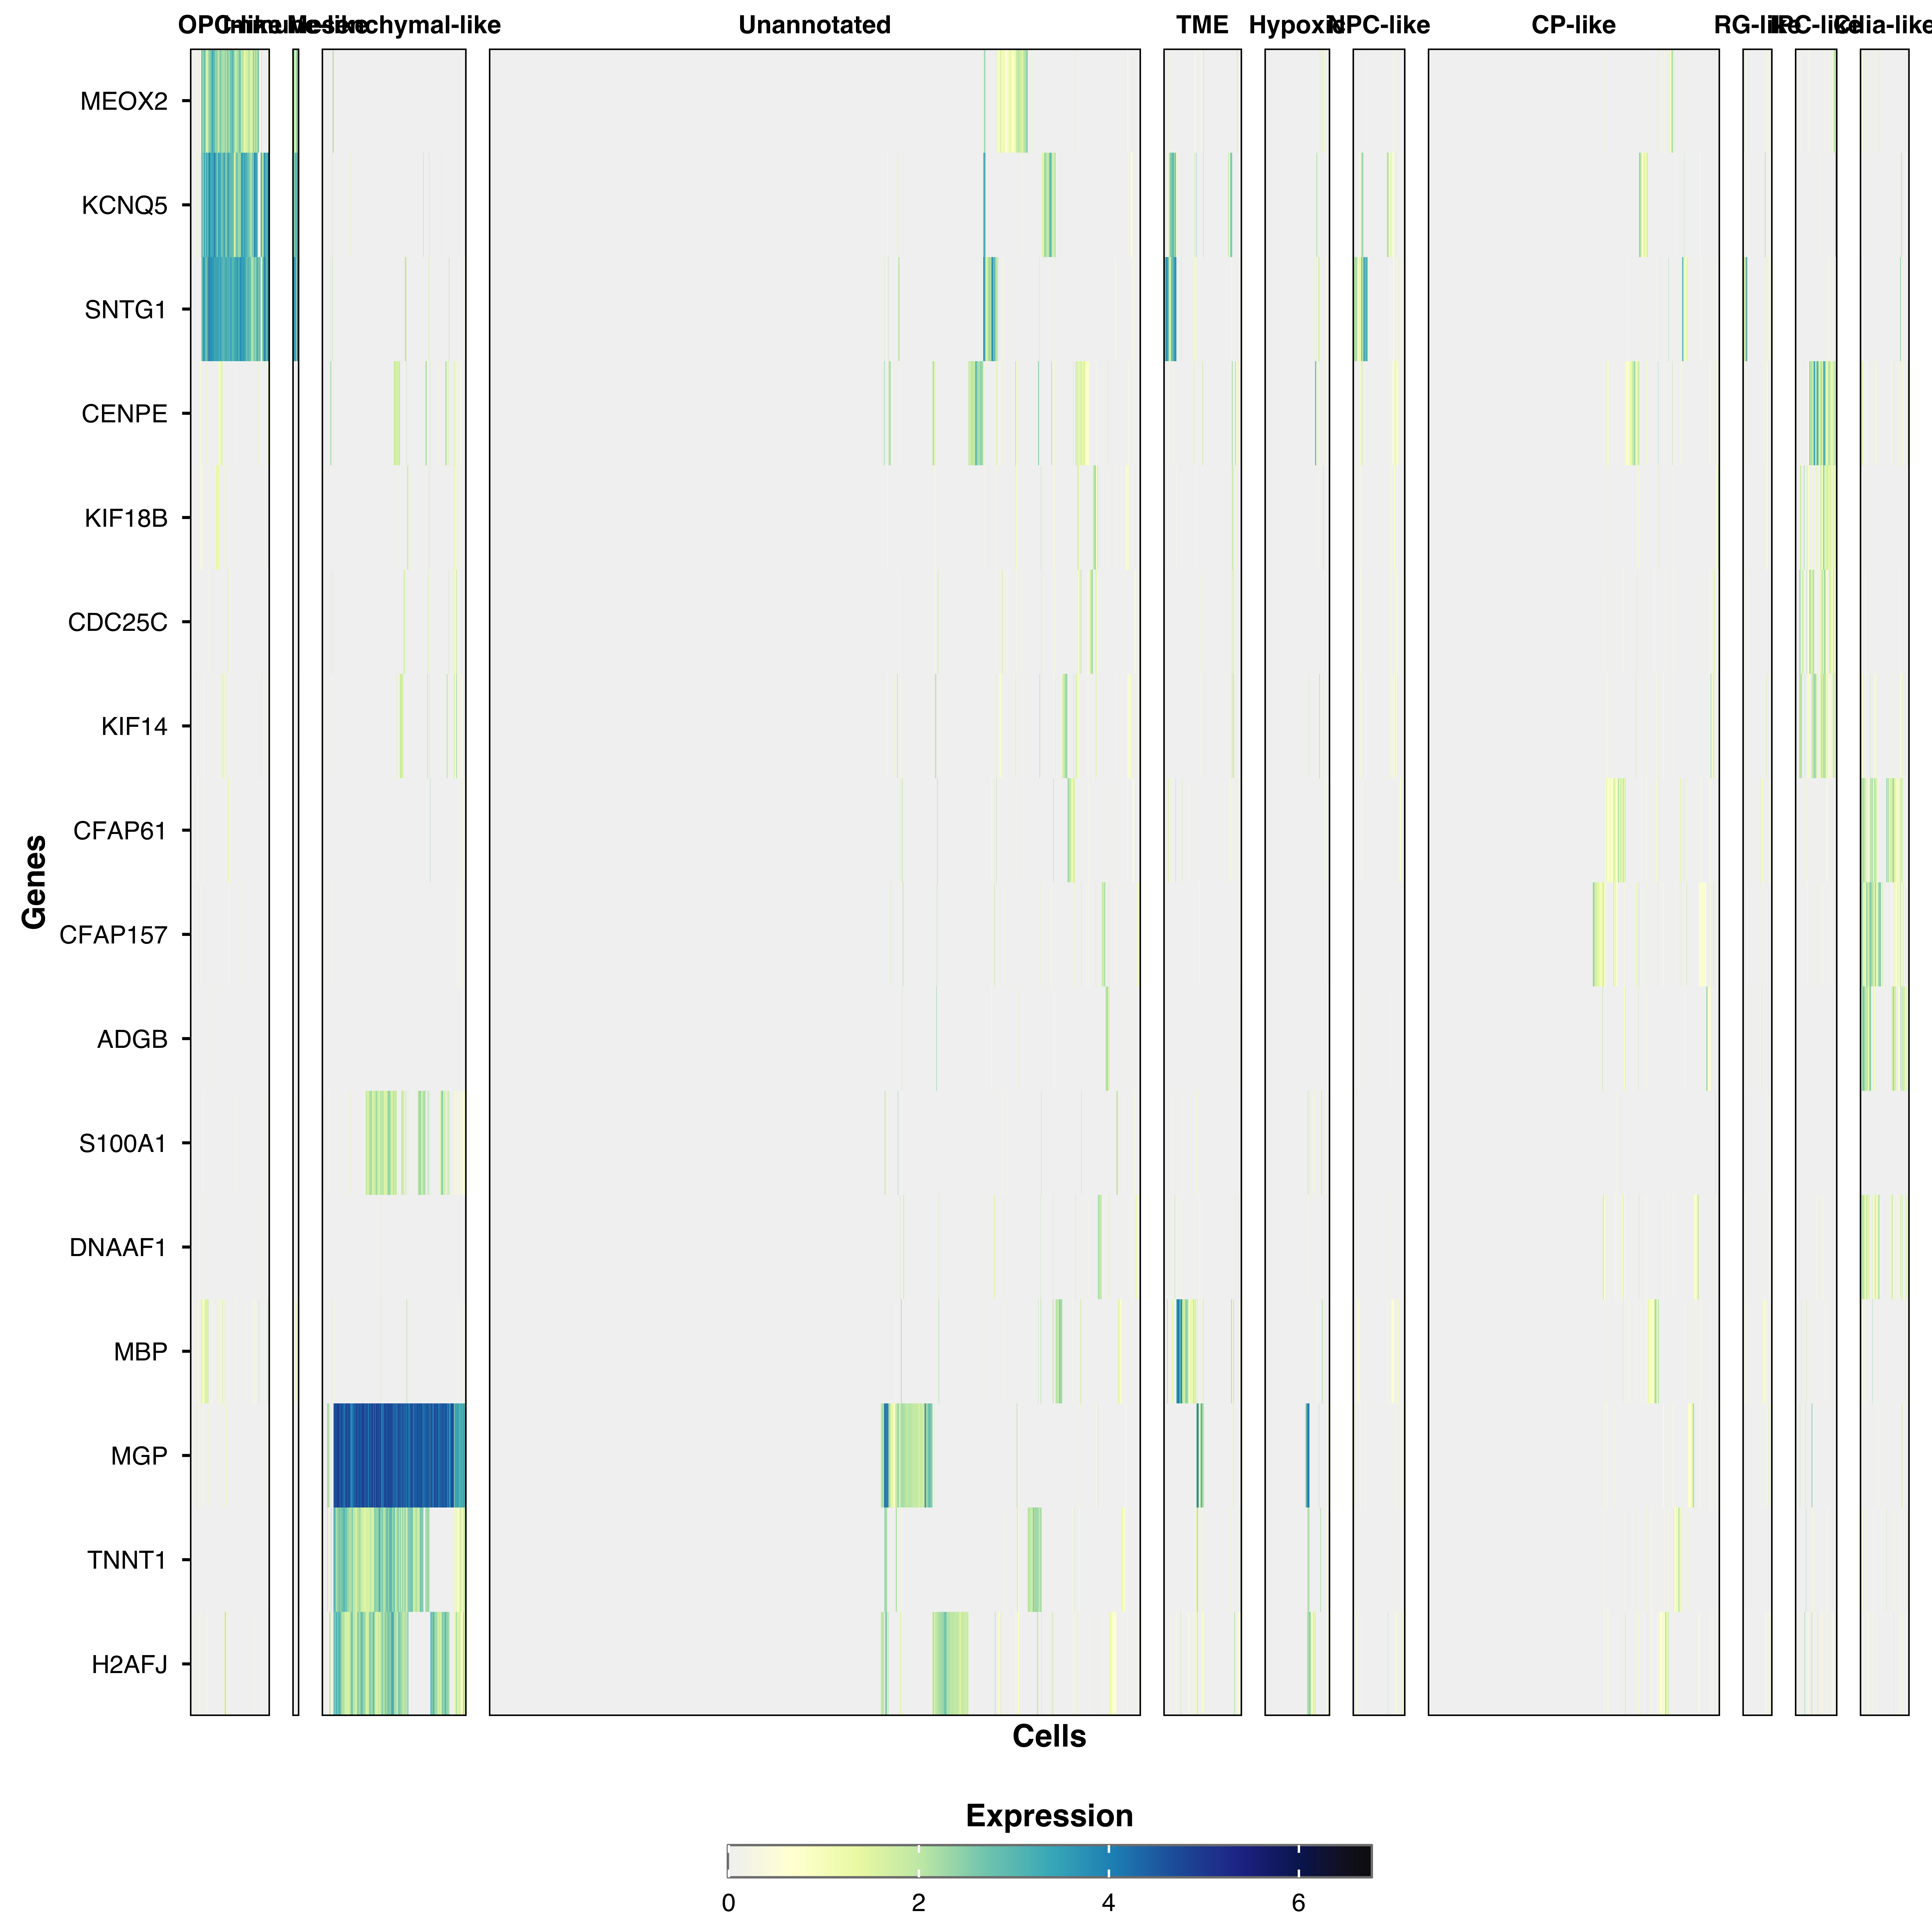
Proportional sizing
Equal space per group (default)
Size proportional to cell count
Interpolation
Smooth the heatmap for rasterized output:
Parameter reference
For parameters shared across many functions (color palettes, typography, legend styling), see Shared features .
Core parameters
featuresGenes to display
—
Layout
proportional.sizeEqual space per group
TRUE
main.heatmap.sizeMain heatmap proportion (0-1)
0.95
strip.spacingSpace between group strips
10
strip.text.angleStrip label rotation
0
Subsampling & clustering
subsampleMax cells per group
NA
clusterCluster genes
TRUE
features.orderCustom gene order
NULL
interpolateSmooth heatmap
FALSE