# Generate a color palette.
SCpubr::do_ColorPalette(colors.use = "steelblue")
#>  [1] "#4682B4" "#464BB4" "#7846B4" "#AF46B4" "#B44682"
#>  [6] "#B4464B" "#B47846" "#B4AF46" "#82B446" "#4BB446"
#> [11] "#46B478" "#46B4AF"Color palettes
Almost as important as the plot itself is the correct choice of colors. For continuous variables, viridis package does wonders. However, when it comes to categorical variables, that have a define set of values, choosing the correct colors can be a very difficult task, normally leading to sub-optimal choices.
Targeting this problem, colortools package was designed by Gaston Sanchez. However, as of 23-06-2022, the package was removed from CRAN, without clear signs of it being restored (as of the date of writing of this section, 13-07-2022). To cover its functionally, SCpubr has a function called SCpubr::do_ColorPalette(), which recapitulates the most critical functionalities from the package. The core of the code and functionality belongs to Gaston Sanchez, and the source code can be found in colortools’ GitHub. The plotting and complete report functionalities are SCpubr’s additions to the code.
Generate color palettes
The simplest way to generate a color palette with SCpubr::do_ColorPalette() is to provide a single color to colors.use parameter. It is important to remark that only one color has to be provided. The function iterates over the whole range of HUE values and generate equally spaced colors.
By default, it returns 12 colors, but this can be changed by using n parameter.
# Generate a color palette with a given number of colors.
SCpubr::do_ColorPalette(colors.use = "steelblue",
                        n = 7)
#> [1] "#4682B4" "#6846B4" "#B446A1" "#B44946" "#B4A746"
#> [6] "#63B446" "#46B488"
Just having the colors as a vector is great to use them right away in other plotting functions. However, one can visualize how the colors look like by using plot = TRUE.
# Generate a color palette and plot it.
p <- SCpubr::do_ColorPalette(colors.use = "steelblue",
                             plot = TRUE)

p
Generate combination of colors
Other times, one might just want a given combination of colors, following the color theory. For this different parameters can be used. Using them will force n to be 12, so do not use n parameter alongside them, as it will have no effect.
Opposite colors
# Generate opposite colors.
p <- SCpubr::do_ColorPalette(colors.use = "steelblue",
                             opposite = TRUE,
                             plot = TRUE)

p
Adjacent colors
# Generate adjacent colors.
p <- SCpubr::do_ColorPalette(colors.use = "steelblue",
                             adjacent = TRUE,
                             plot = TRUE)

p
Triadic colors
# Generate triadic colors.
p <- SCpubr::do_ColorPalette(colors.use = "steelblue",
                             triadic = TRUE,
                             plot = TRUE)

p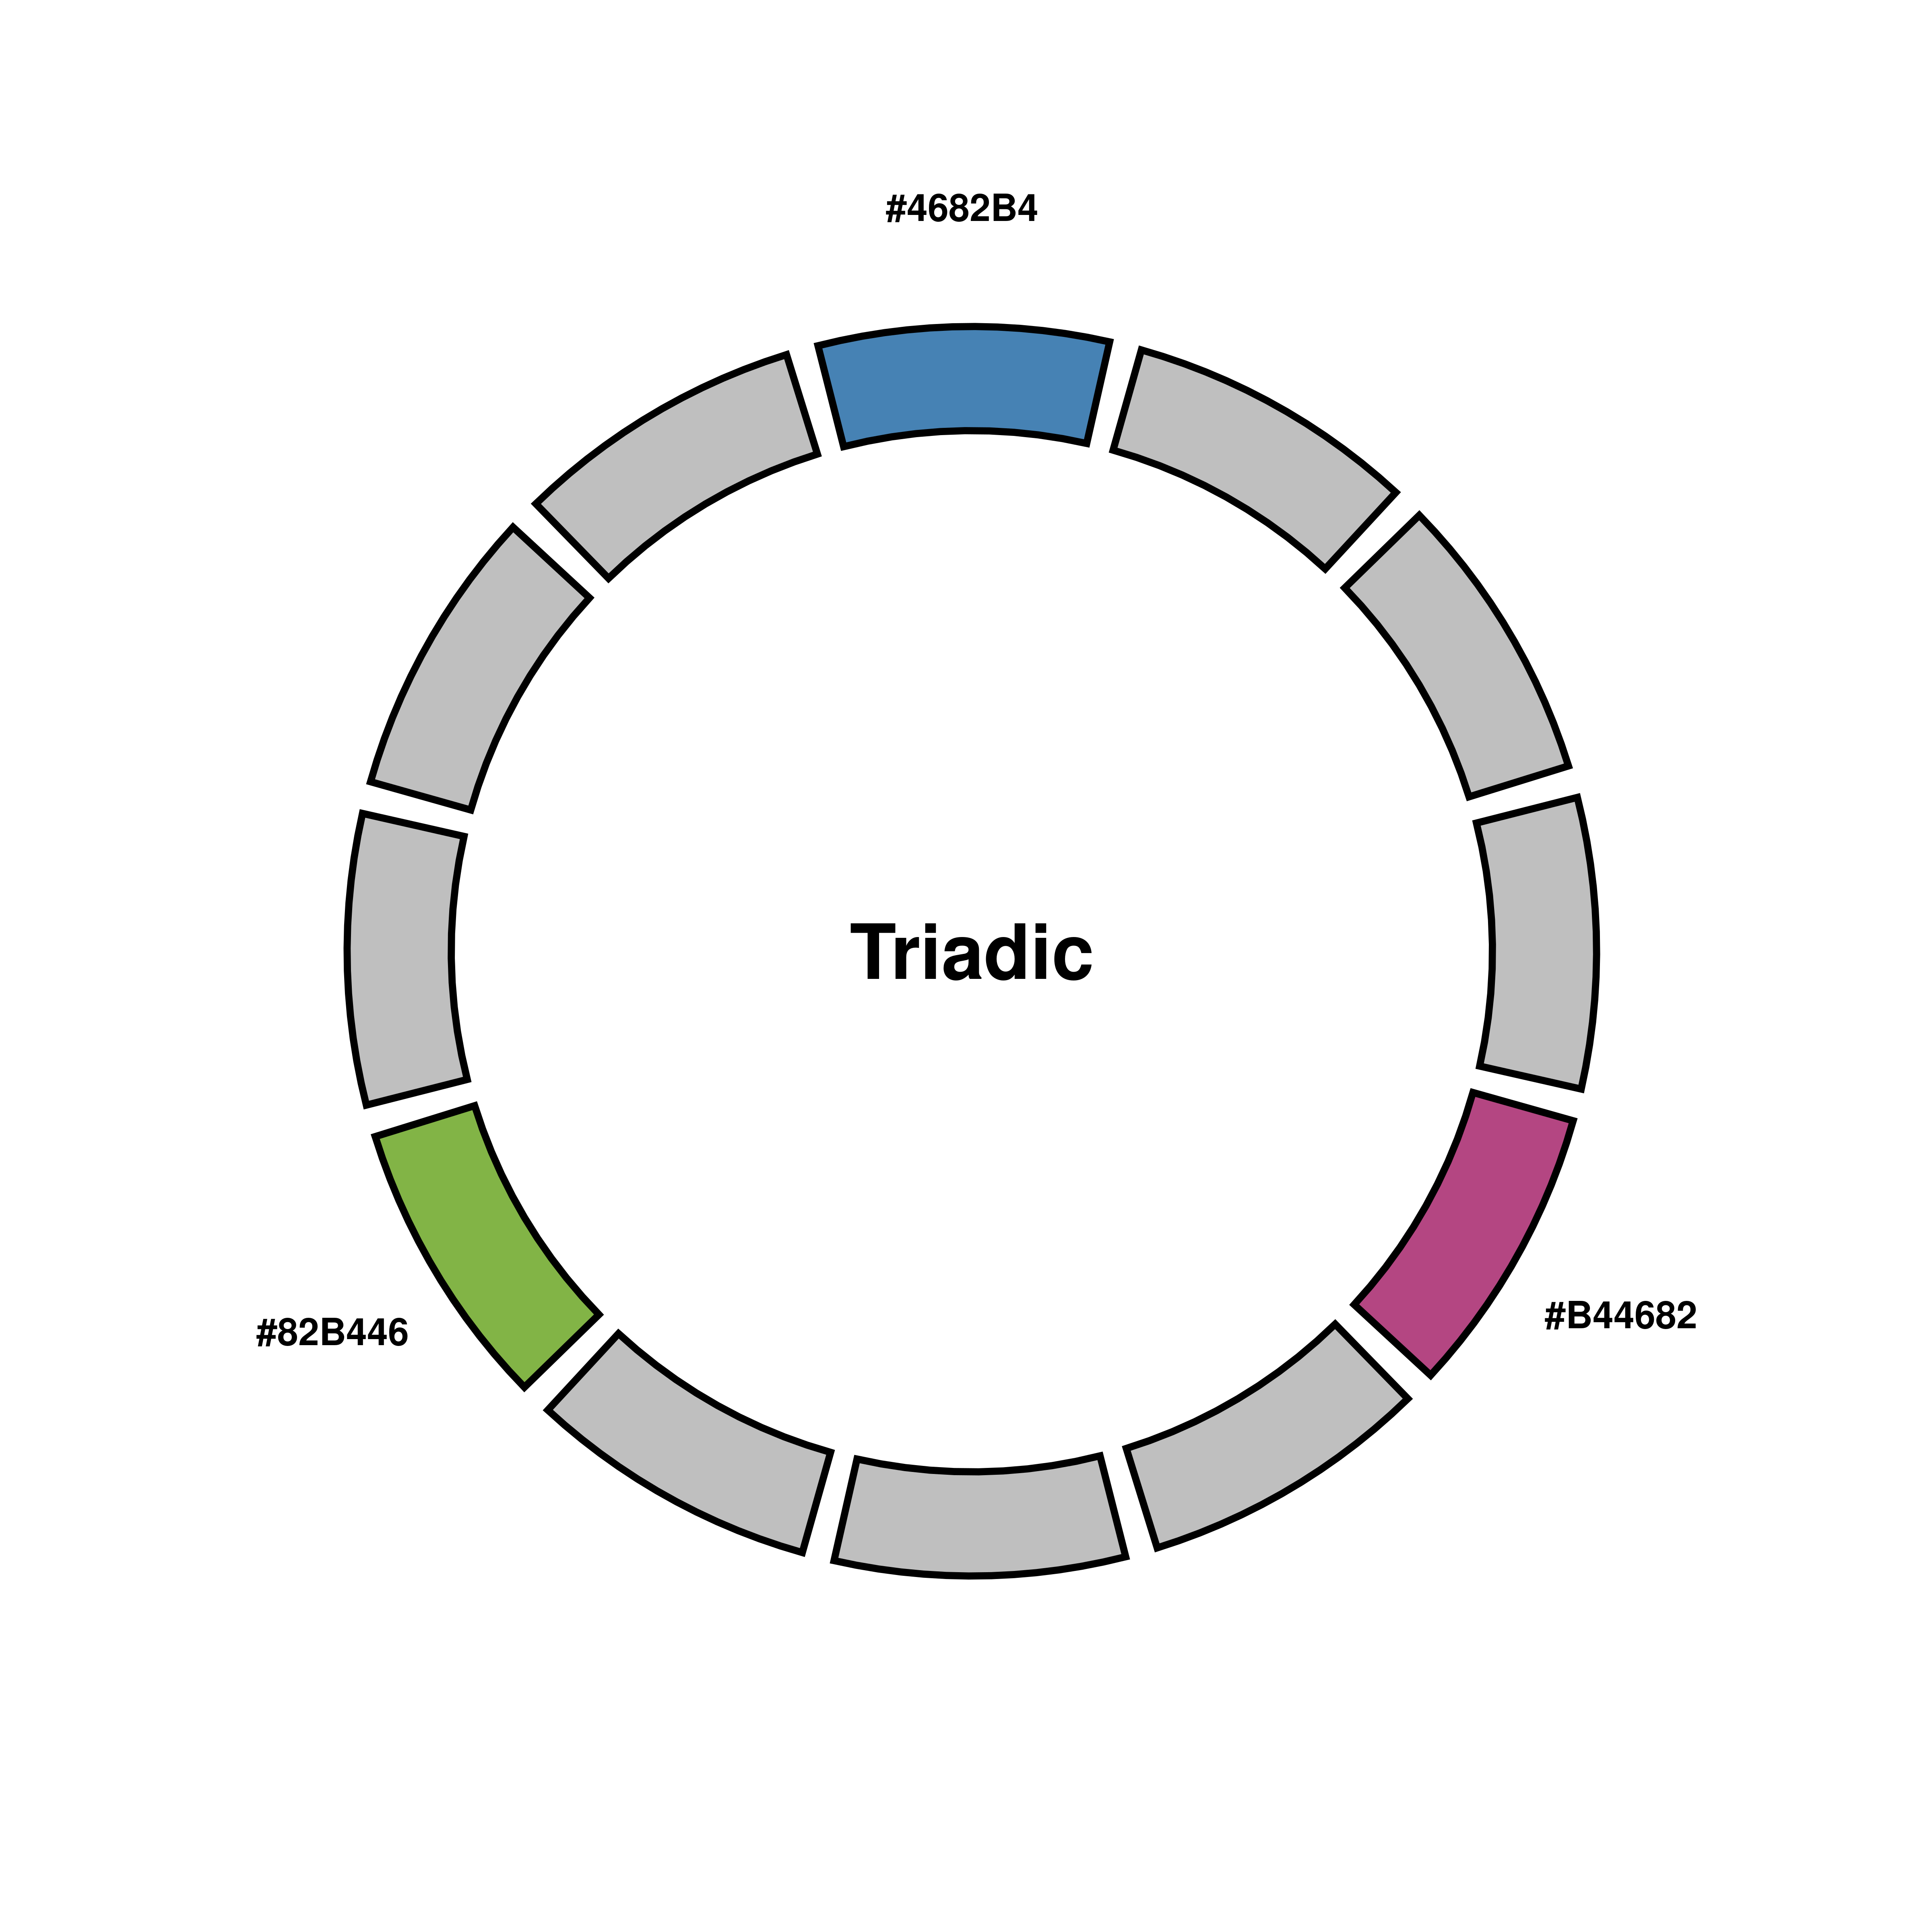
Split complementary colors.
# Generate split complementary colors.
p <- SCpubr::do_ColorPalette(colors.use = "steelblue",
                             split_complementary = TRUE,
                             plot = TRUE)

p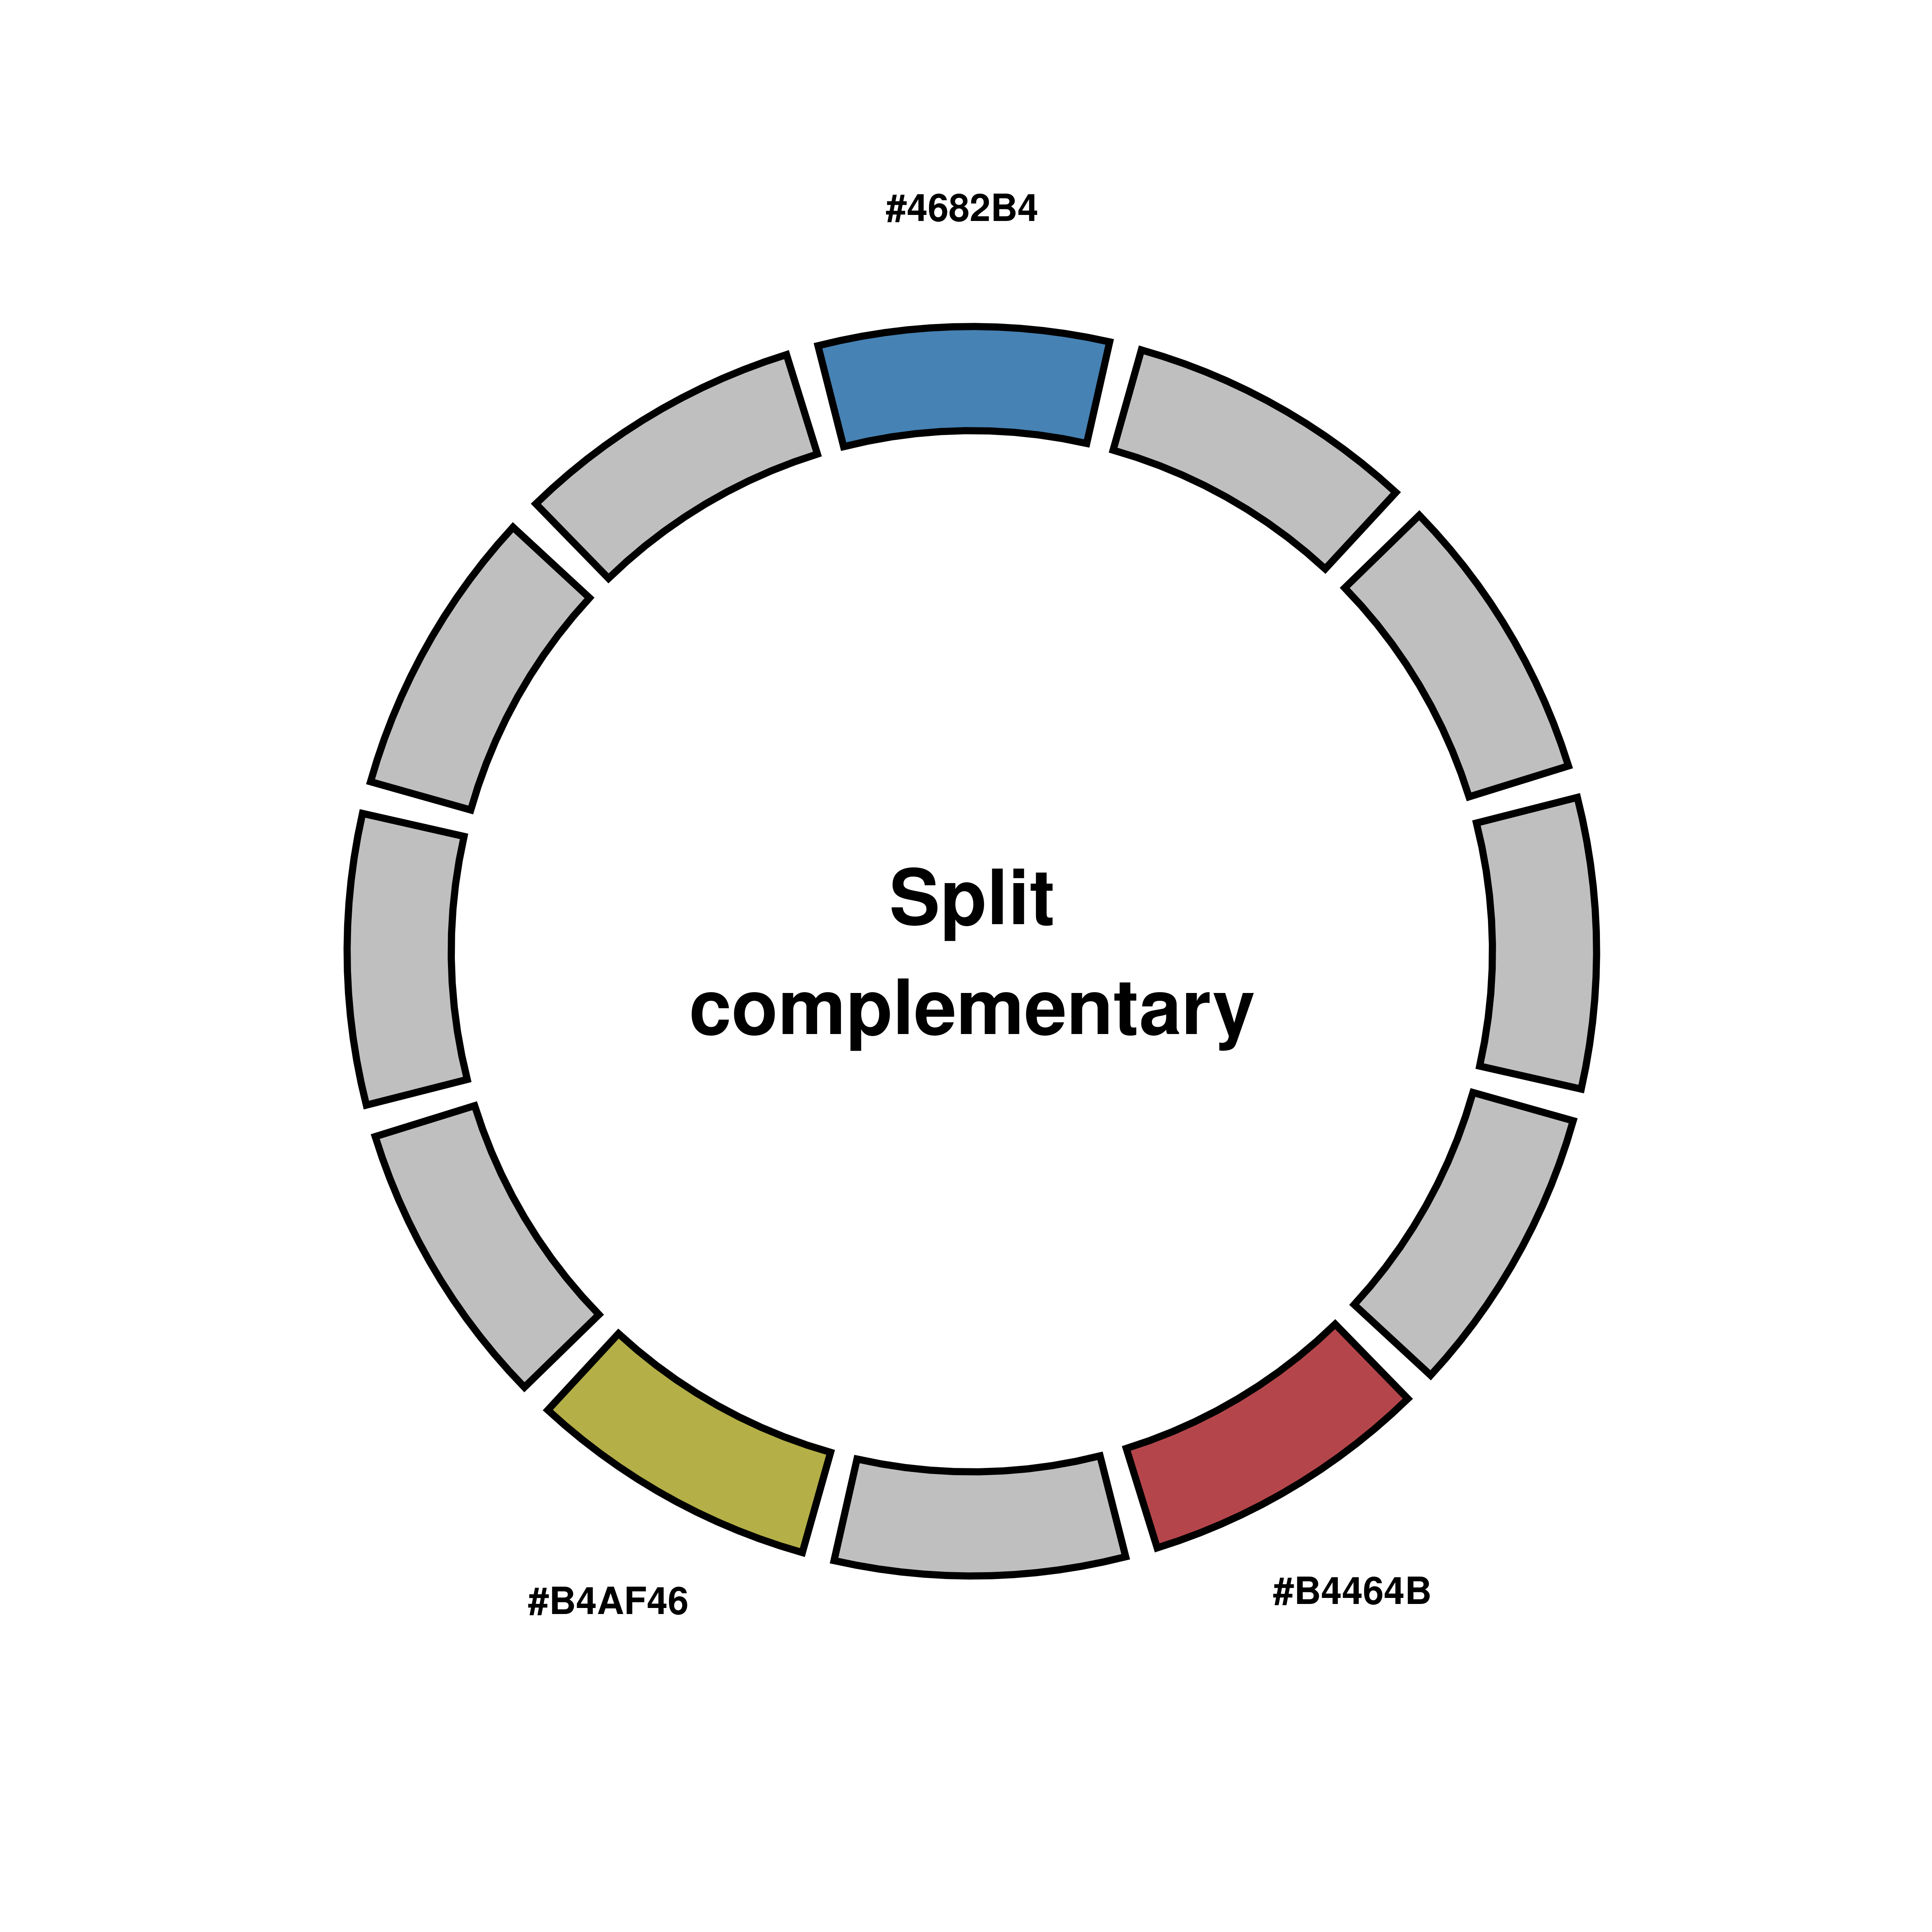
Tetradic colors
# Generate tetradic colors
p <- SCpubr::do_ColorPalette(colors.use = "steelblue",
                             tetradic = TRUE,
                             plot = TRUE)

p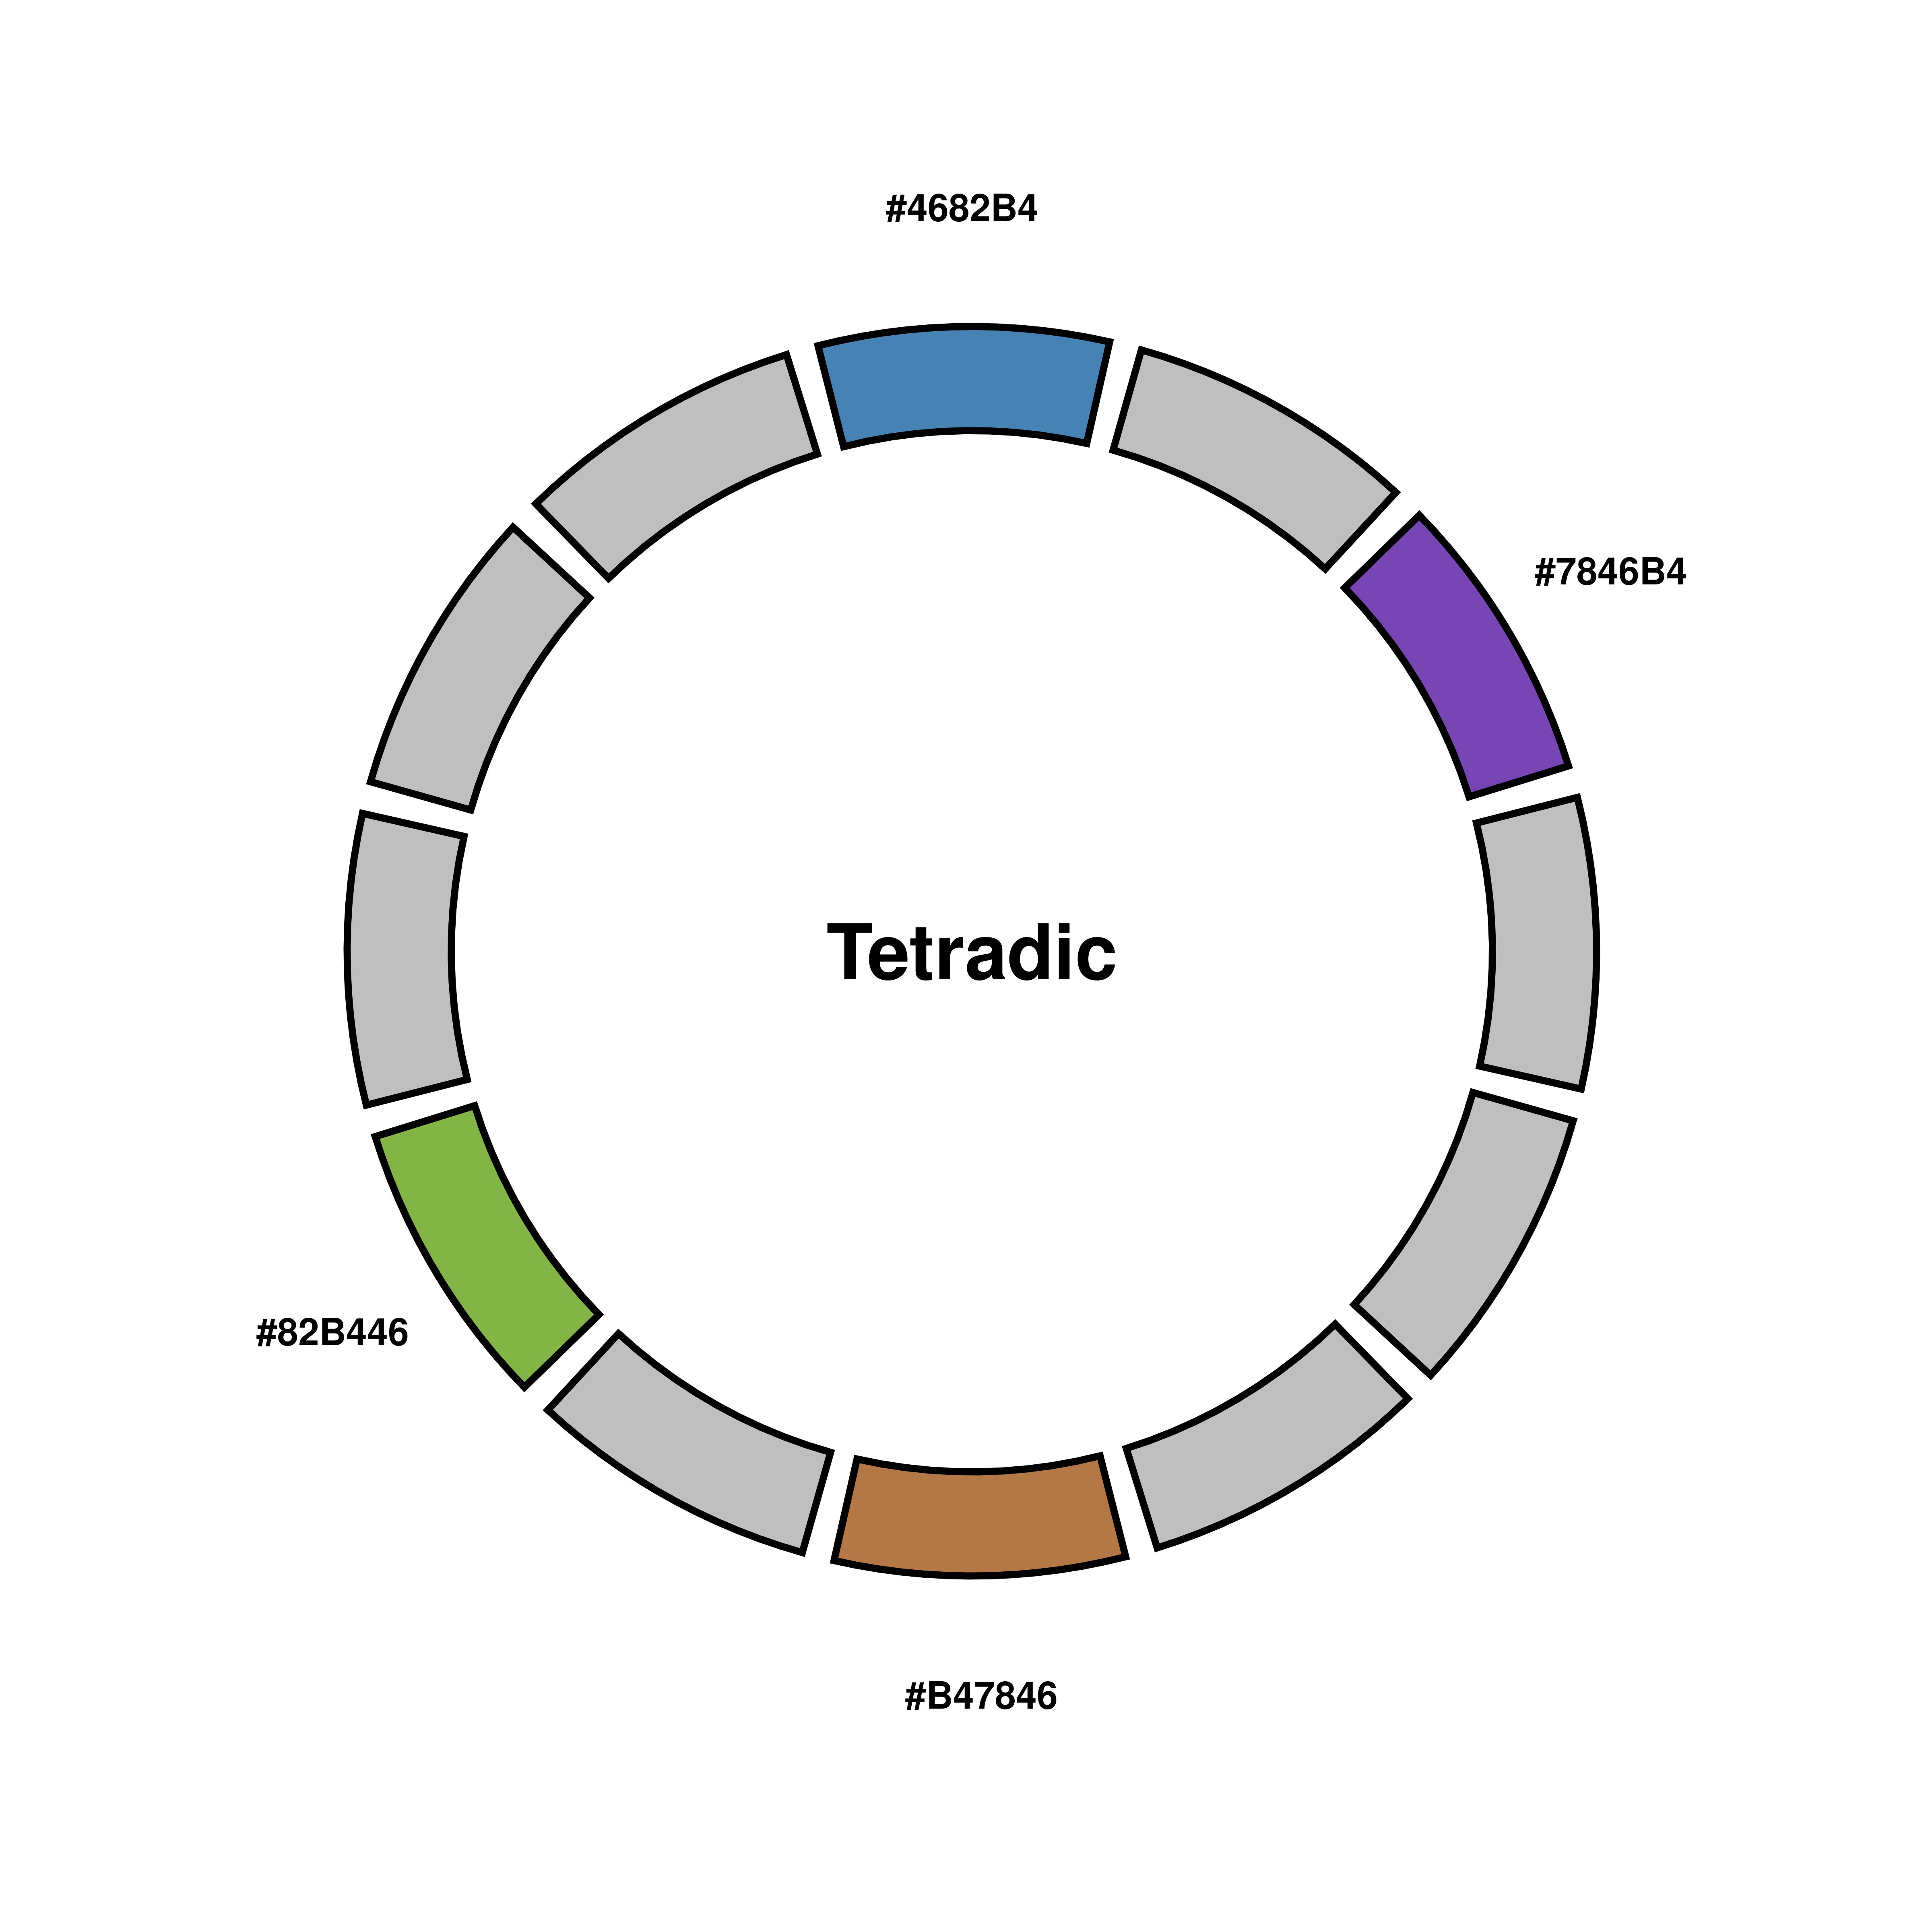
Square colors
# Generate square colors
p <- SCpubr::do_ColorPalette(colors.use = "steelblue",
                             square = TRUE,
                             plot = TRUE)

p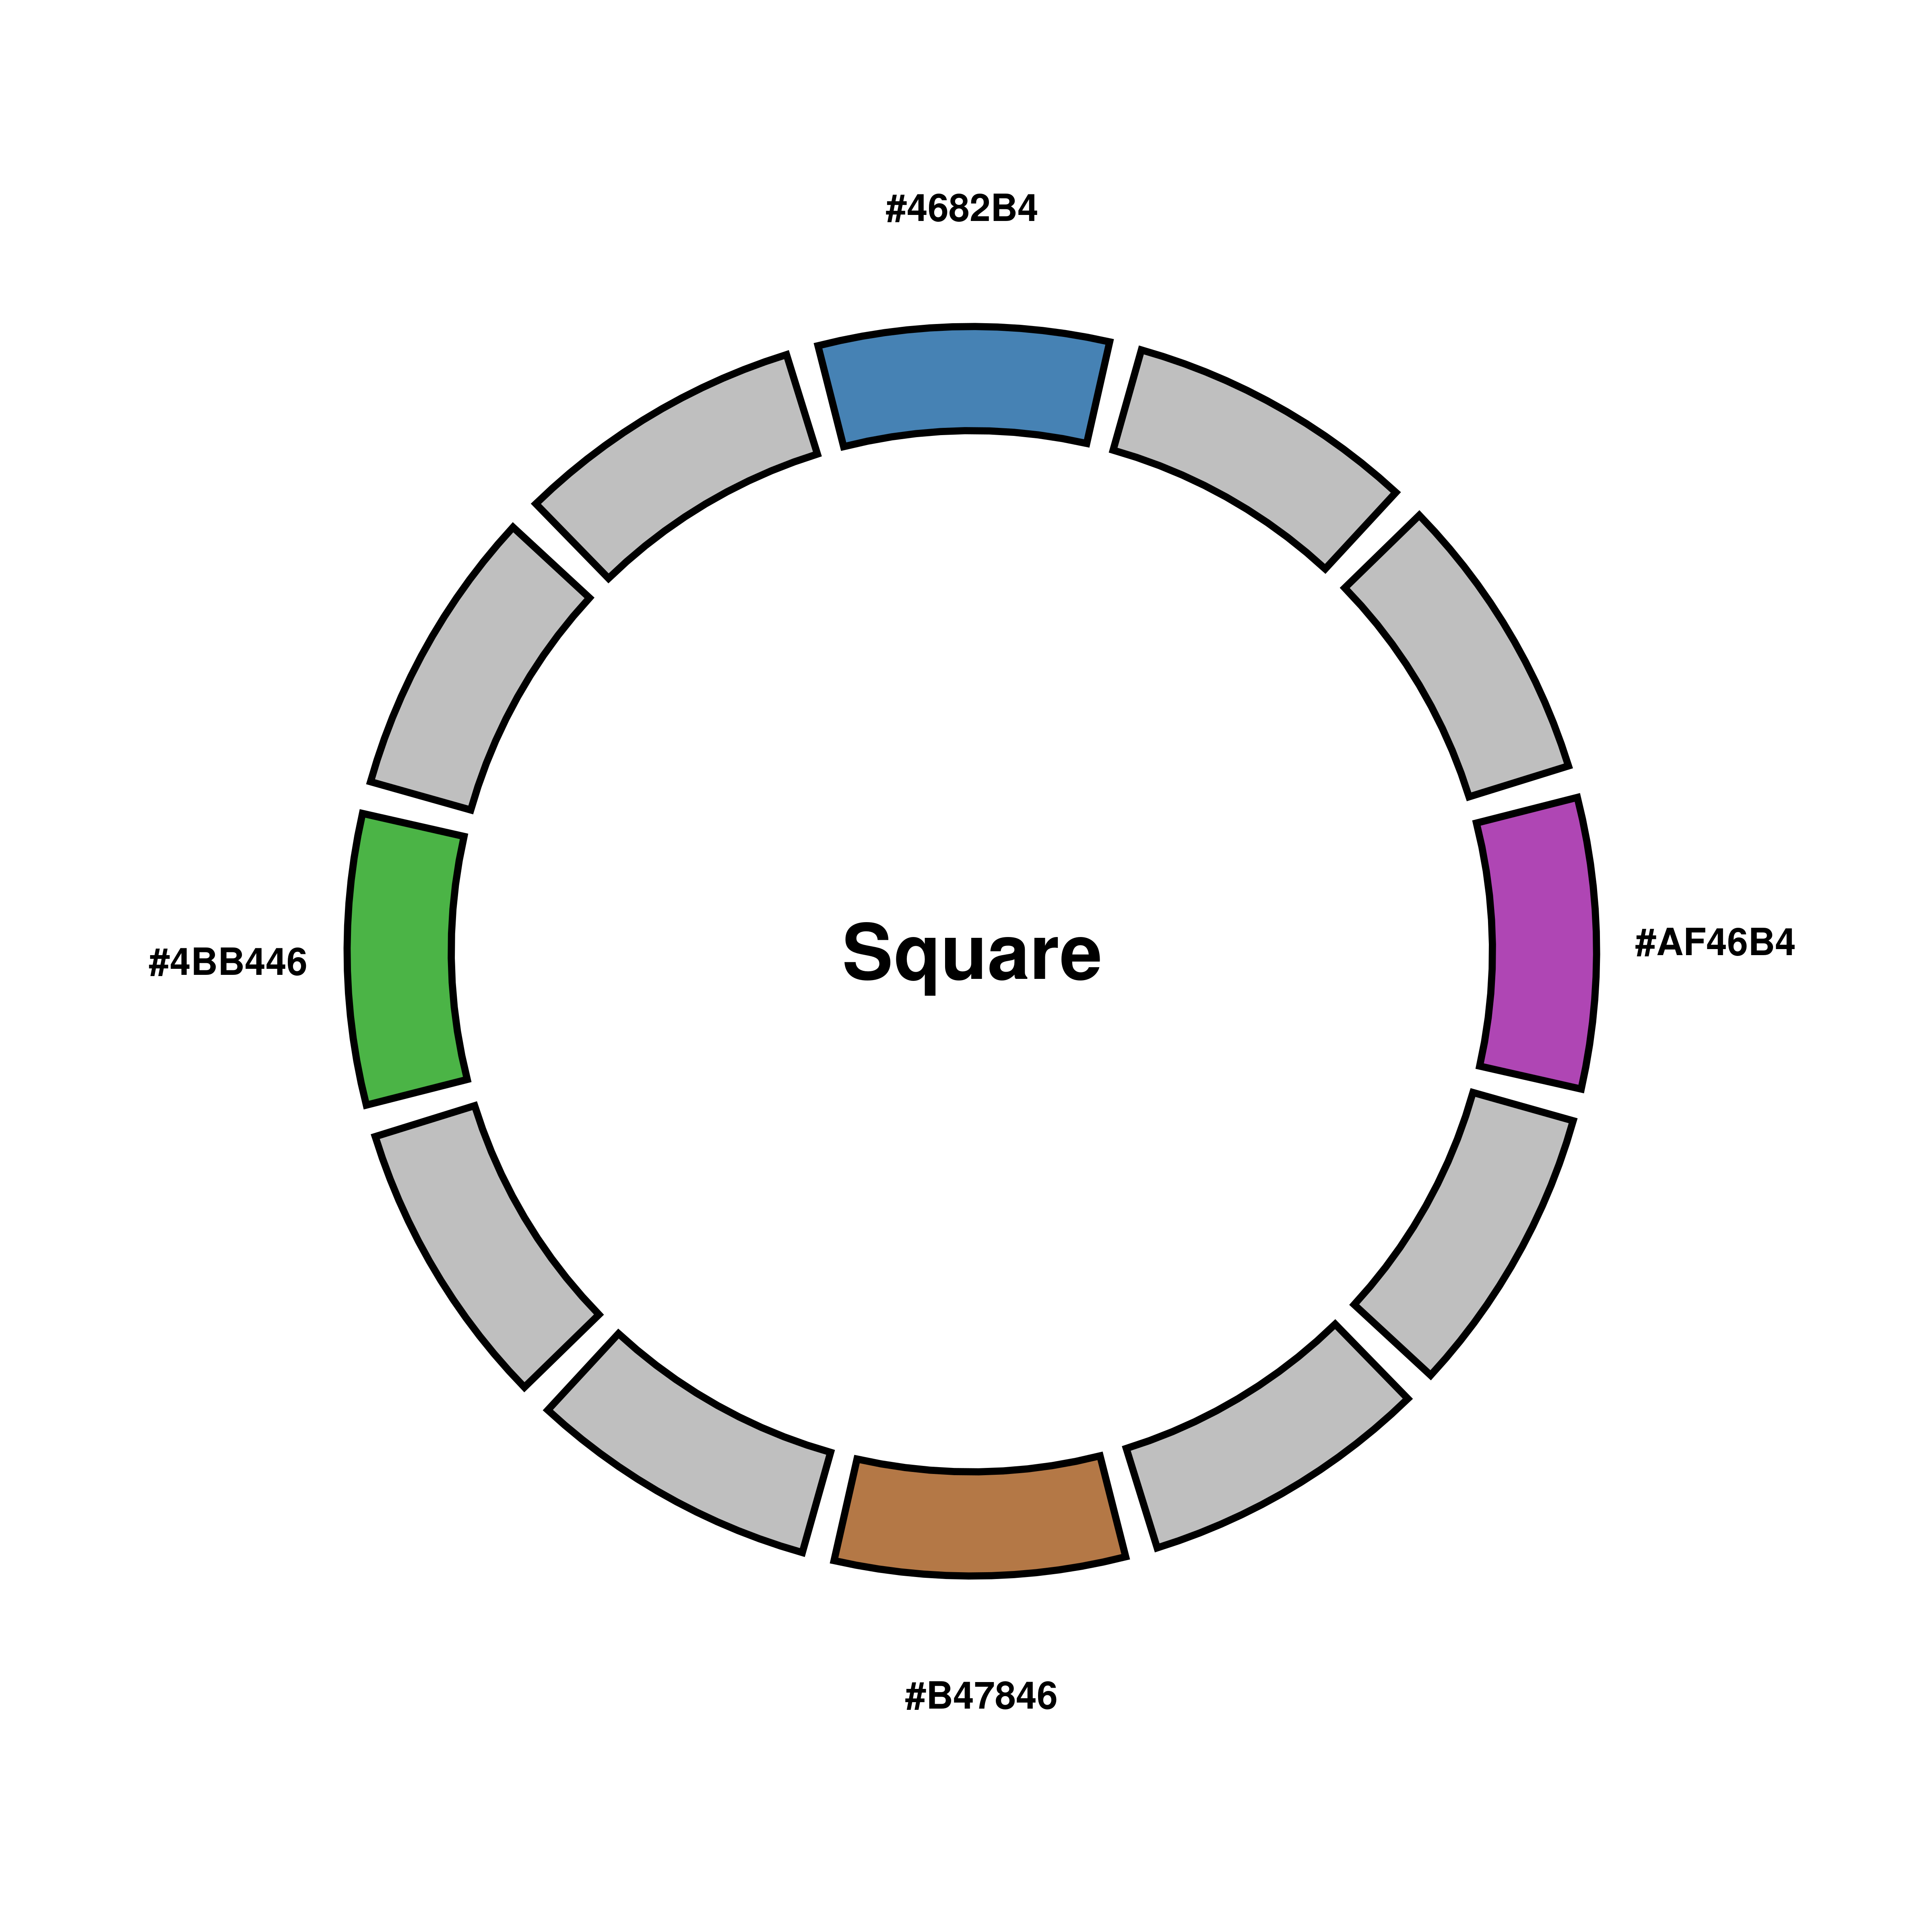
Generate a color report
However, it might be the case that one wants all combinations at the same time, to then select the one that works best. To achieve this, set complete_output = TRUE.
# Generate a color report.
out <- SCpubr::do_ColorPalette(colors.use = "steelblue",
                               complete_output = TRUE)

# Retrieve the color vectors.
color_vectors <- out$colors

# Retrieve the individual plots.
plots <- out$plots

# Retrieve a joint plot.
p <- out$combined_plot
p