13 Chord Diagram plots
Chord Diagram plots are pretty much the same type of visualization as Sankey and Alluvial plots, but with the twist that the nodes are located forming a circle, therefore the links resembling chords. These type of visualizations can be achieved using package.
13.1 Basic usage
This is how it looks:
# Basic chord diagram.
sample$assignment <- ifelse(sample$seurat_clusters %in% c("0", "4", "7"), "A", "B")
sample$assignment[sample$seurat_clusters %in% c("1", "2")] <- "C"
sample$assignment[sample$seurat_clusters %in% c("10", "5")] <- "D"
sample$assignment[sample$seurat_clusters %in% c("8", "9")] <- "E"

p <- SCpubr::do_ChordDiagramPlot(sample = sample,
                                 from = "seurat_clusters",
                                 to = "assignment")

p
Basic Chord Diagram.
13.2 Control the gaps between and within groups
We can modify the gaps between from and to, provided that there are not so many elements that this can not be accomplished. For this, we use big_gap:
# Increase gap between from and to groups.
p <- SCpubr::do_ChordDiagramPlot(sample = sample,
                                 from = "seurat_clusters",
                                 to = "assignment",
                                 big.gap = 40)

p
Chord Diagram with increased big gap.
Similarly, we can also modify the gaps between the groups inside from and to with small_gap:
# Increase gap width groups in from and to.
p <- SCpubr::do_ChordDiagramPlot(sample = sample,
                                 from = "seurat_clusters",
                                 to = "assignment",
                                 small.gap = 5)

p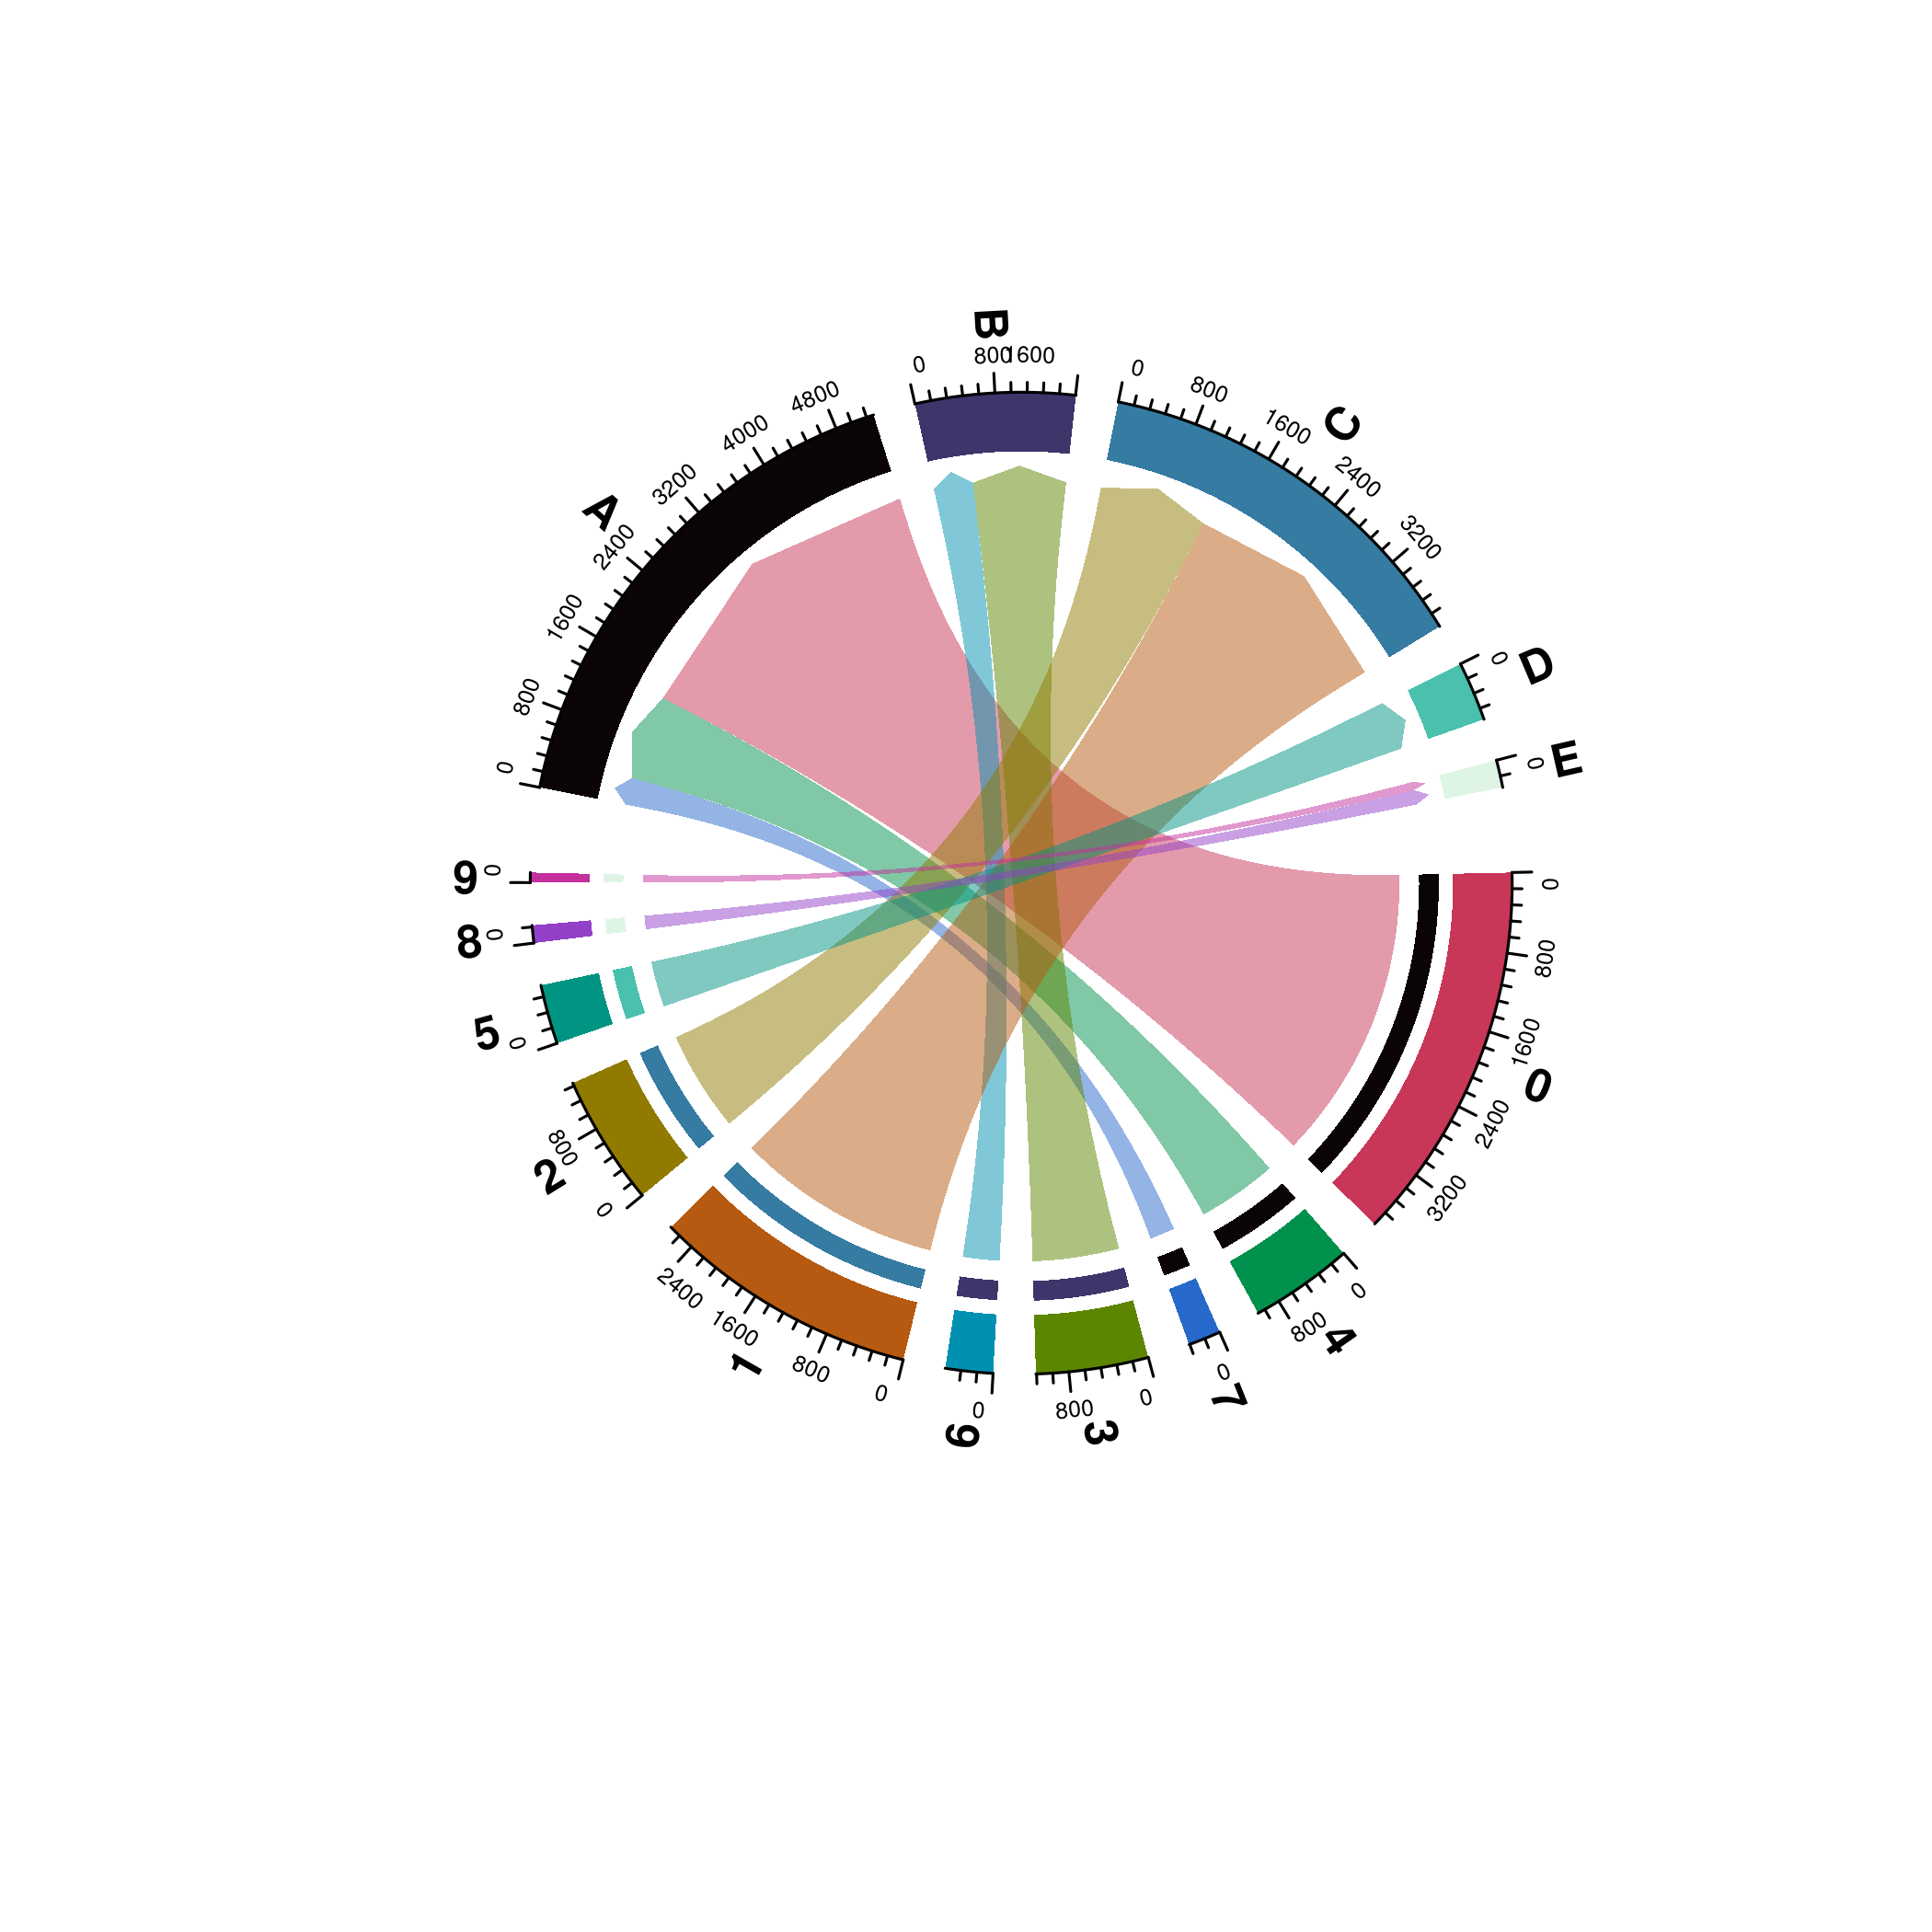
Chord Diagram with increased small gap.
13.3 Control the alignment of the diagram
We can force the alignment of the starting poing of the Chord diagram using the alignment parameter:
# Control the alignment of the diagram.
p <- SCpubr::do_ChordDiagramPlot(sample = sample,
                                 from = "seurat_clusters",
                                 to = "assignment",
                                 alignment = "horizontal")

p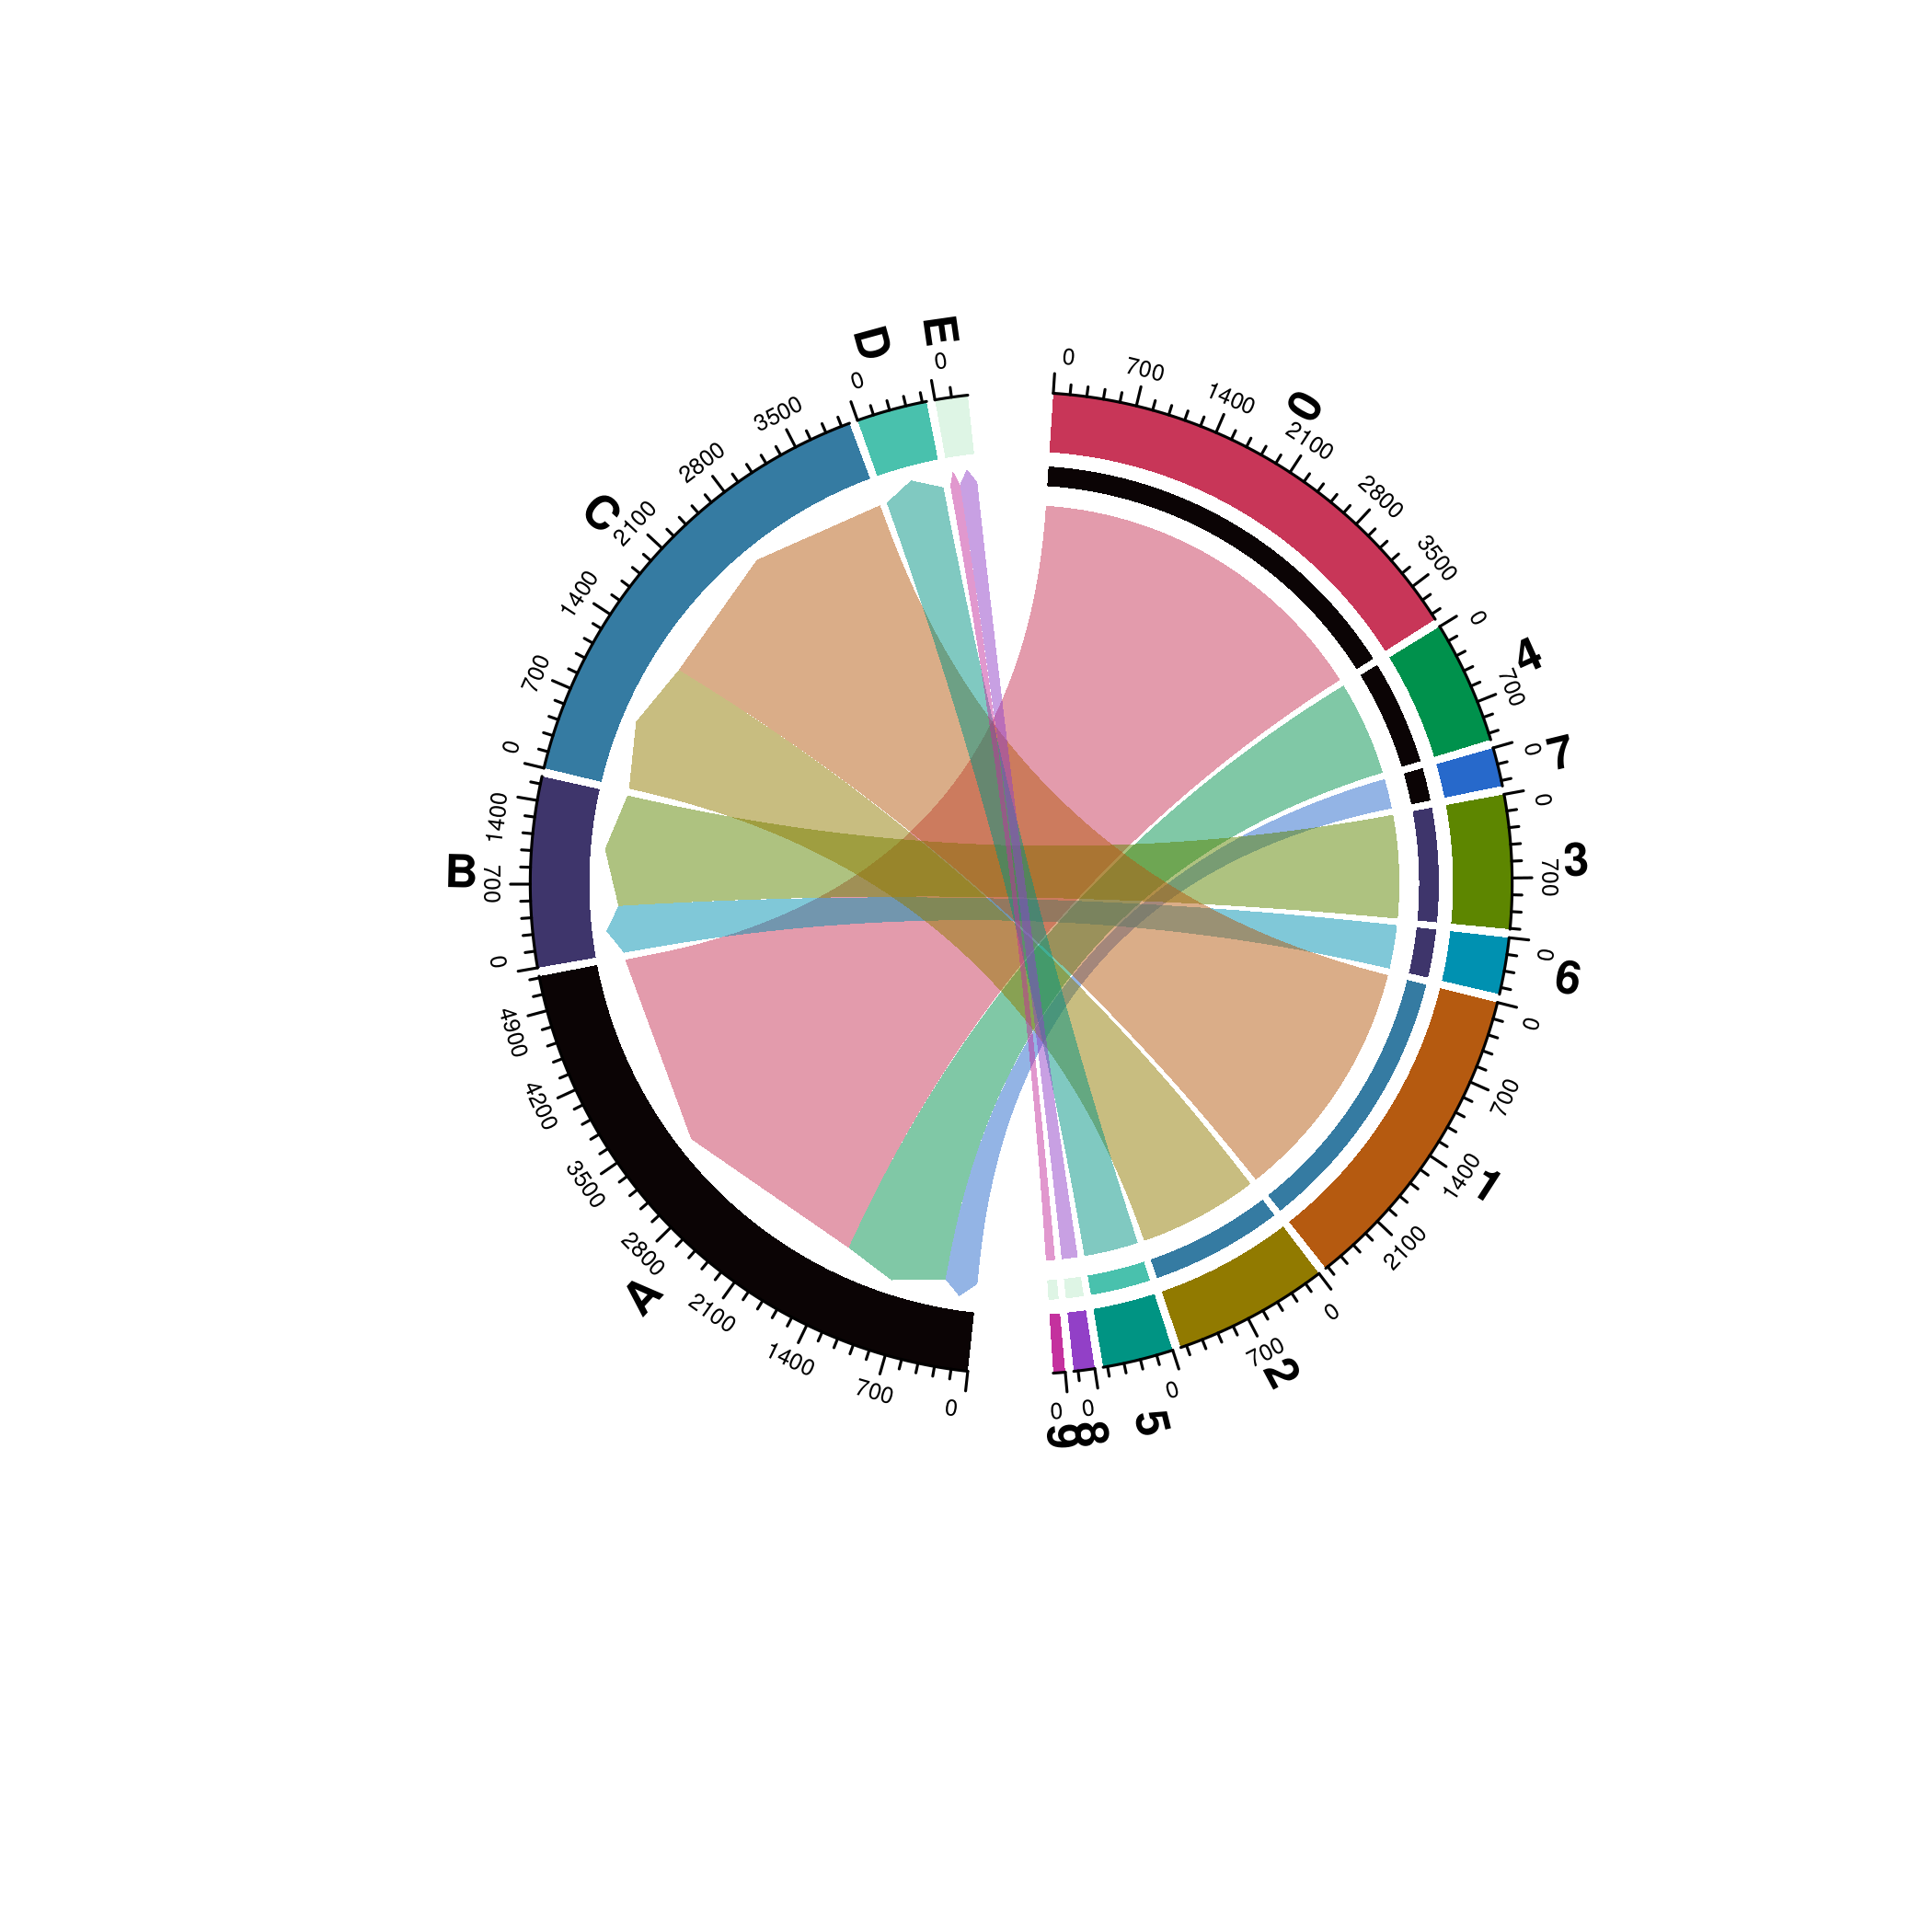
Chord Diagram starting horizontally.
p <- SCpubr::do_ChordDiagramPlot(sample = sample,
                                 from = "seurat_clusters",
                                 to = "assignment",
                                 alignment = "vertical")

p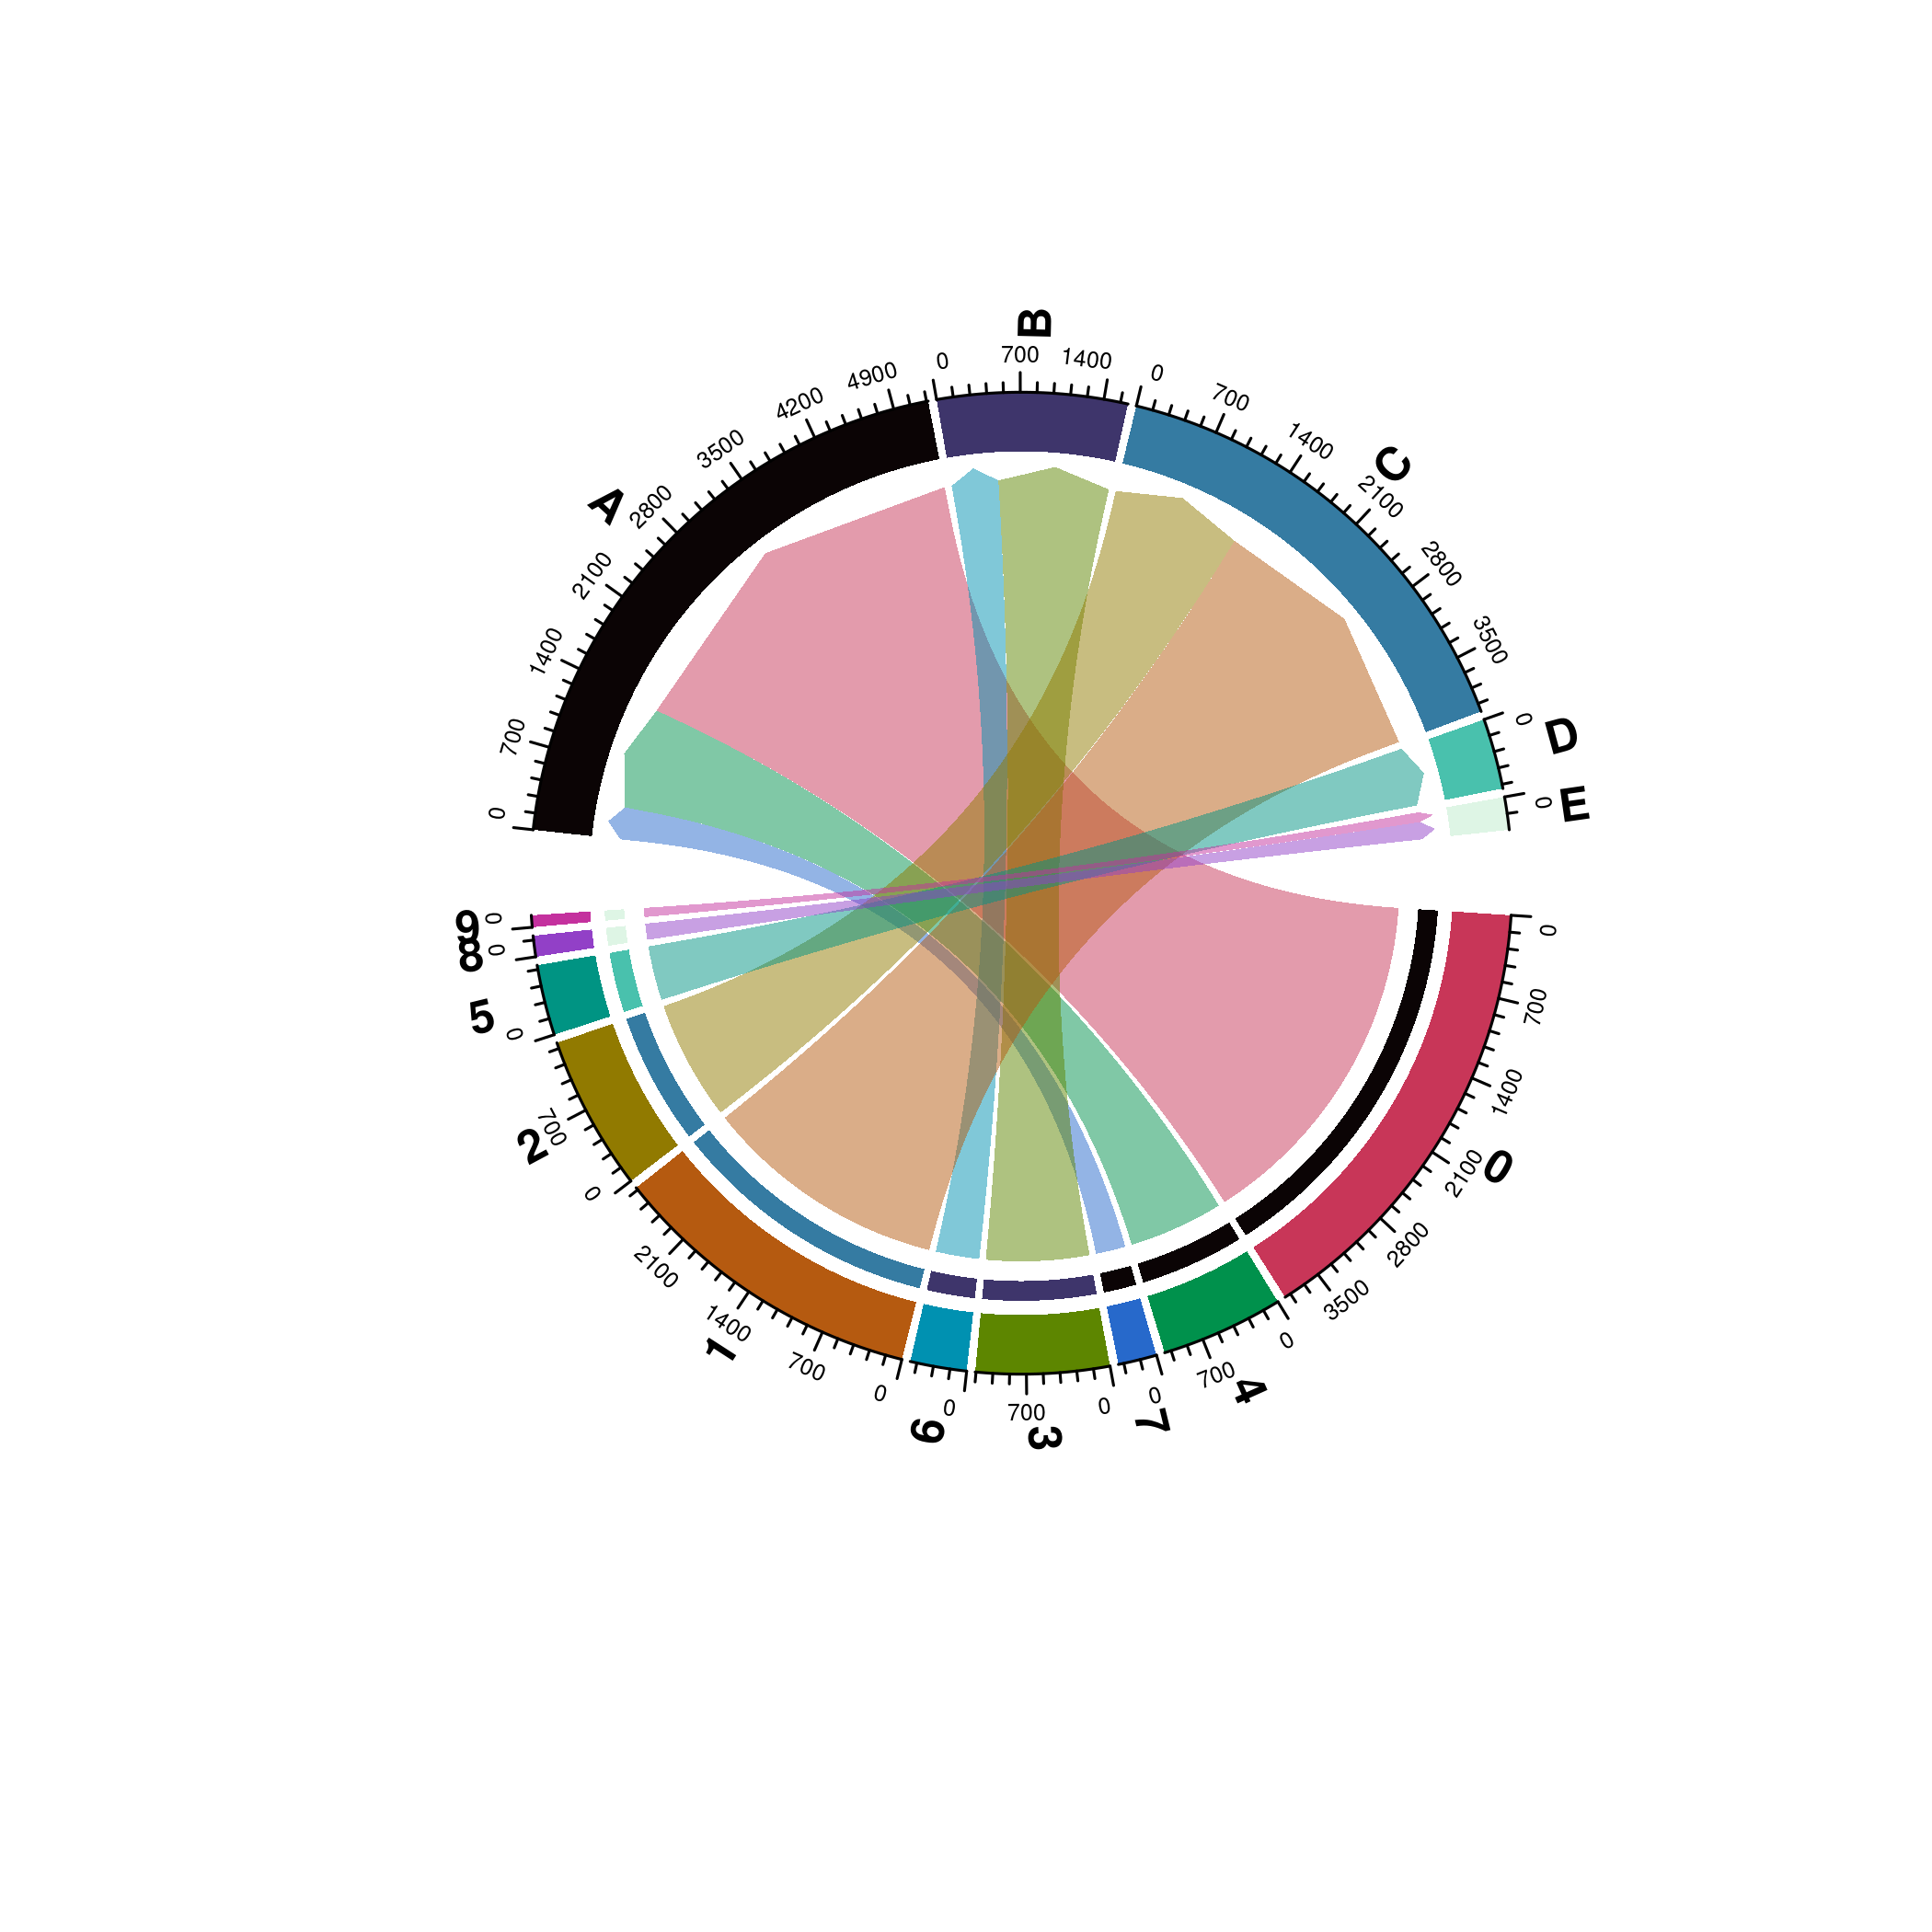
Chord Diagram starting vertically.
13.4 Control the directions of the links
Also, we can define the direction of the interaction by providing different values to directional: - 0: The links have no direction. - 1: The links go from from to to. - -1: The links go from to to from. - 2: The links are bidrectional.
# We need to set direction.type to diffHeight only as arrows are, by nature, directional.
p <- SCpubr::do_ChordDiagramPlot(sample = sample,
                                 from = "seurat_clusters",
                                 to = "assignment",
                                 directional = 0,
                                 direction.type = "diffHeight")

p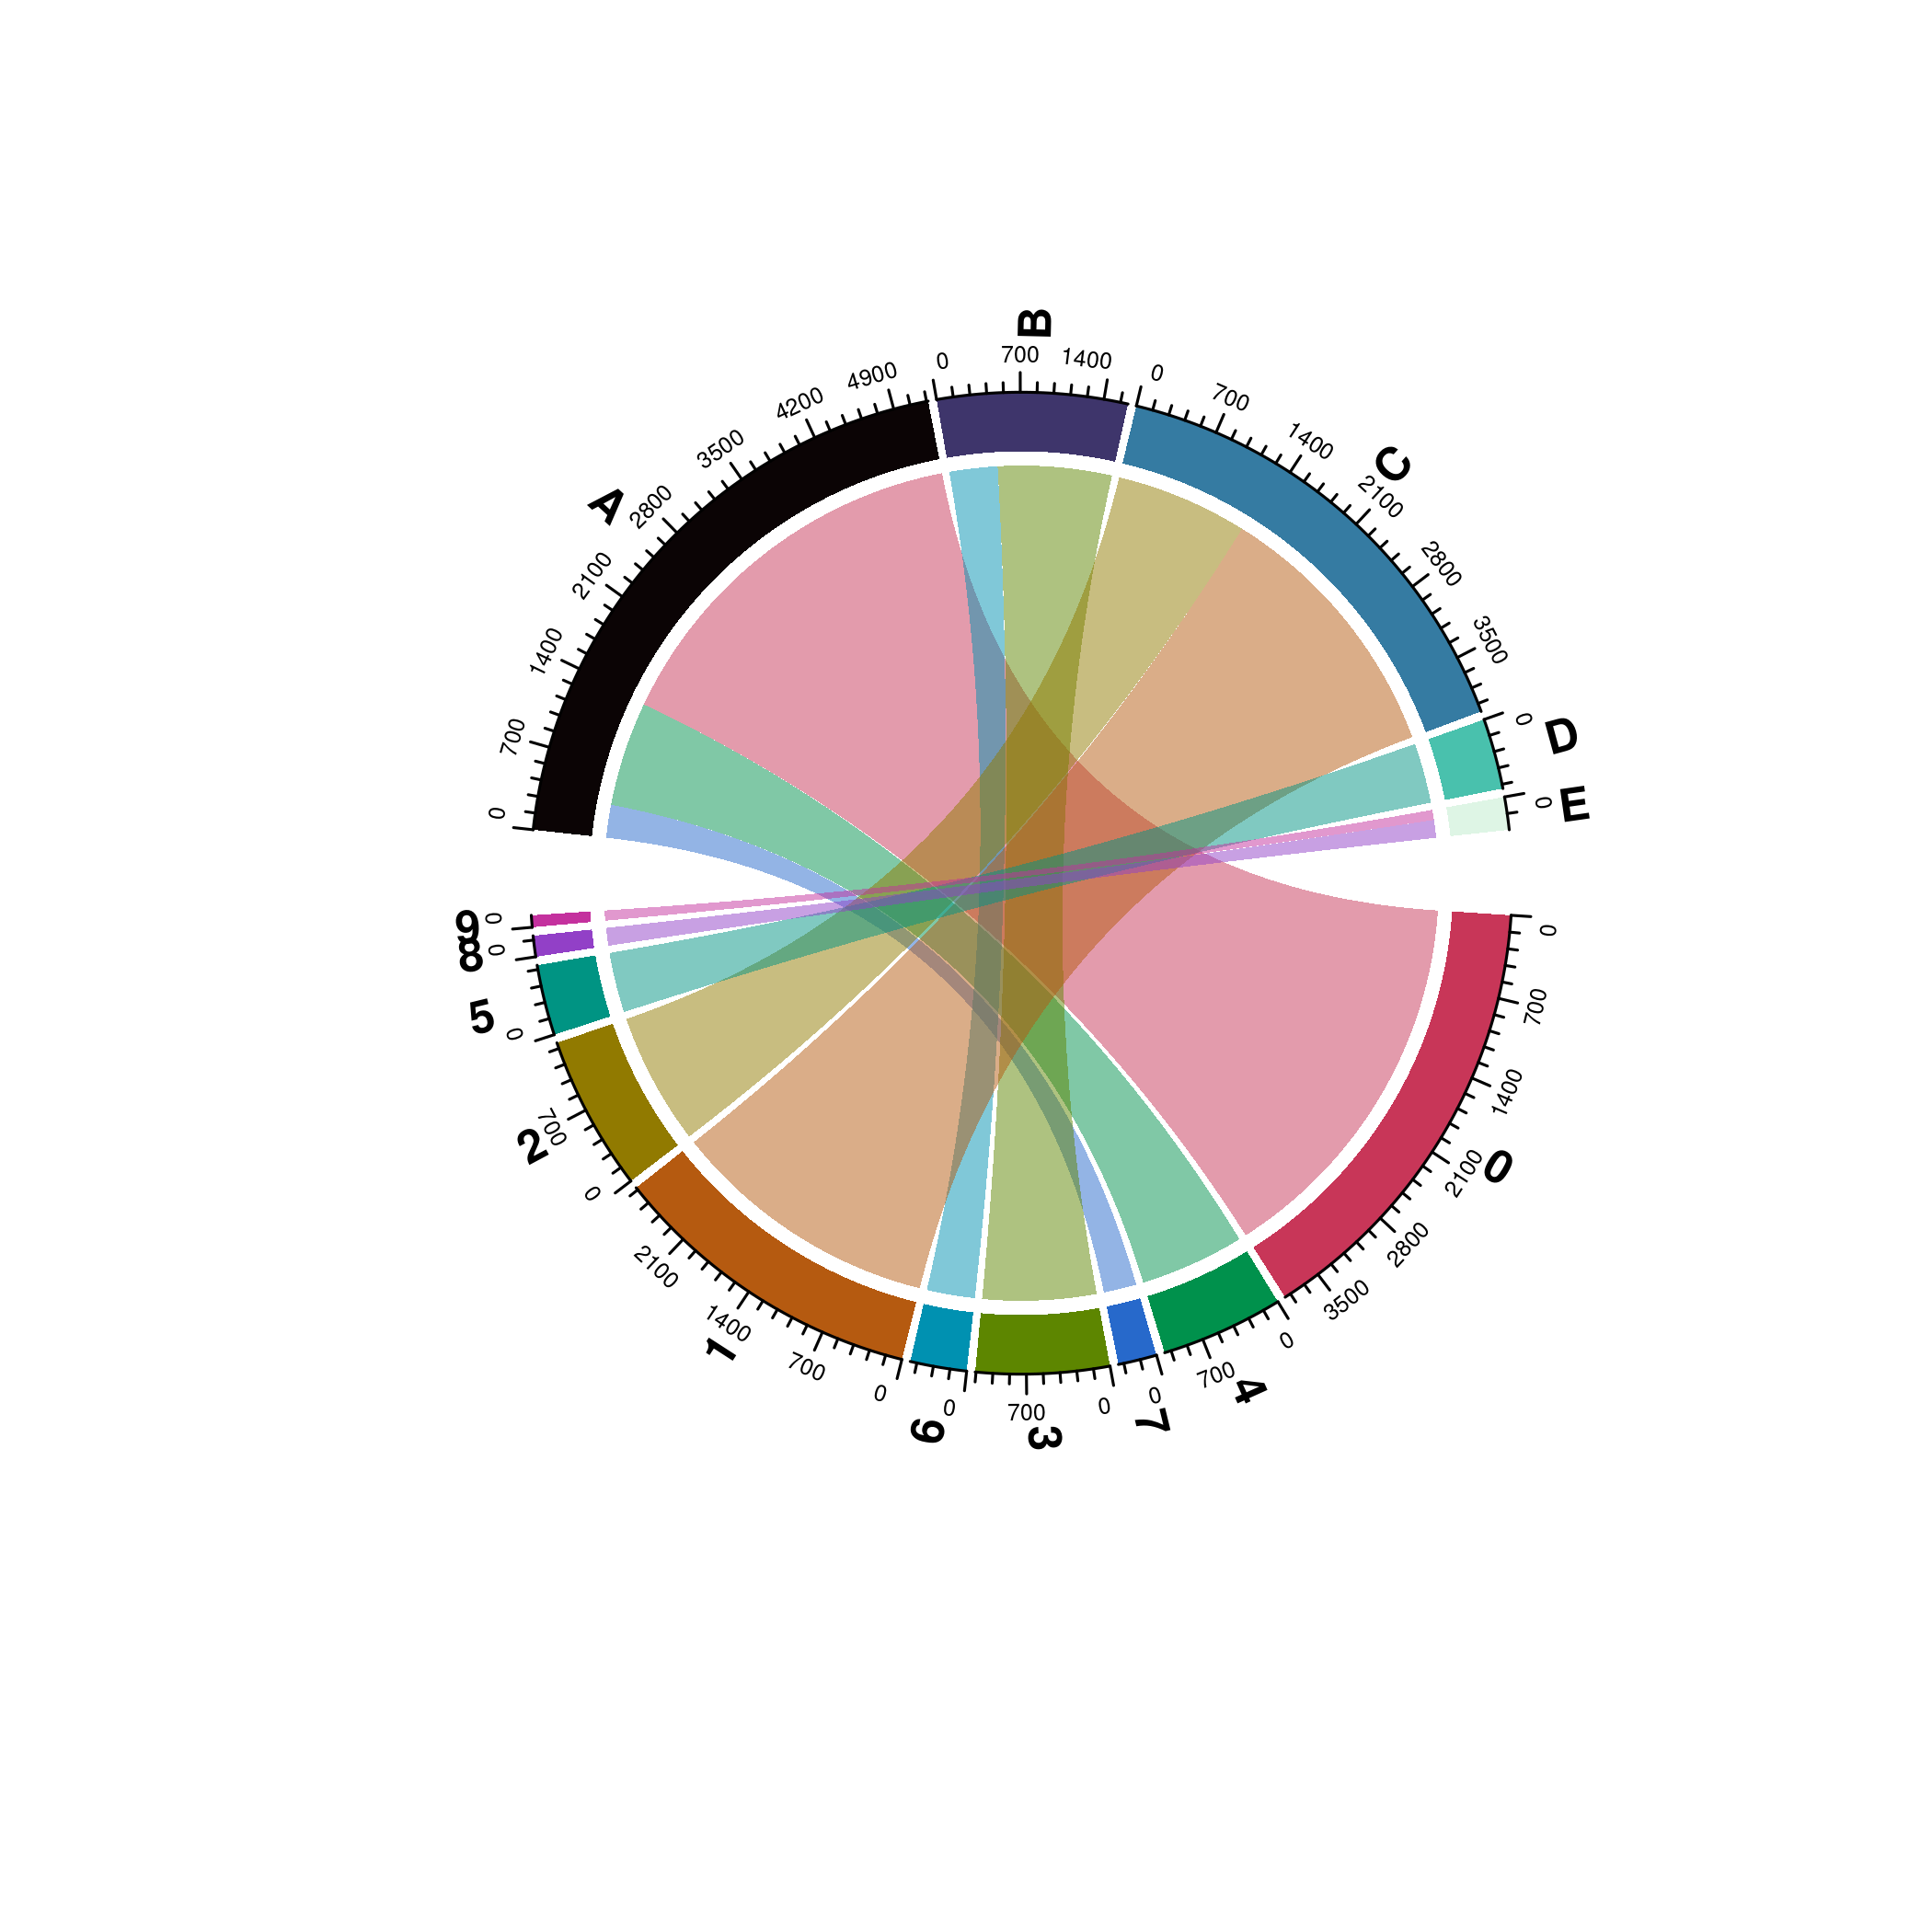
Chord Diagram with links without any direction.
p <- SCpubr::do_ChordDiagramPlot(sample = sample,
                                 from = "seurat_clusters",
                                 to = "assignment",
                                 directional = 1)

p
Chord Diagram with links going from “from” to “to”.
p <- SCpubr::do_ChordDiagramPlot(sample = sample,
                                 from = "seurat_clusters",
                                 to = "assignment",
                                 directional = -1)

p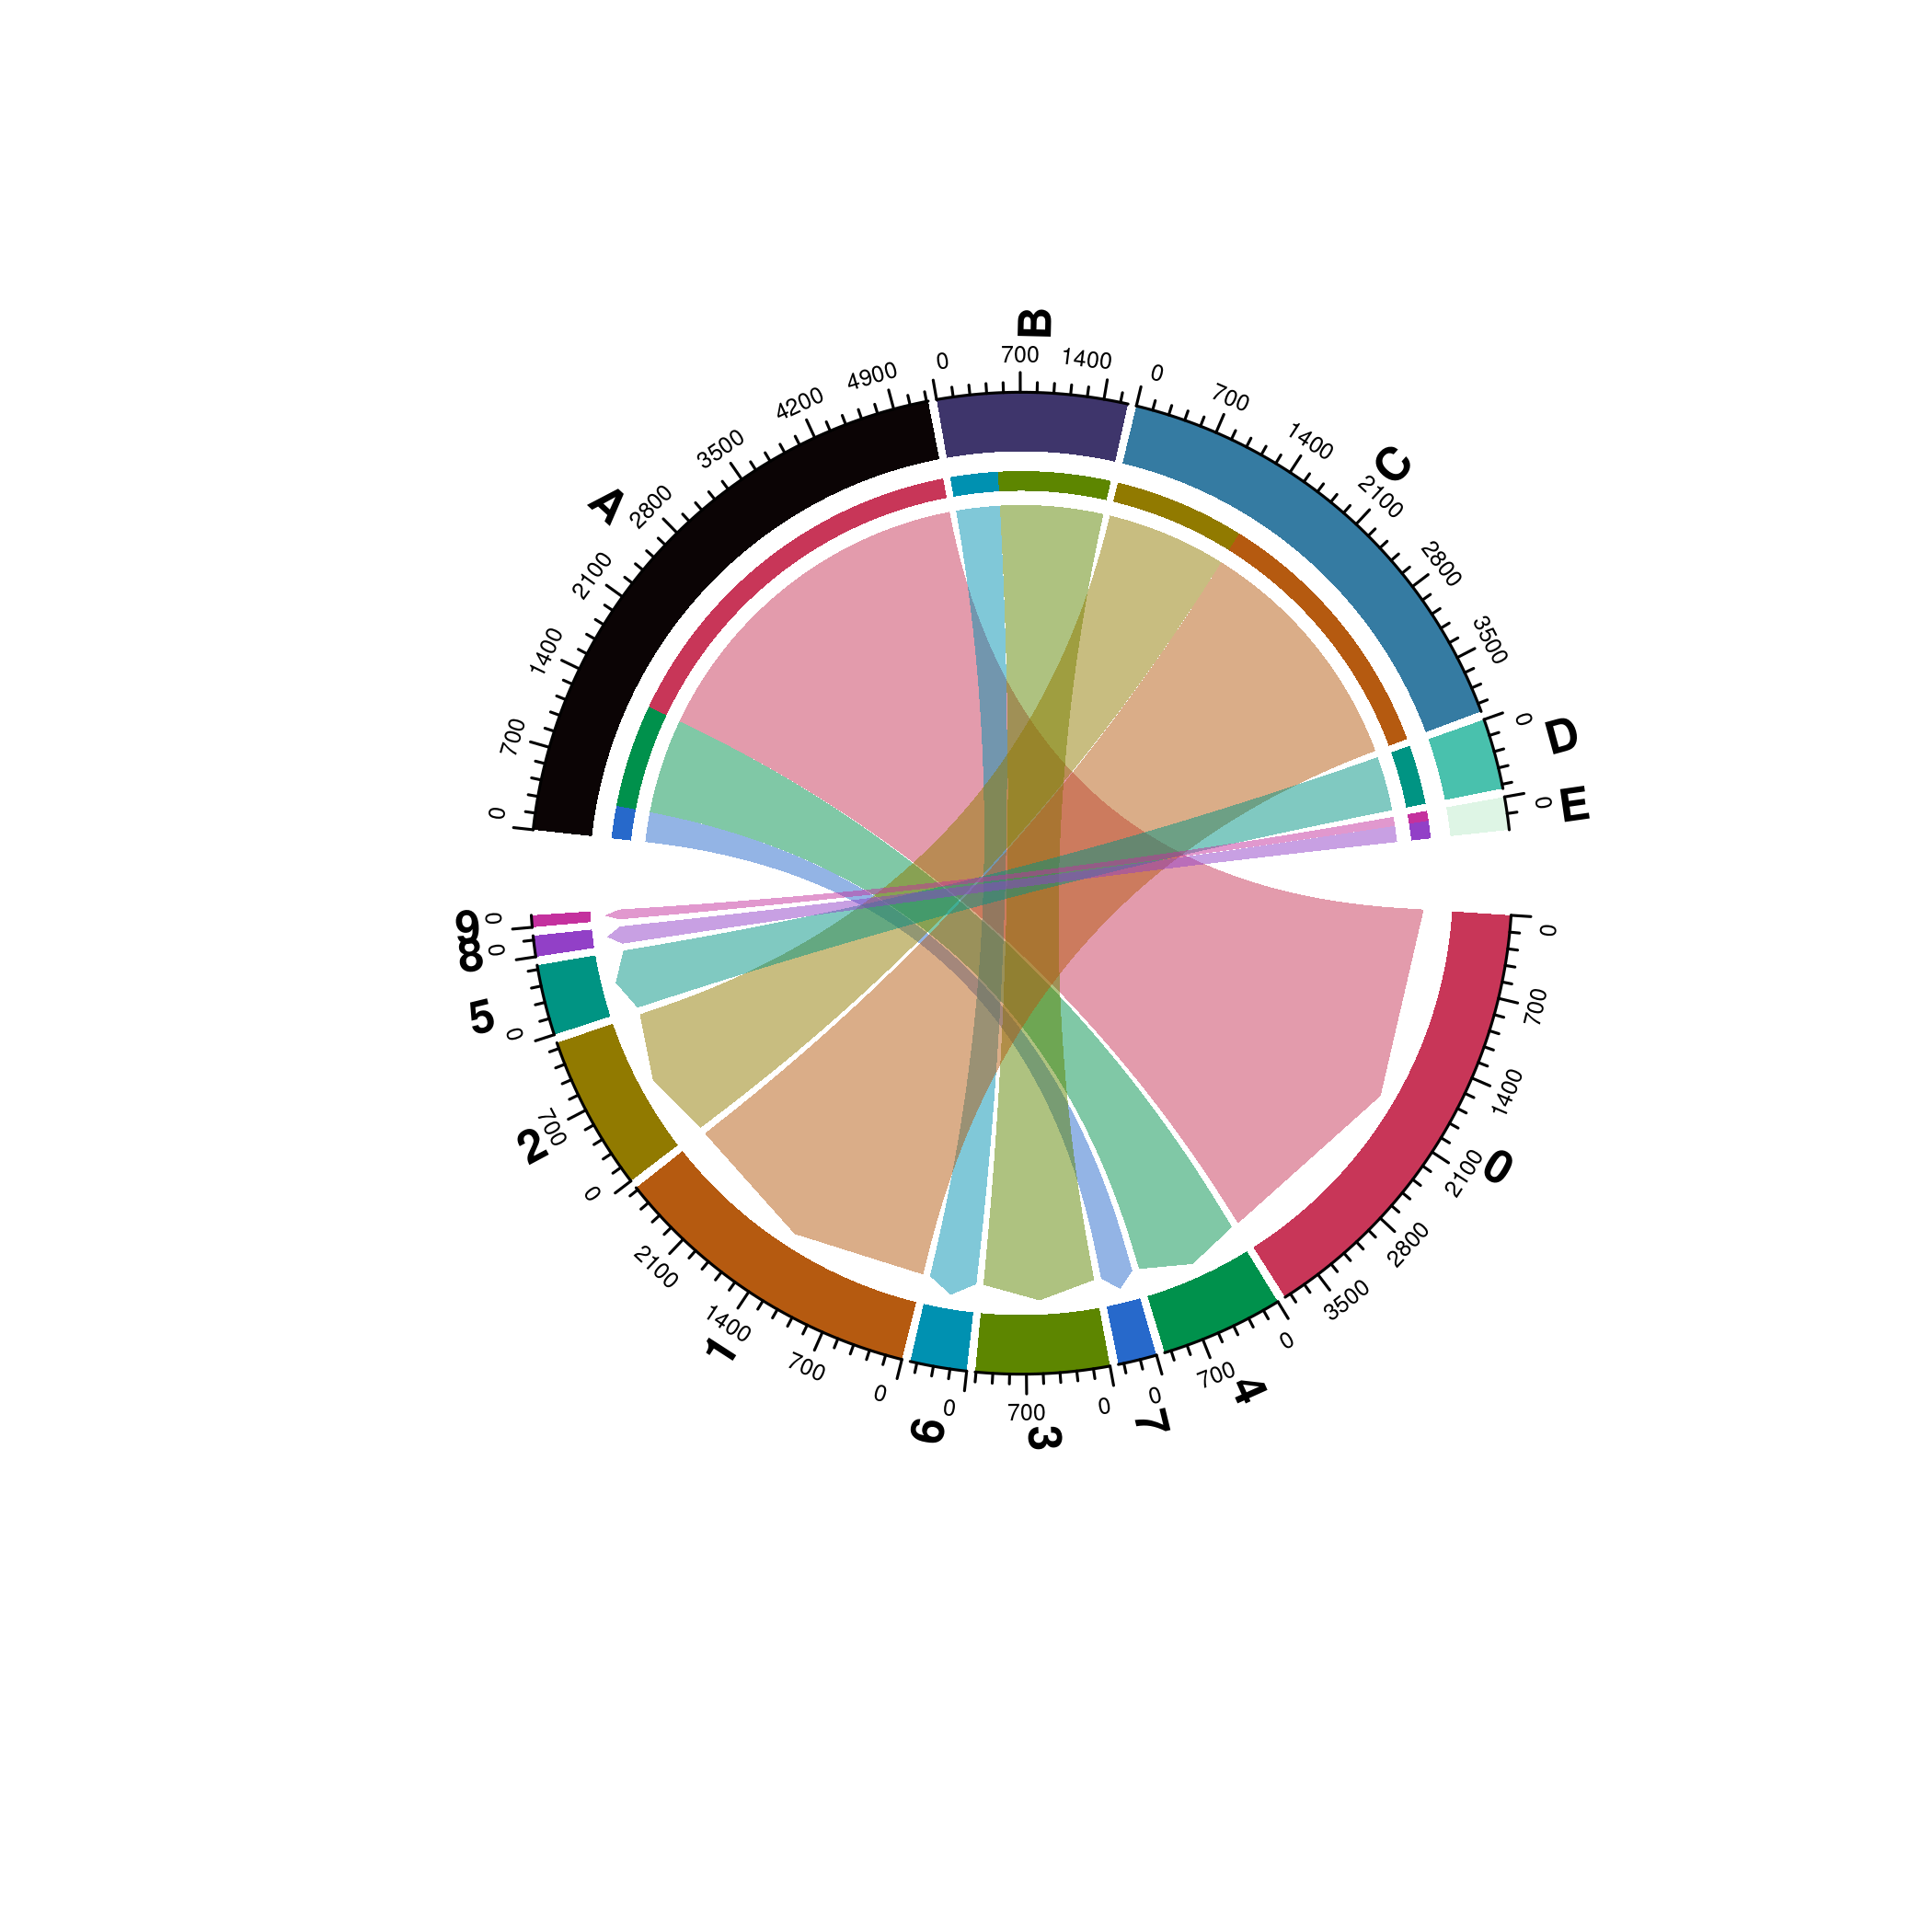
Chord Diagram with links going from “to” to “from”.
# We need to set direction.type to diffHeight only as arrows are, by nature, directional.
p <- SCpubr::do_ChordDiagramPlot(sample = sample,
                                 from = "seurat_clusters",
                                 to = "assignment",
                                 directional = 2,
                                 direction.type = "diffHeight")

p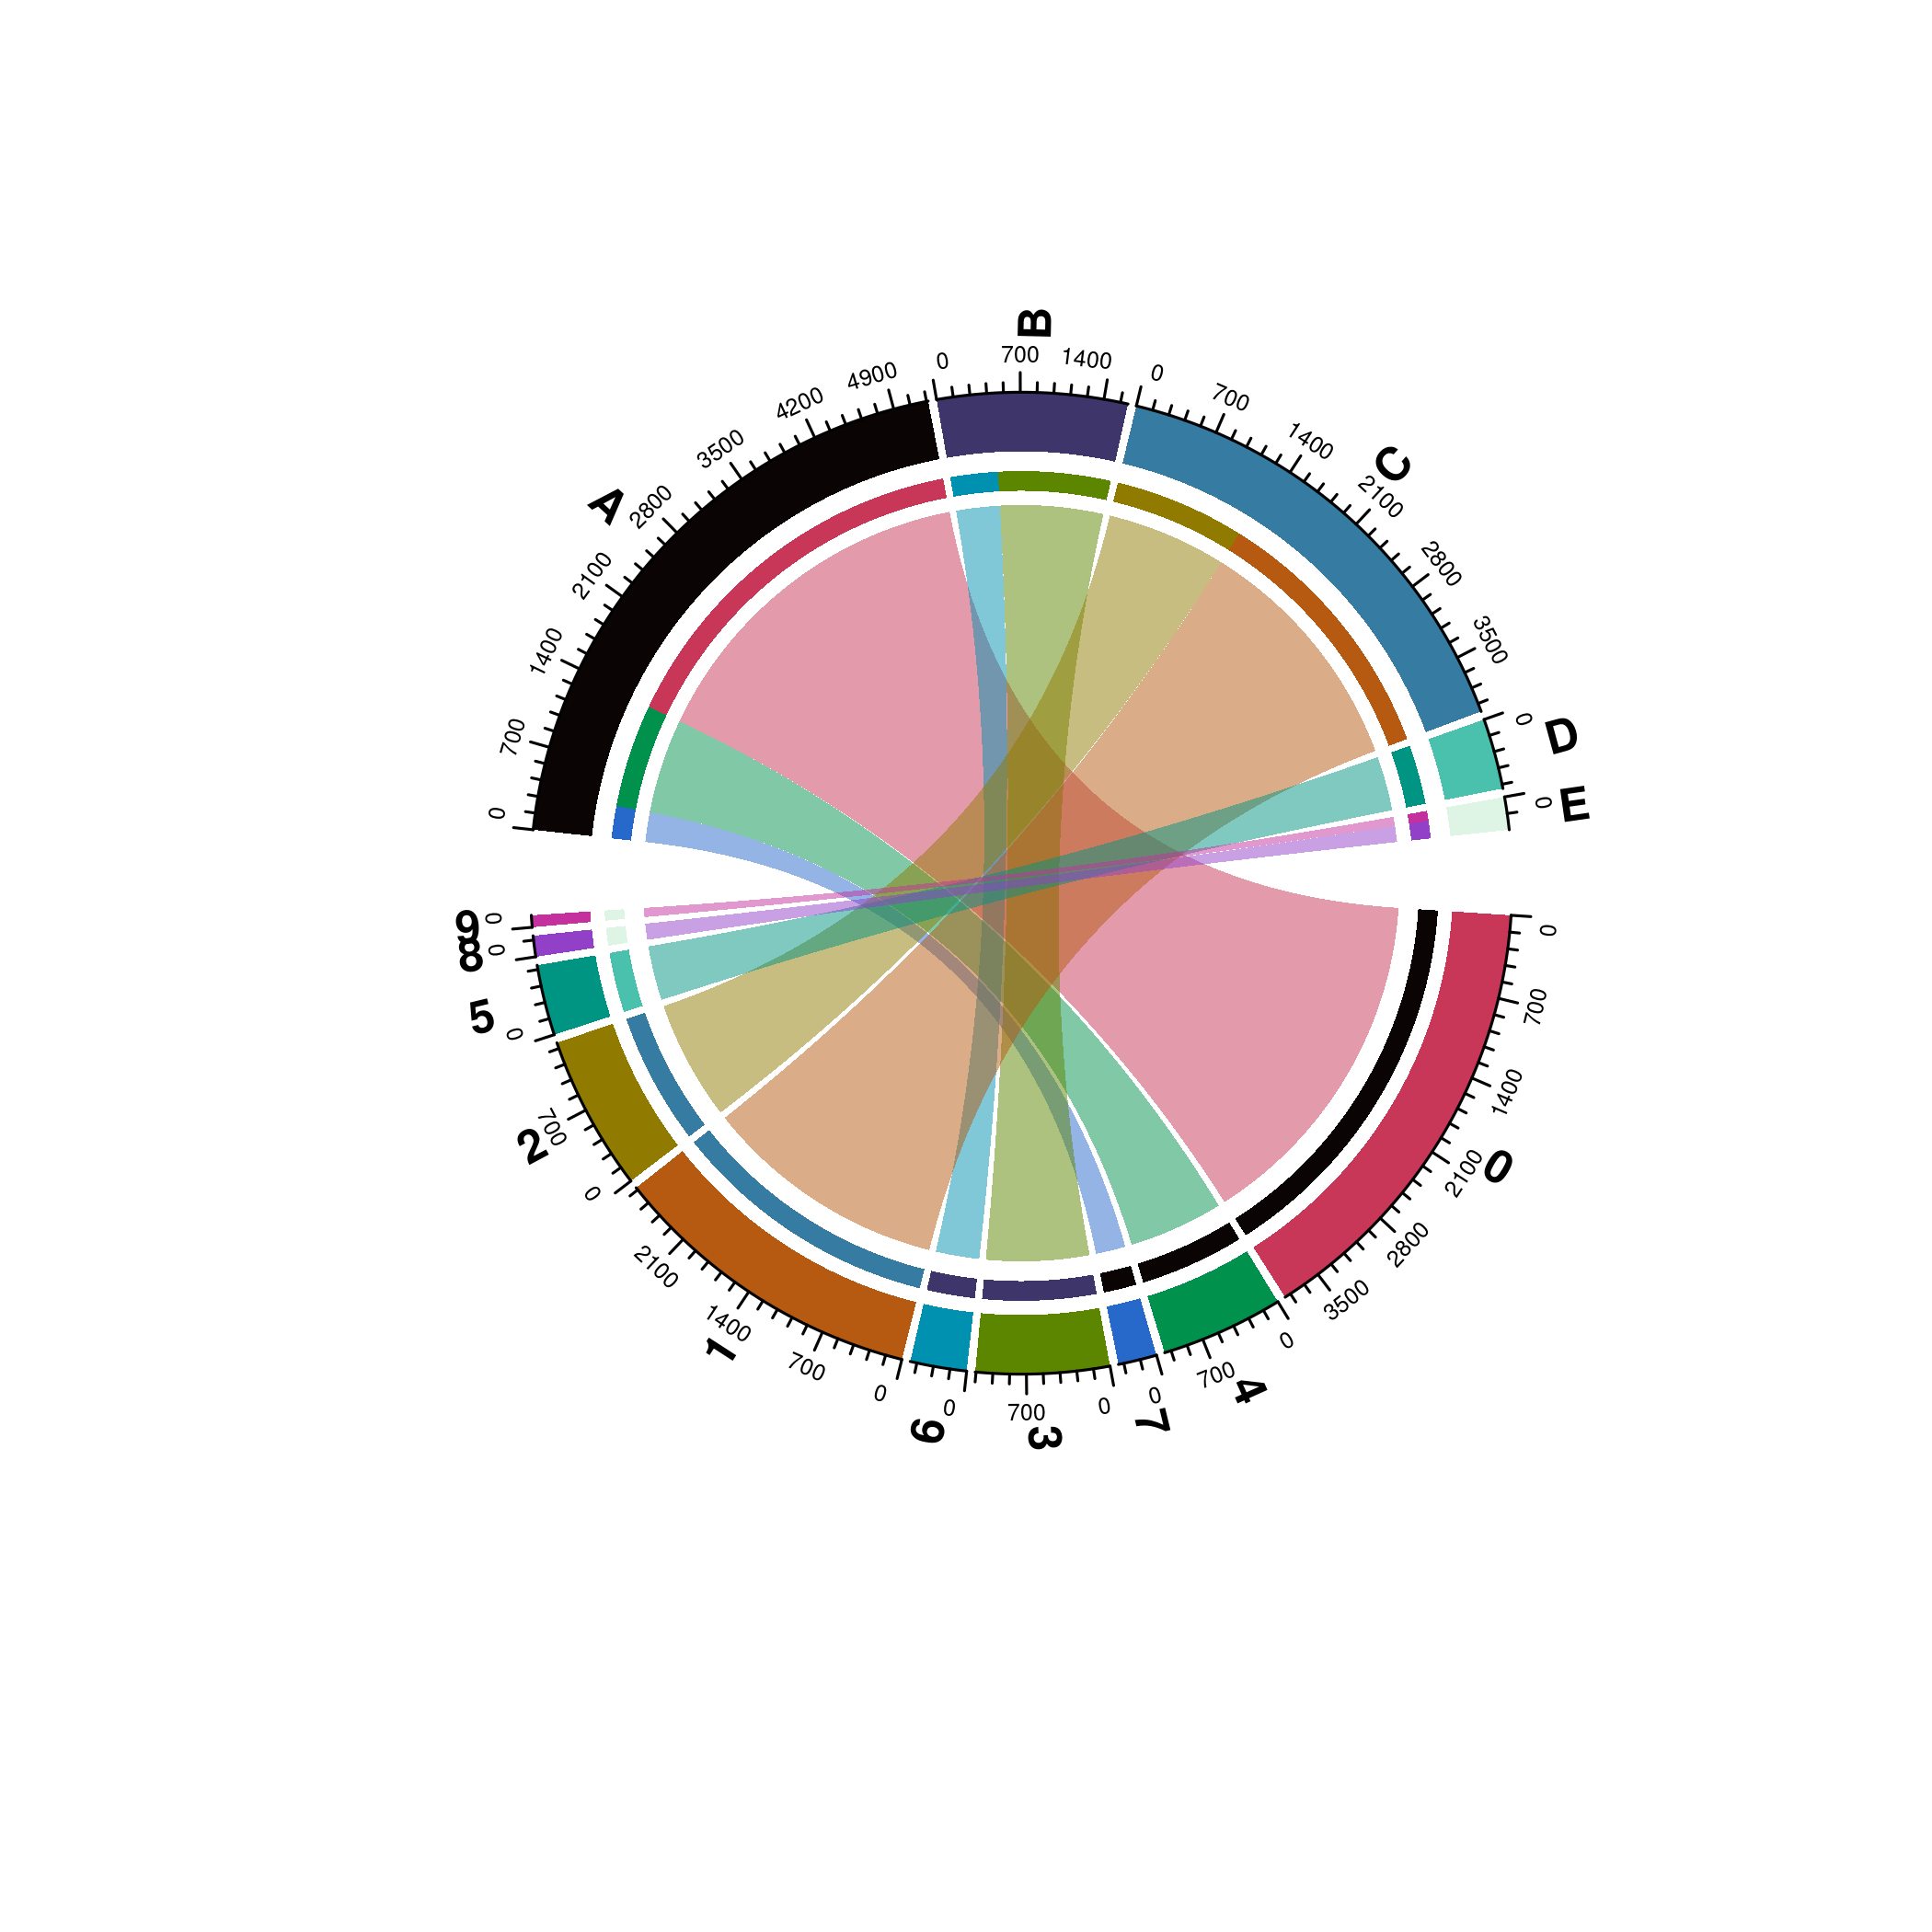
Chord Diagram with links going in both directions.
13.5 Add padding to the labels
One can add more padding to the labels by using padding_labels. The number provided is the amount of whitespaces padding the label.
# Add more padding to the labels.
p <- SCpubr::do_ChordDiagramPlot(sample = sample,
                                 from = "seurat_clusters",
                                 to = "assignment",
                                 padding_labels = 8)

p
Chord Diagram with extra padding.
13.6 Scale the nodes
If we want to show the nodes with equal size, links reflecting a proportion instead, we can set scale = TRUE.
# Scale the size of the nodes.
p <- SCpubr::do_ChordDiagramPlot(sample = sample,
                                 from = "seurat_clusters",
                                 to = "assignment",
                                 scale = TRUE,
                                 padding_labels = 8)

p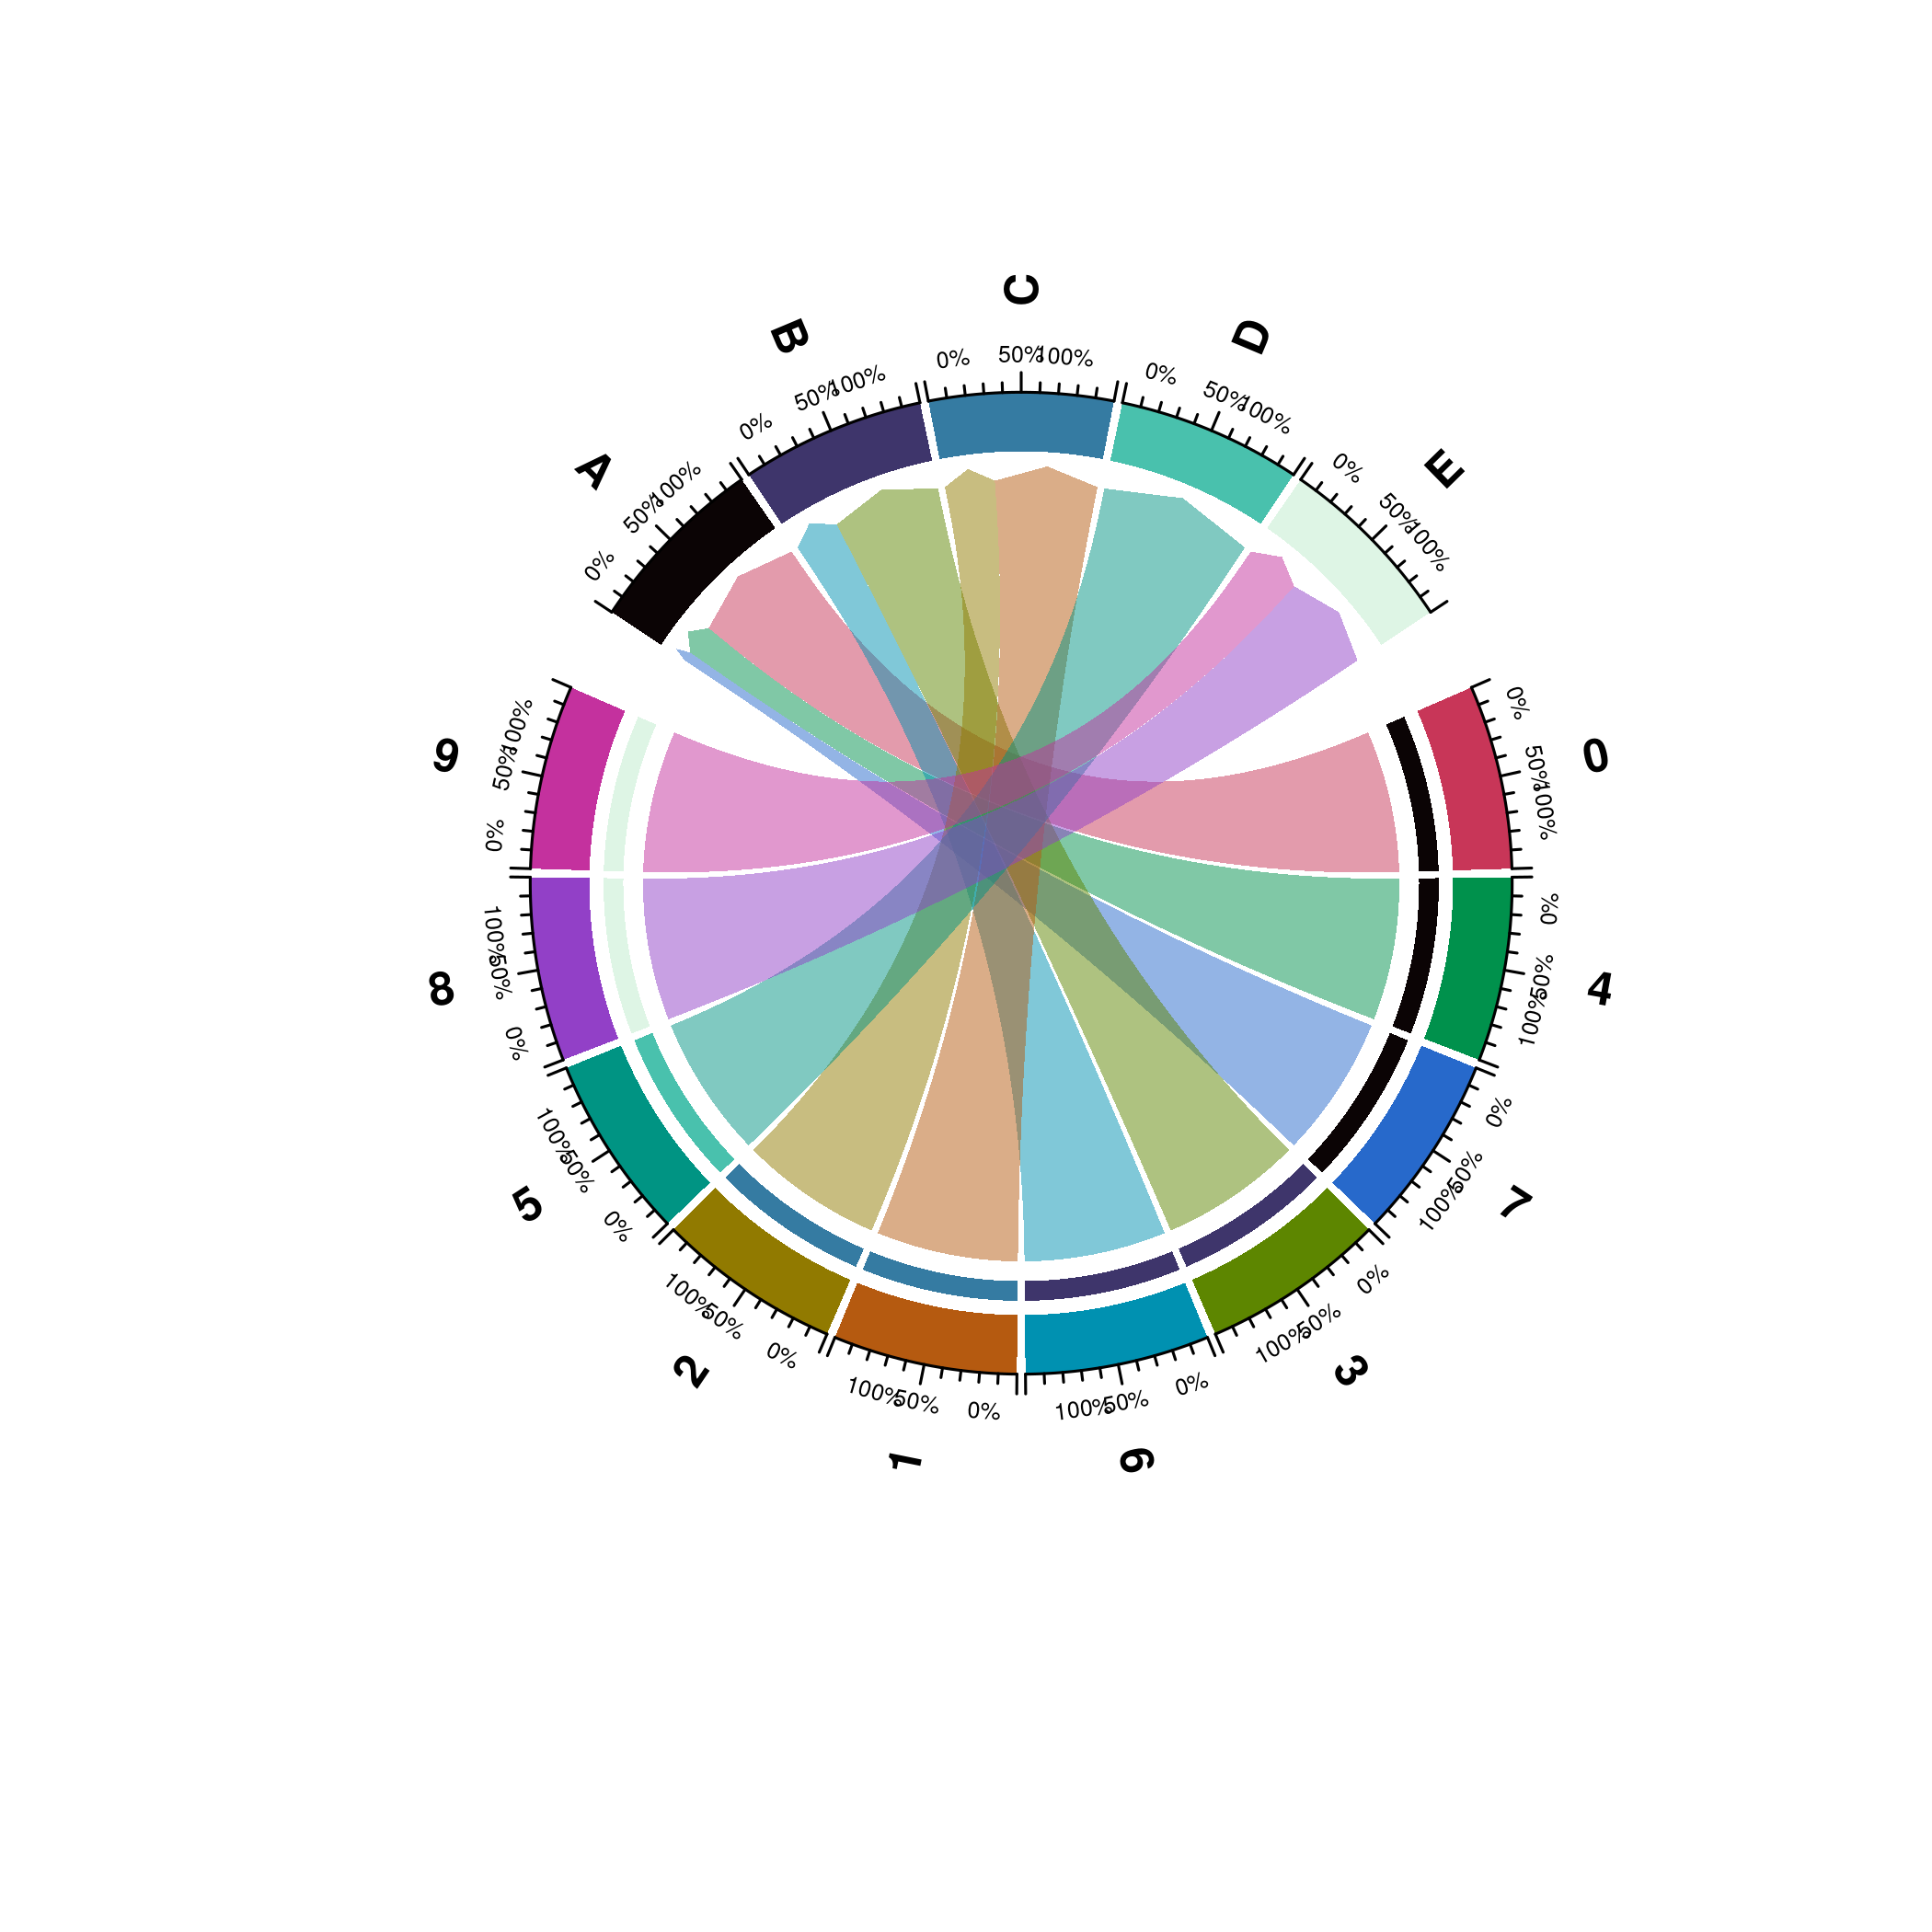
Chord Diagram with scaled nodes.
13.7 Self linking
We can also control whether we want to allow self linking between the nodes or not. For this, we can set self.link = 2 to allow them or self.link = 1 to prevent them.
# Prevent self linking.
sample$seurat_clusters2 <- sample$seurat_clusters
p <- SCpubr::do_ChordDiagramPlot(sample = sample,
                                 from = "seurat_clusters",
                                 to = "seurat_clusters2",
                                 self.link = 1,
                                 scale = TRUE)

p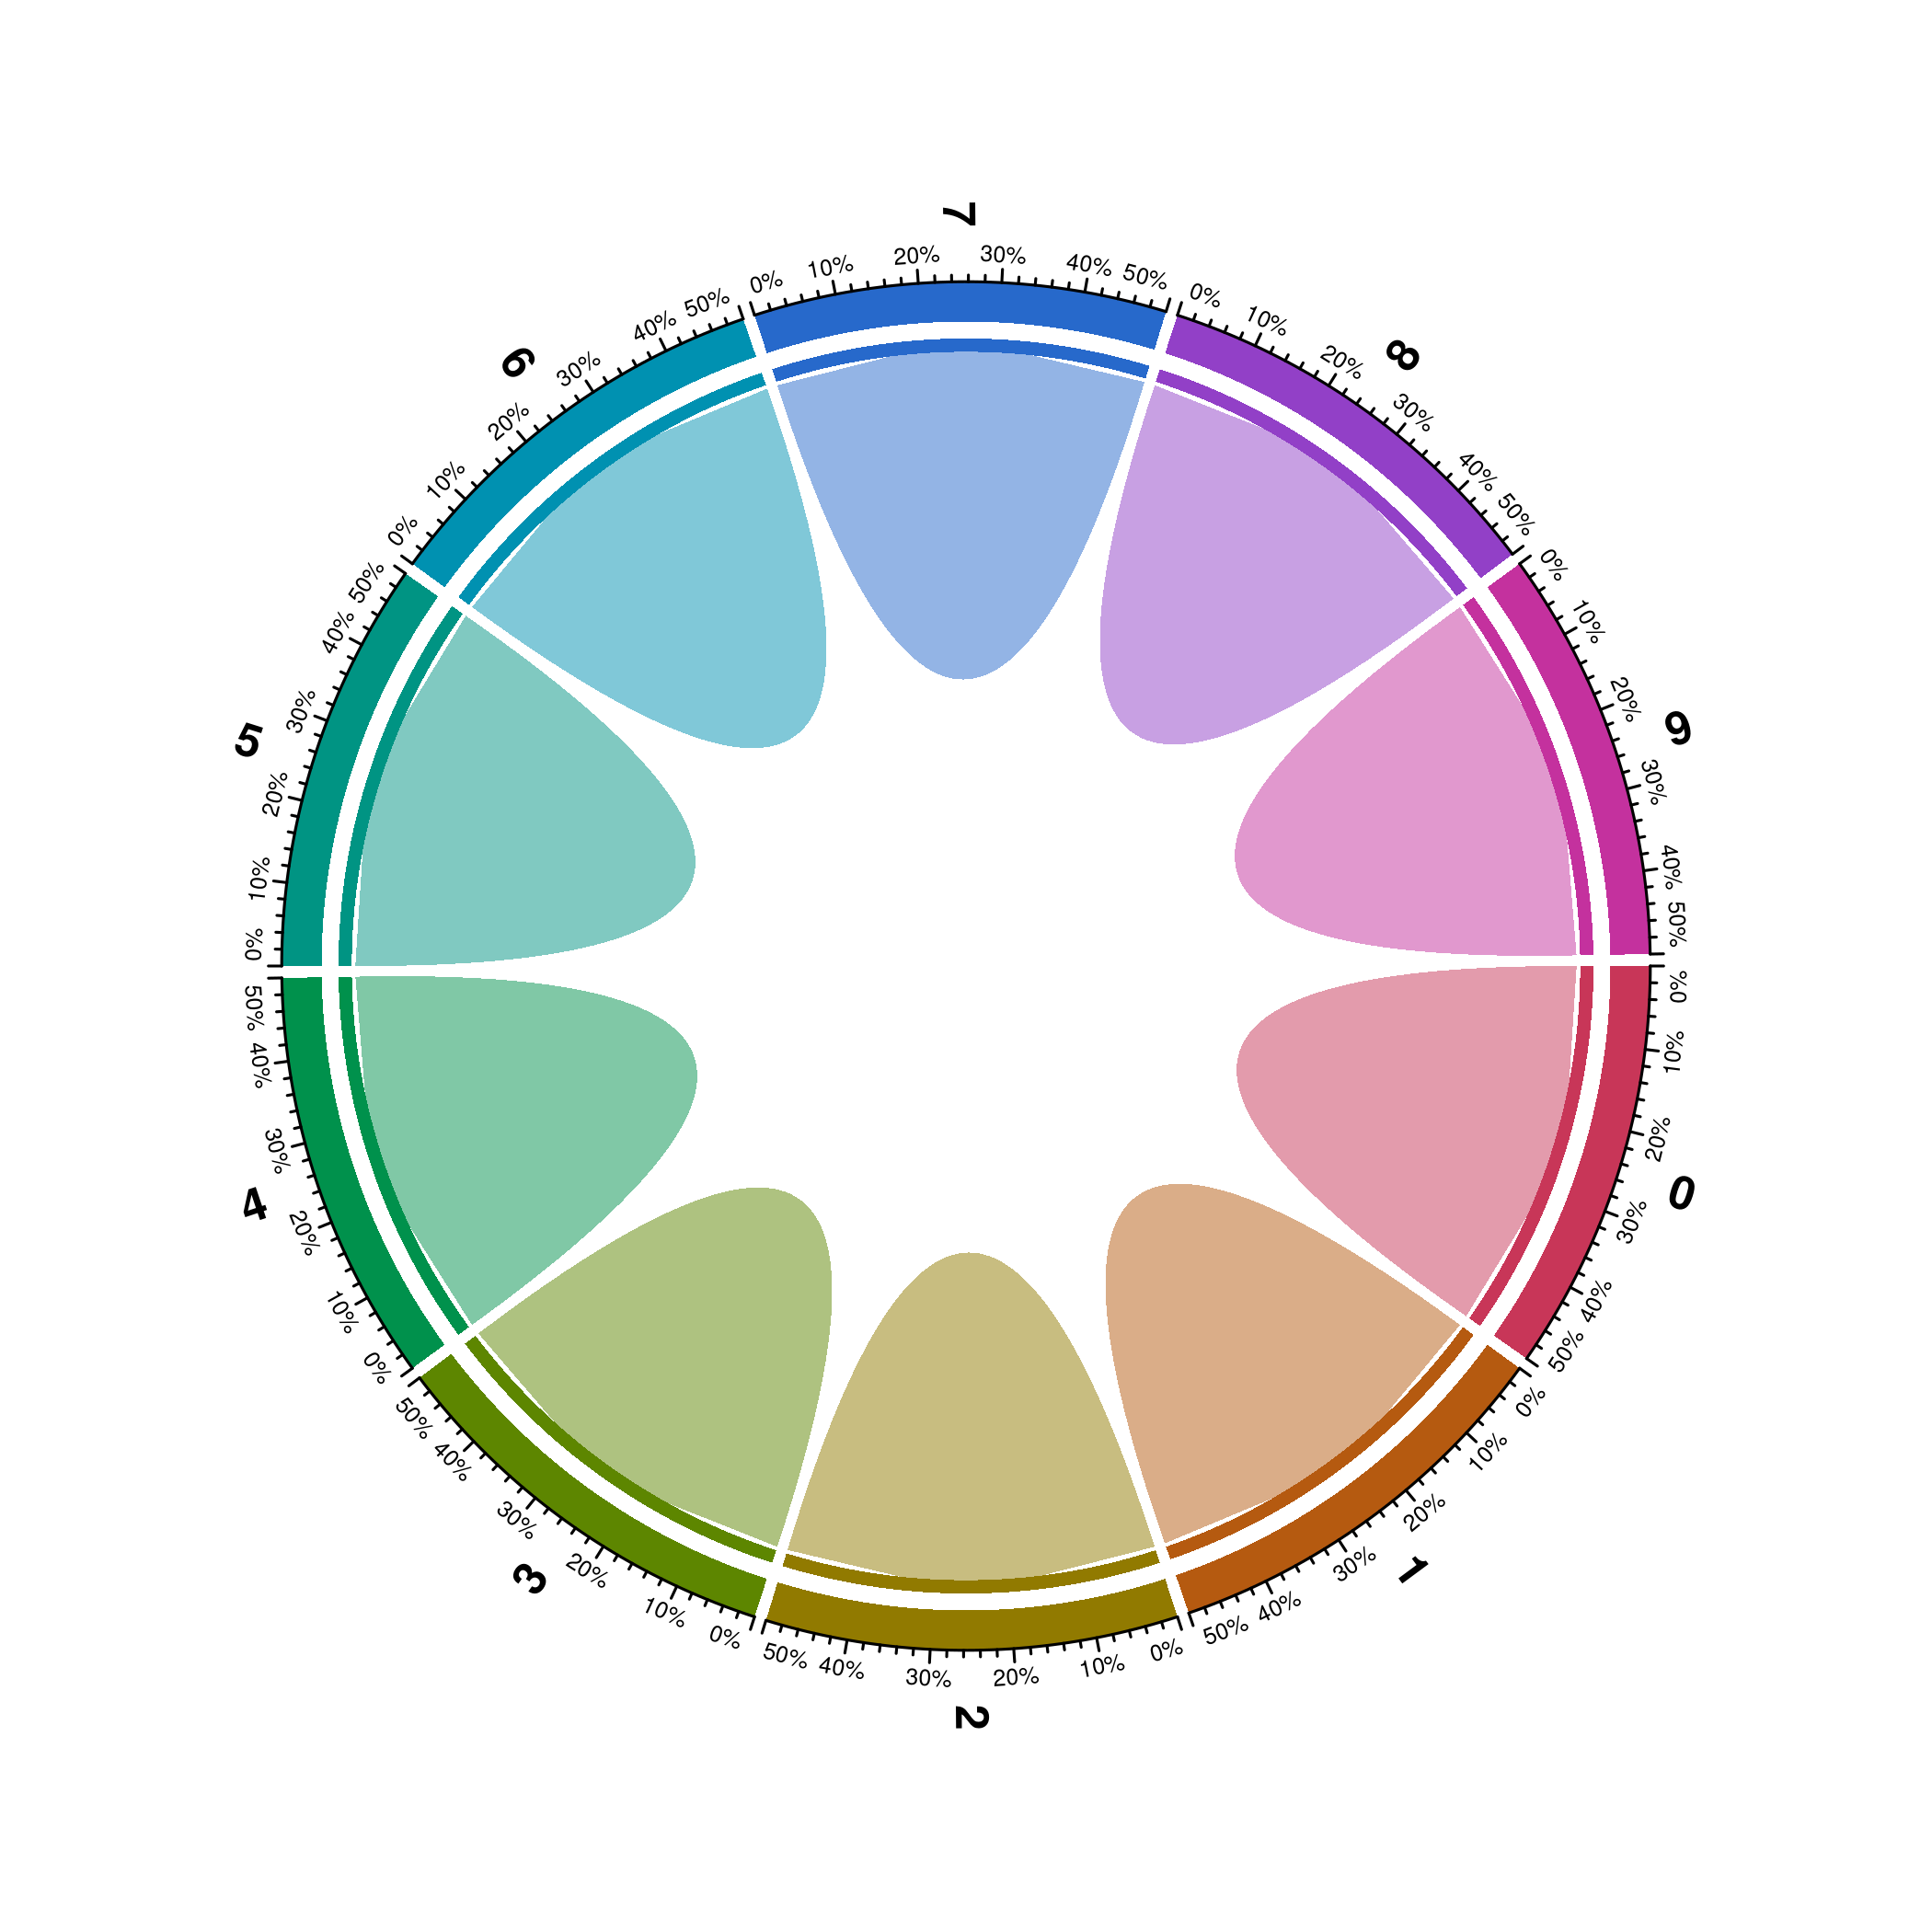
Chord Diagram with prevented self linking.
# Allow self linking.
p <- SCpubr::do_ChordDiagramPlot(sample = sample,
                                 from = "seurat_clusters",
                                 to = "seurat_clusters2",
                                 self.link = 2,
                                 scale = TRUE)

p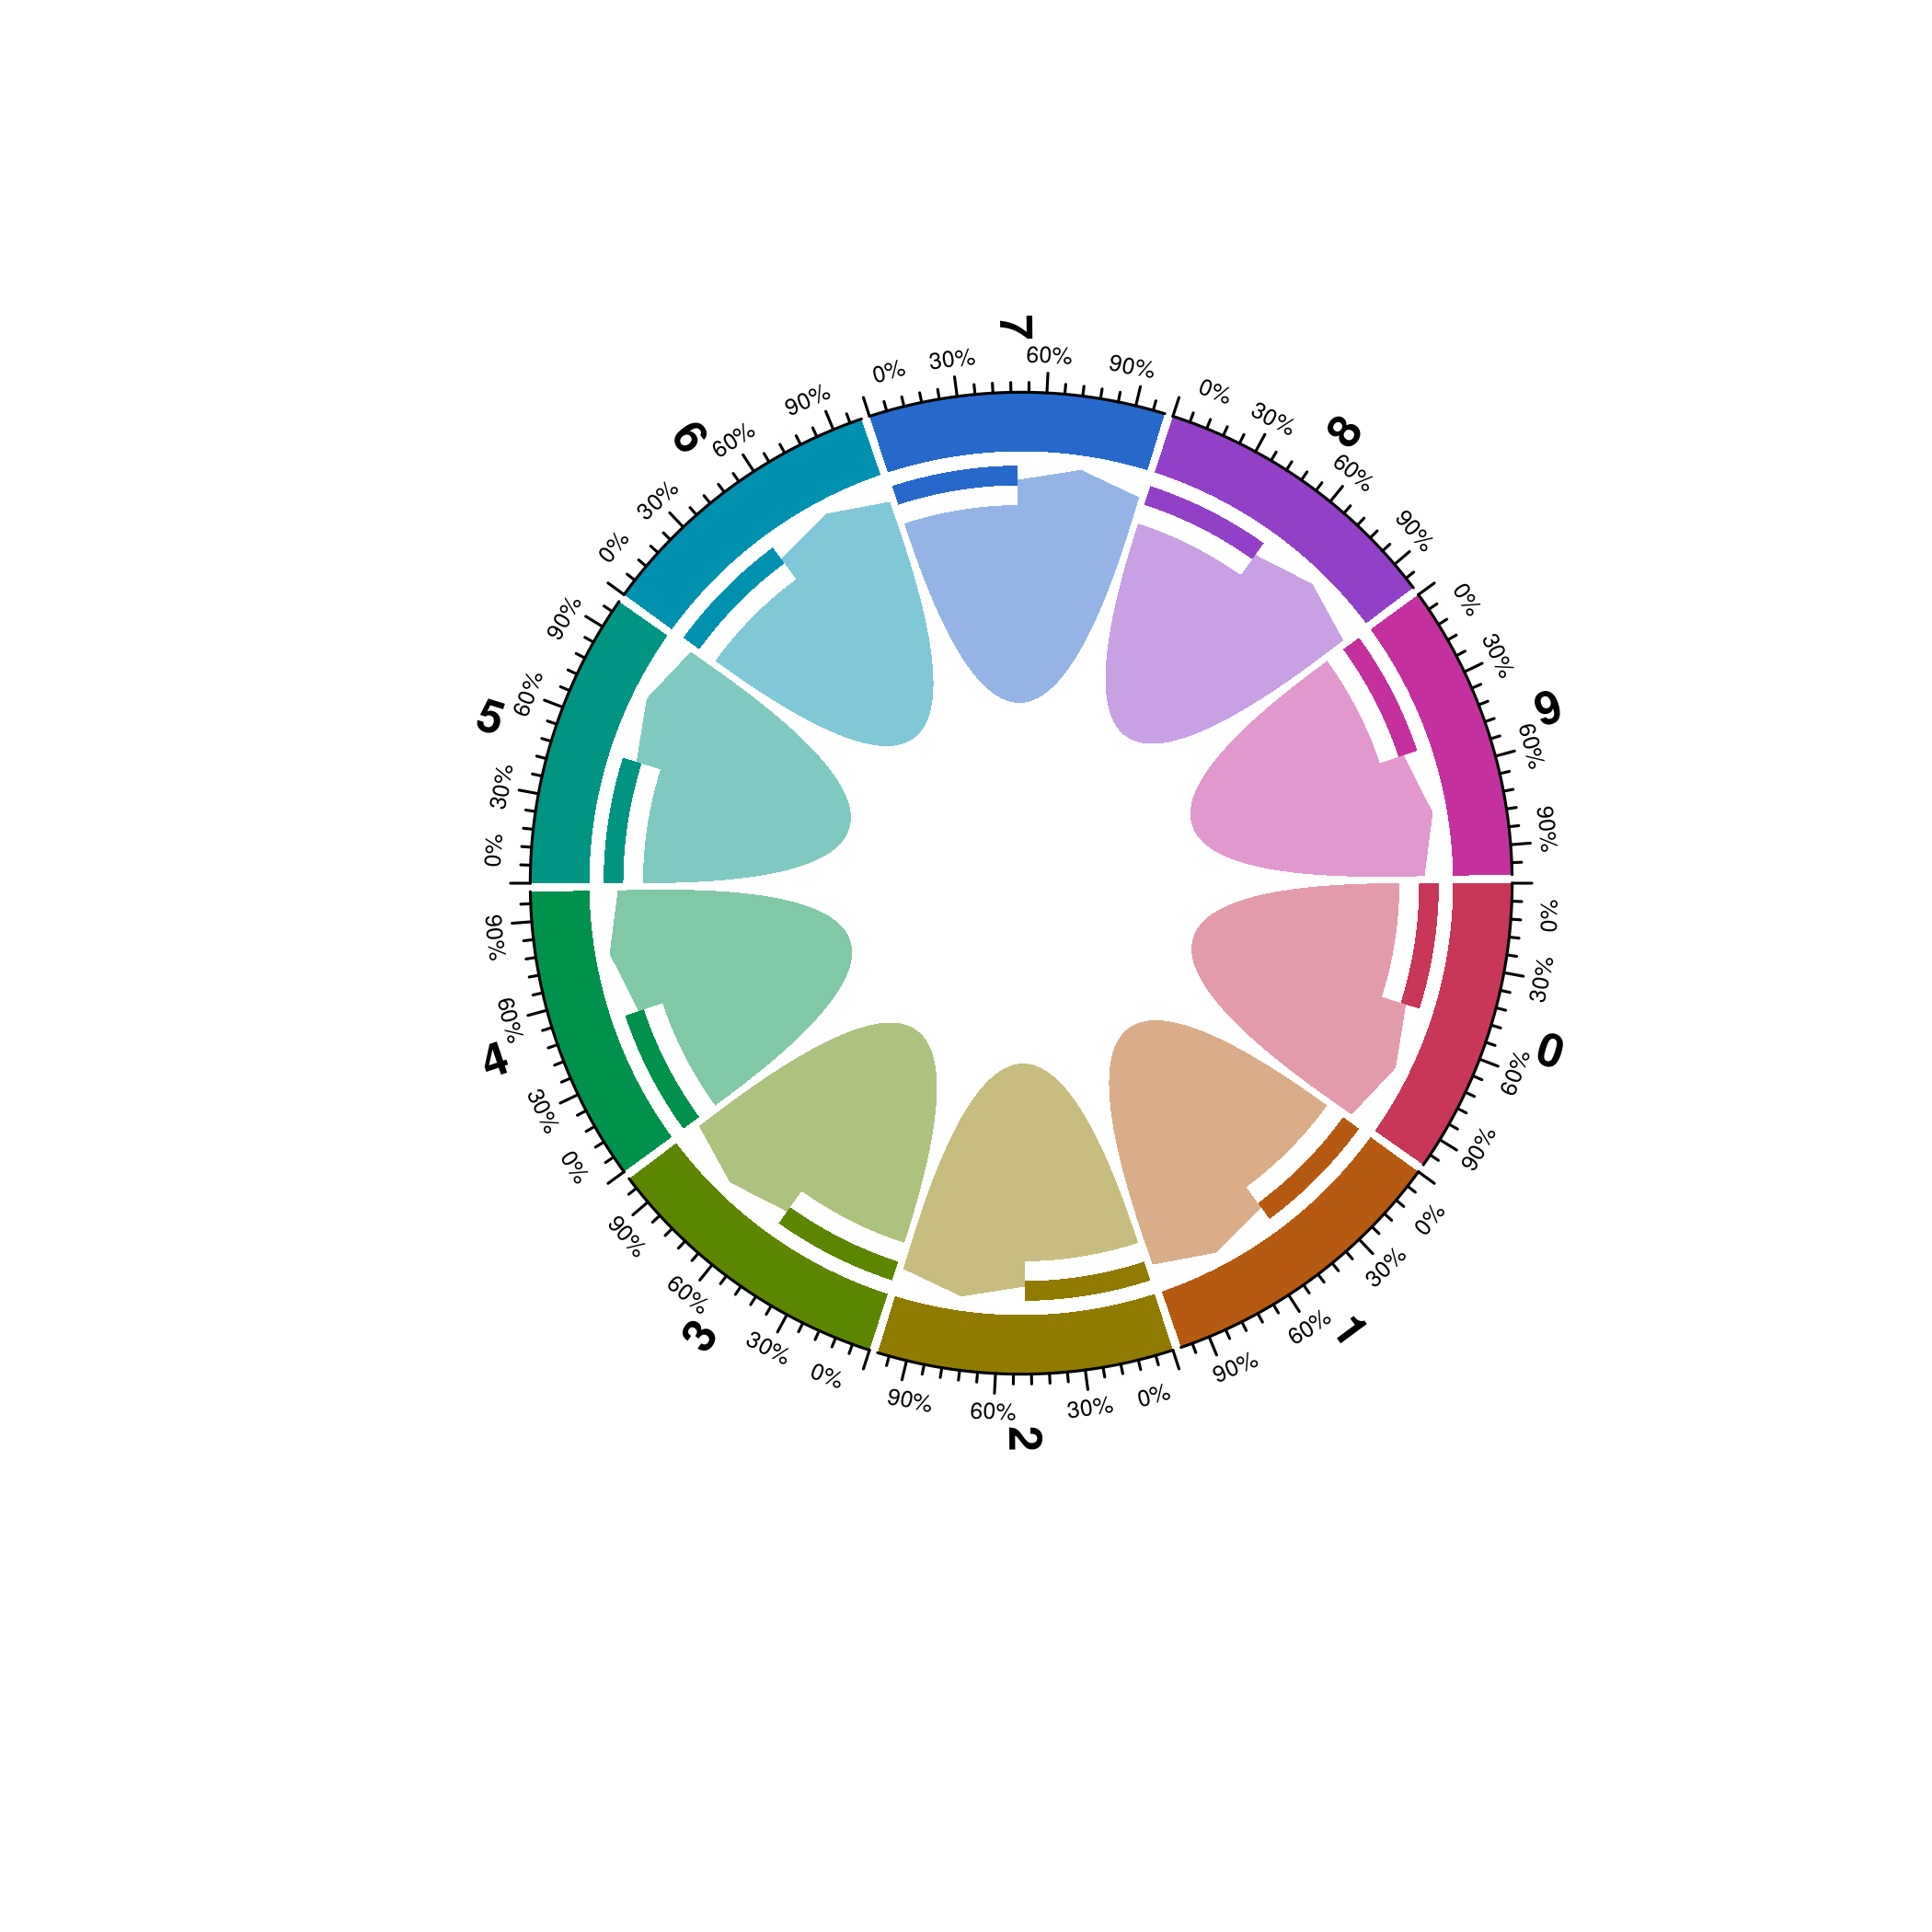
Chord Diagram with allowed self linking.
13.8 Control the appearance of the arrows
The arrows can be modified by using link.arr.type parameter:
# Set triangle arrows.
p <- SCpubr::do_ChordDiagramPlot(sample = sample,
                                 from = "seurat_clusters",
                                 to = "assignment",
                                 link.arr.type = "triangle")

p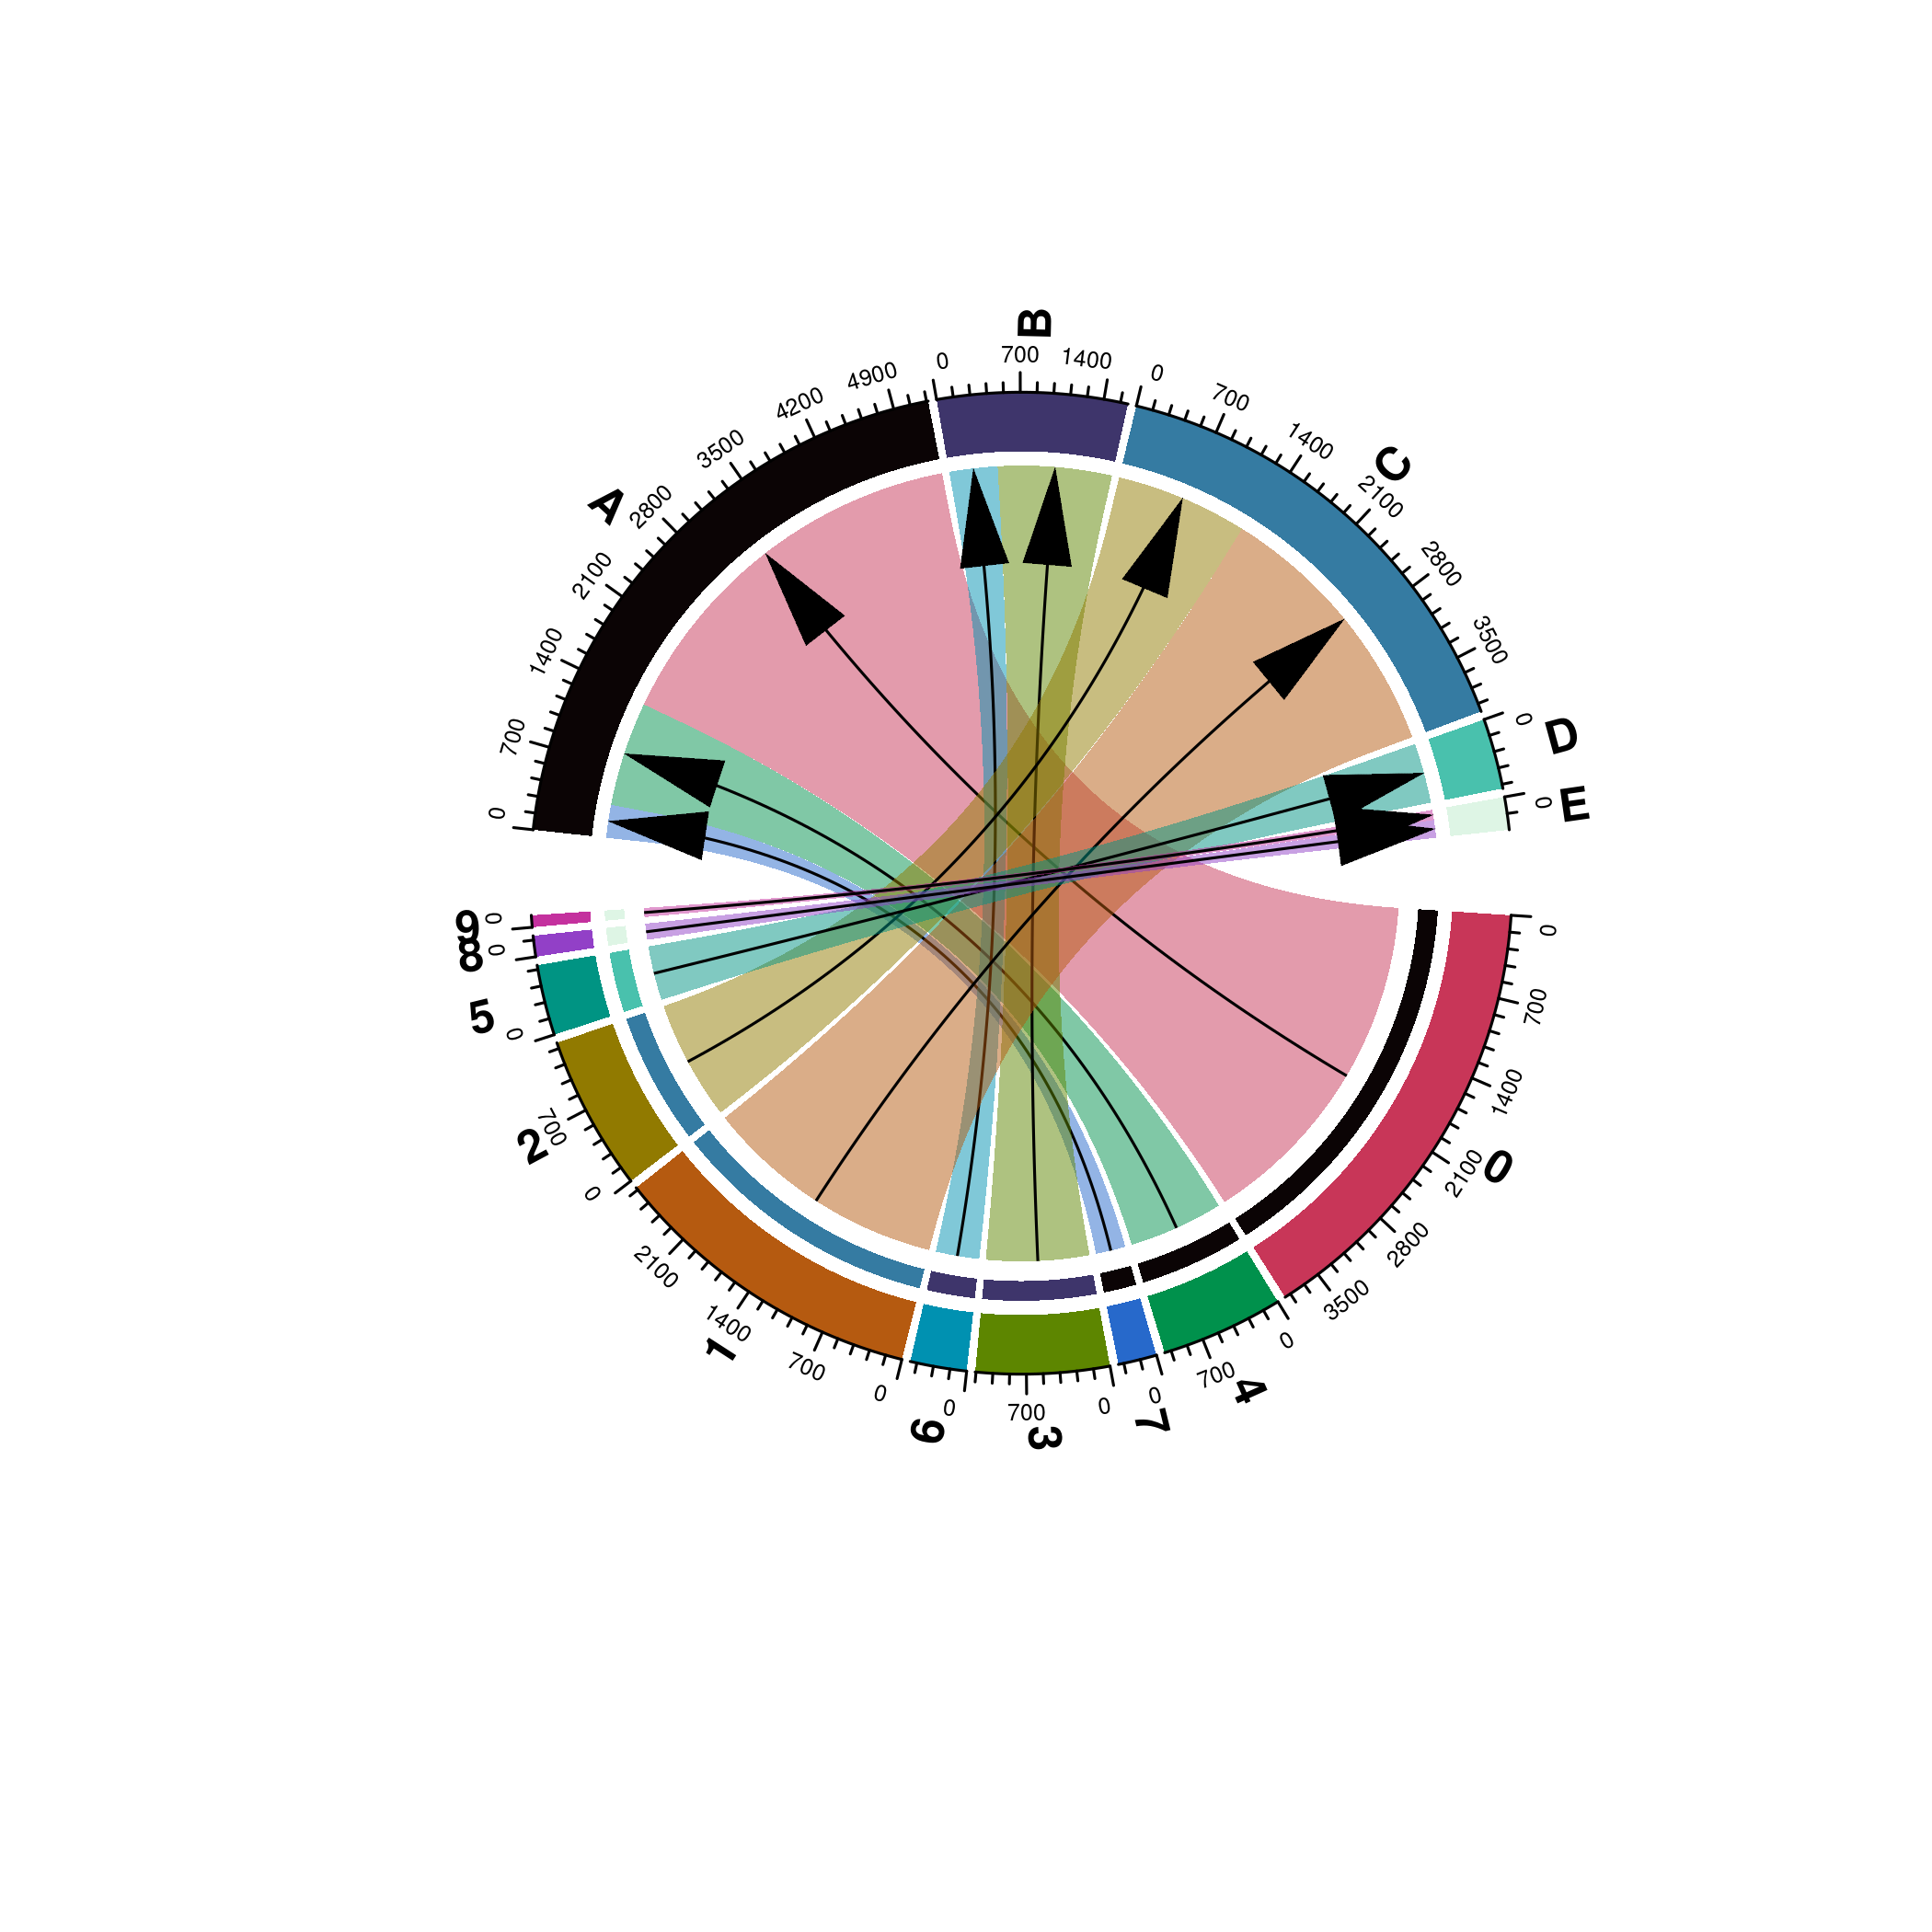
Chord Diagram with triangle arrows.
# Set big arrows.
p <- SCpubr::do_ChordDiagramPlot(sample = sample,
                                 from = "seurat_clusters",
                                 to = "assignment",
                                 link.arr.type = "big.arrow")

p
Chord Diagram with big arrows.