9 Box plots
9.1 Basic usage
To generate a basic box plot you need to provide the seurat object and a feature to plot:
# Basic box plot.
p <- SCpubr::do_BoxPlot(sample = sample,
                        feature = "nCount_RNA")
p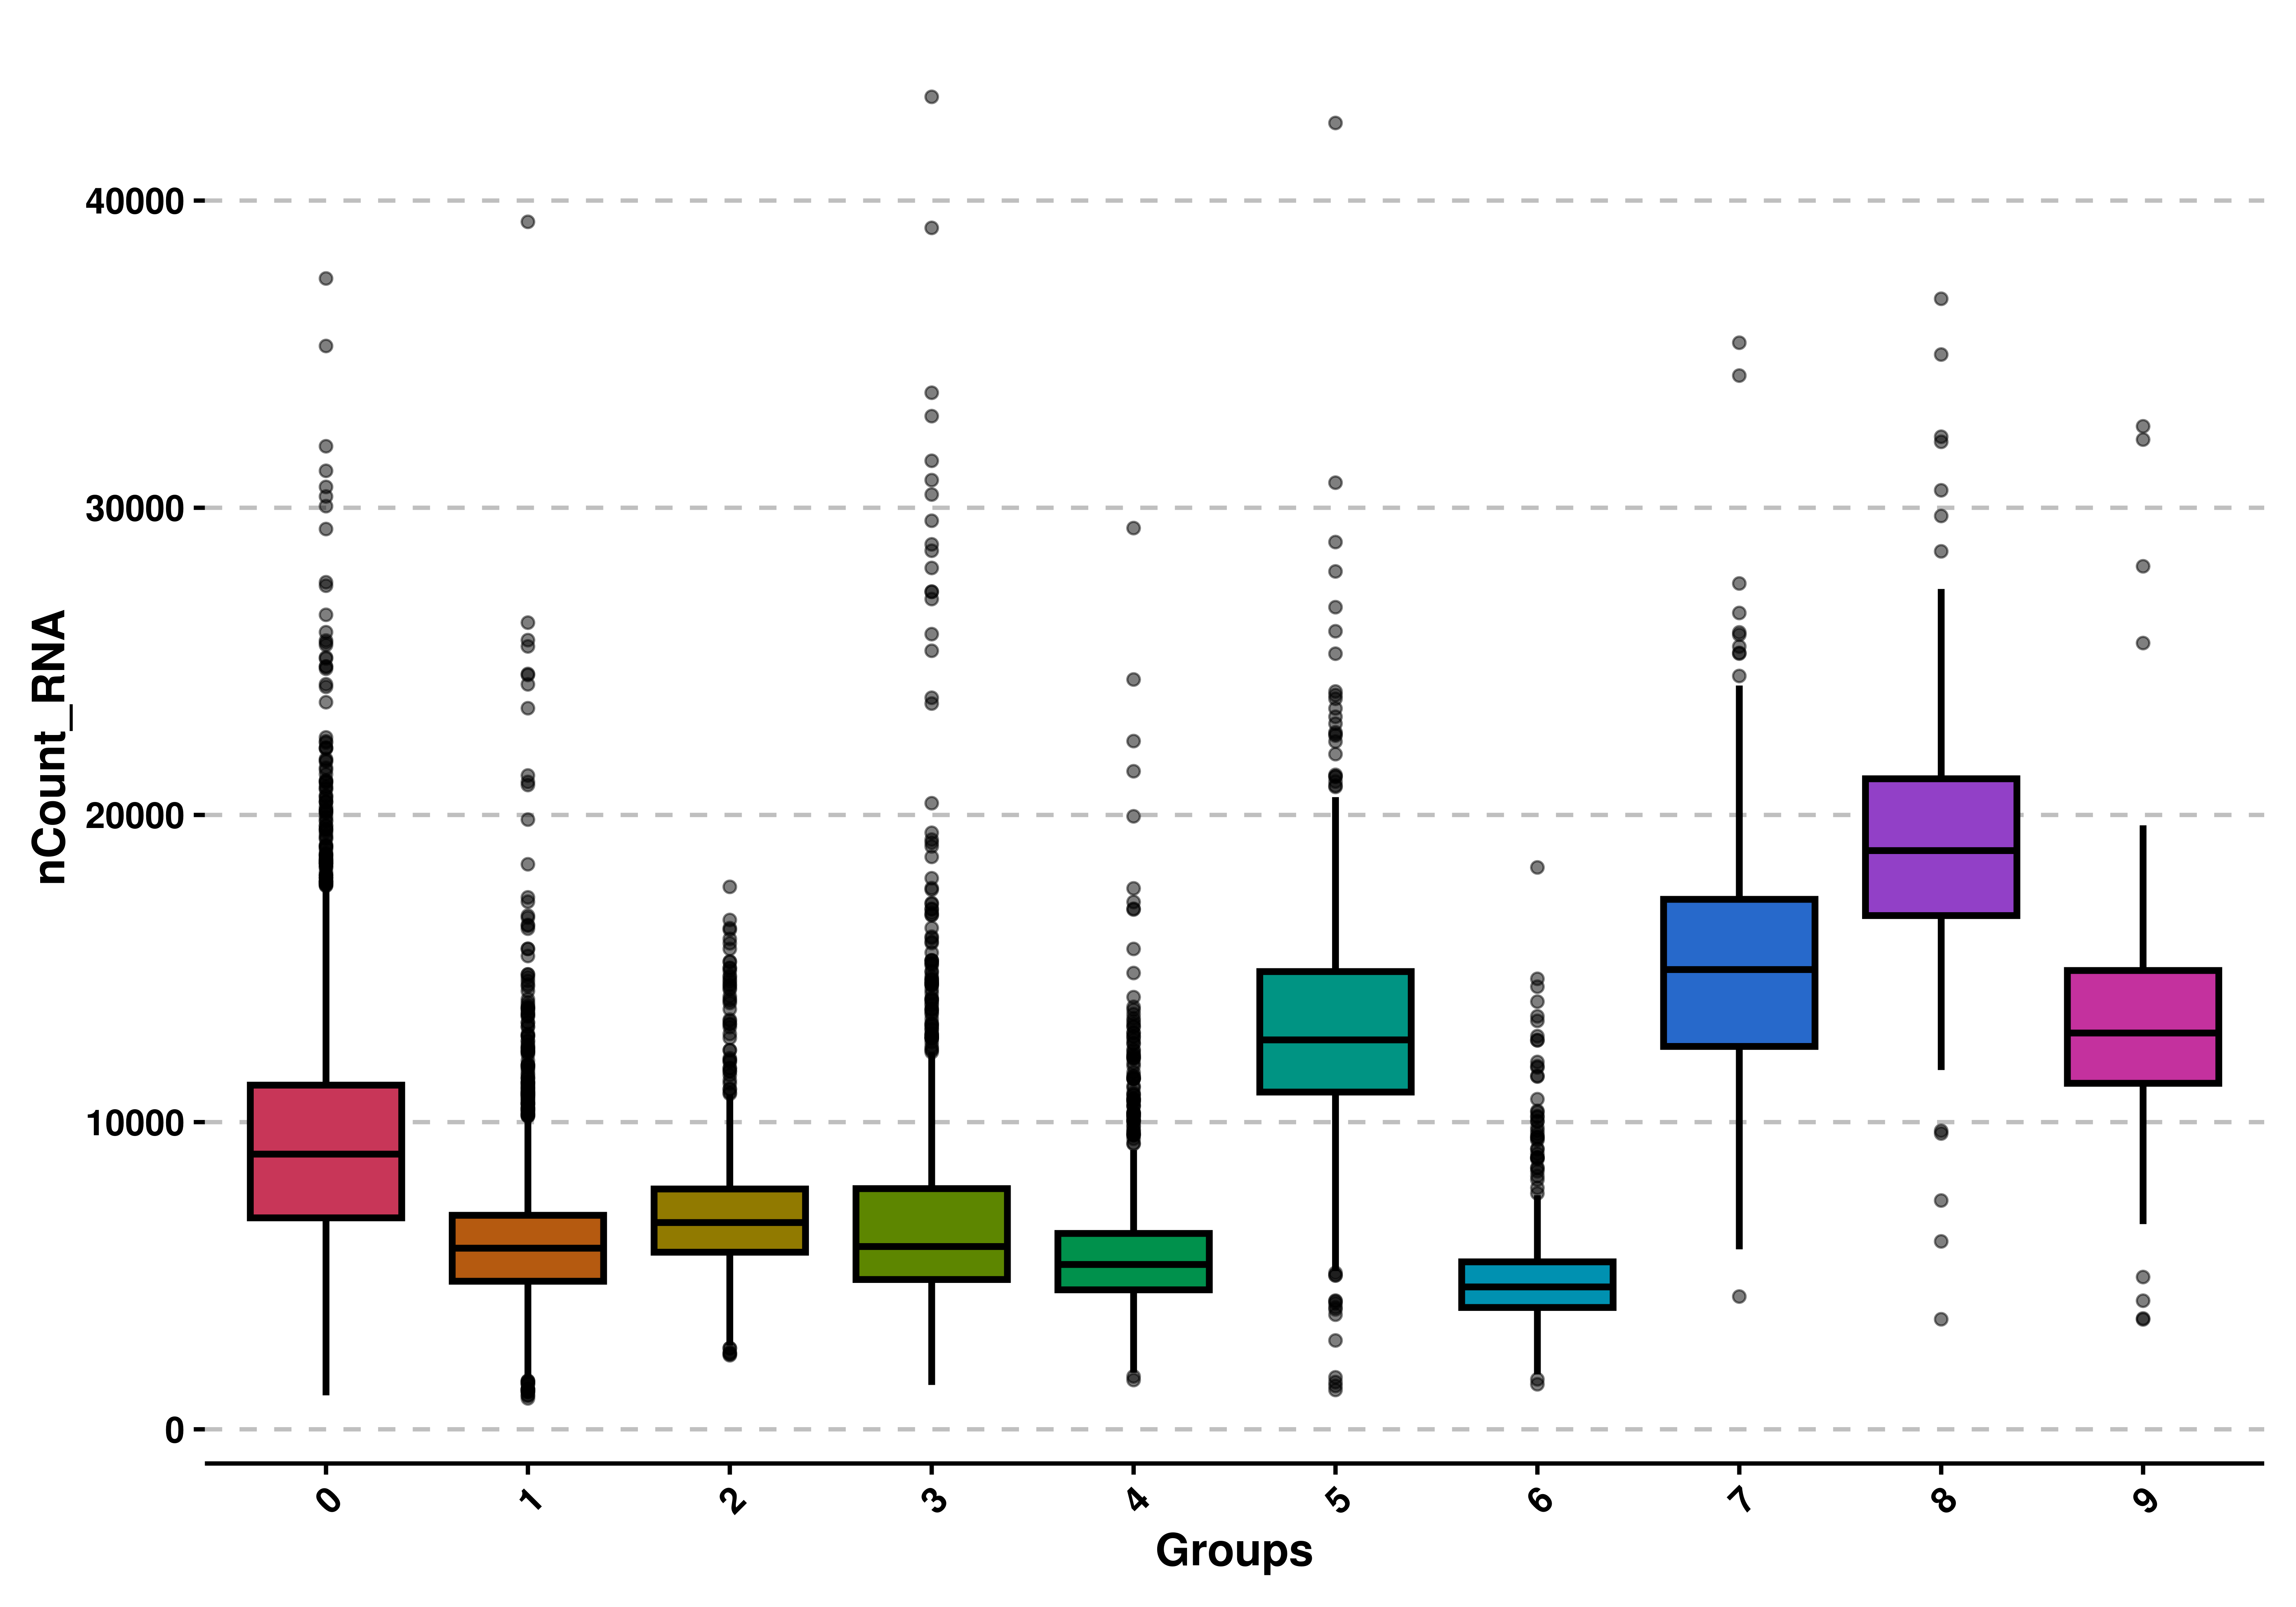
9.2 Use custom grouping
By default, the groups are the identities in the seurat object, but this can be controlled using group.by parameter.
# Generate a custom group.
sample$custom_group = ifelse(colnames(sample) %in% sample(colnames(sample), 4000), "A", "B")

# Use custom grouping.
p <- SCpubr::do_BoxPlot(sample = sample,
                        feature = "nCount_RNA",
                        group.by = "custom_group")
p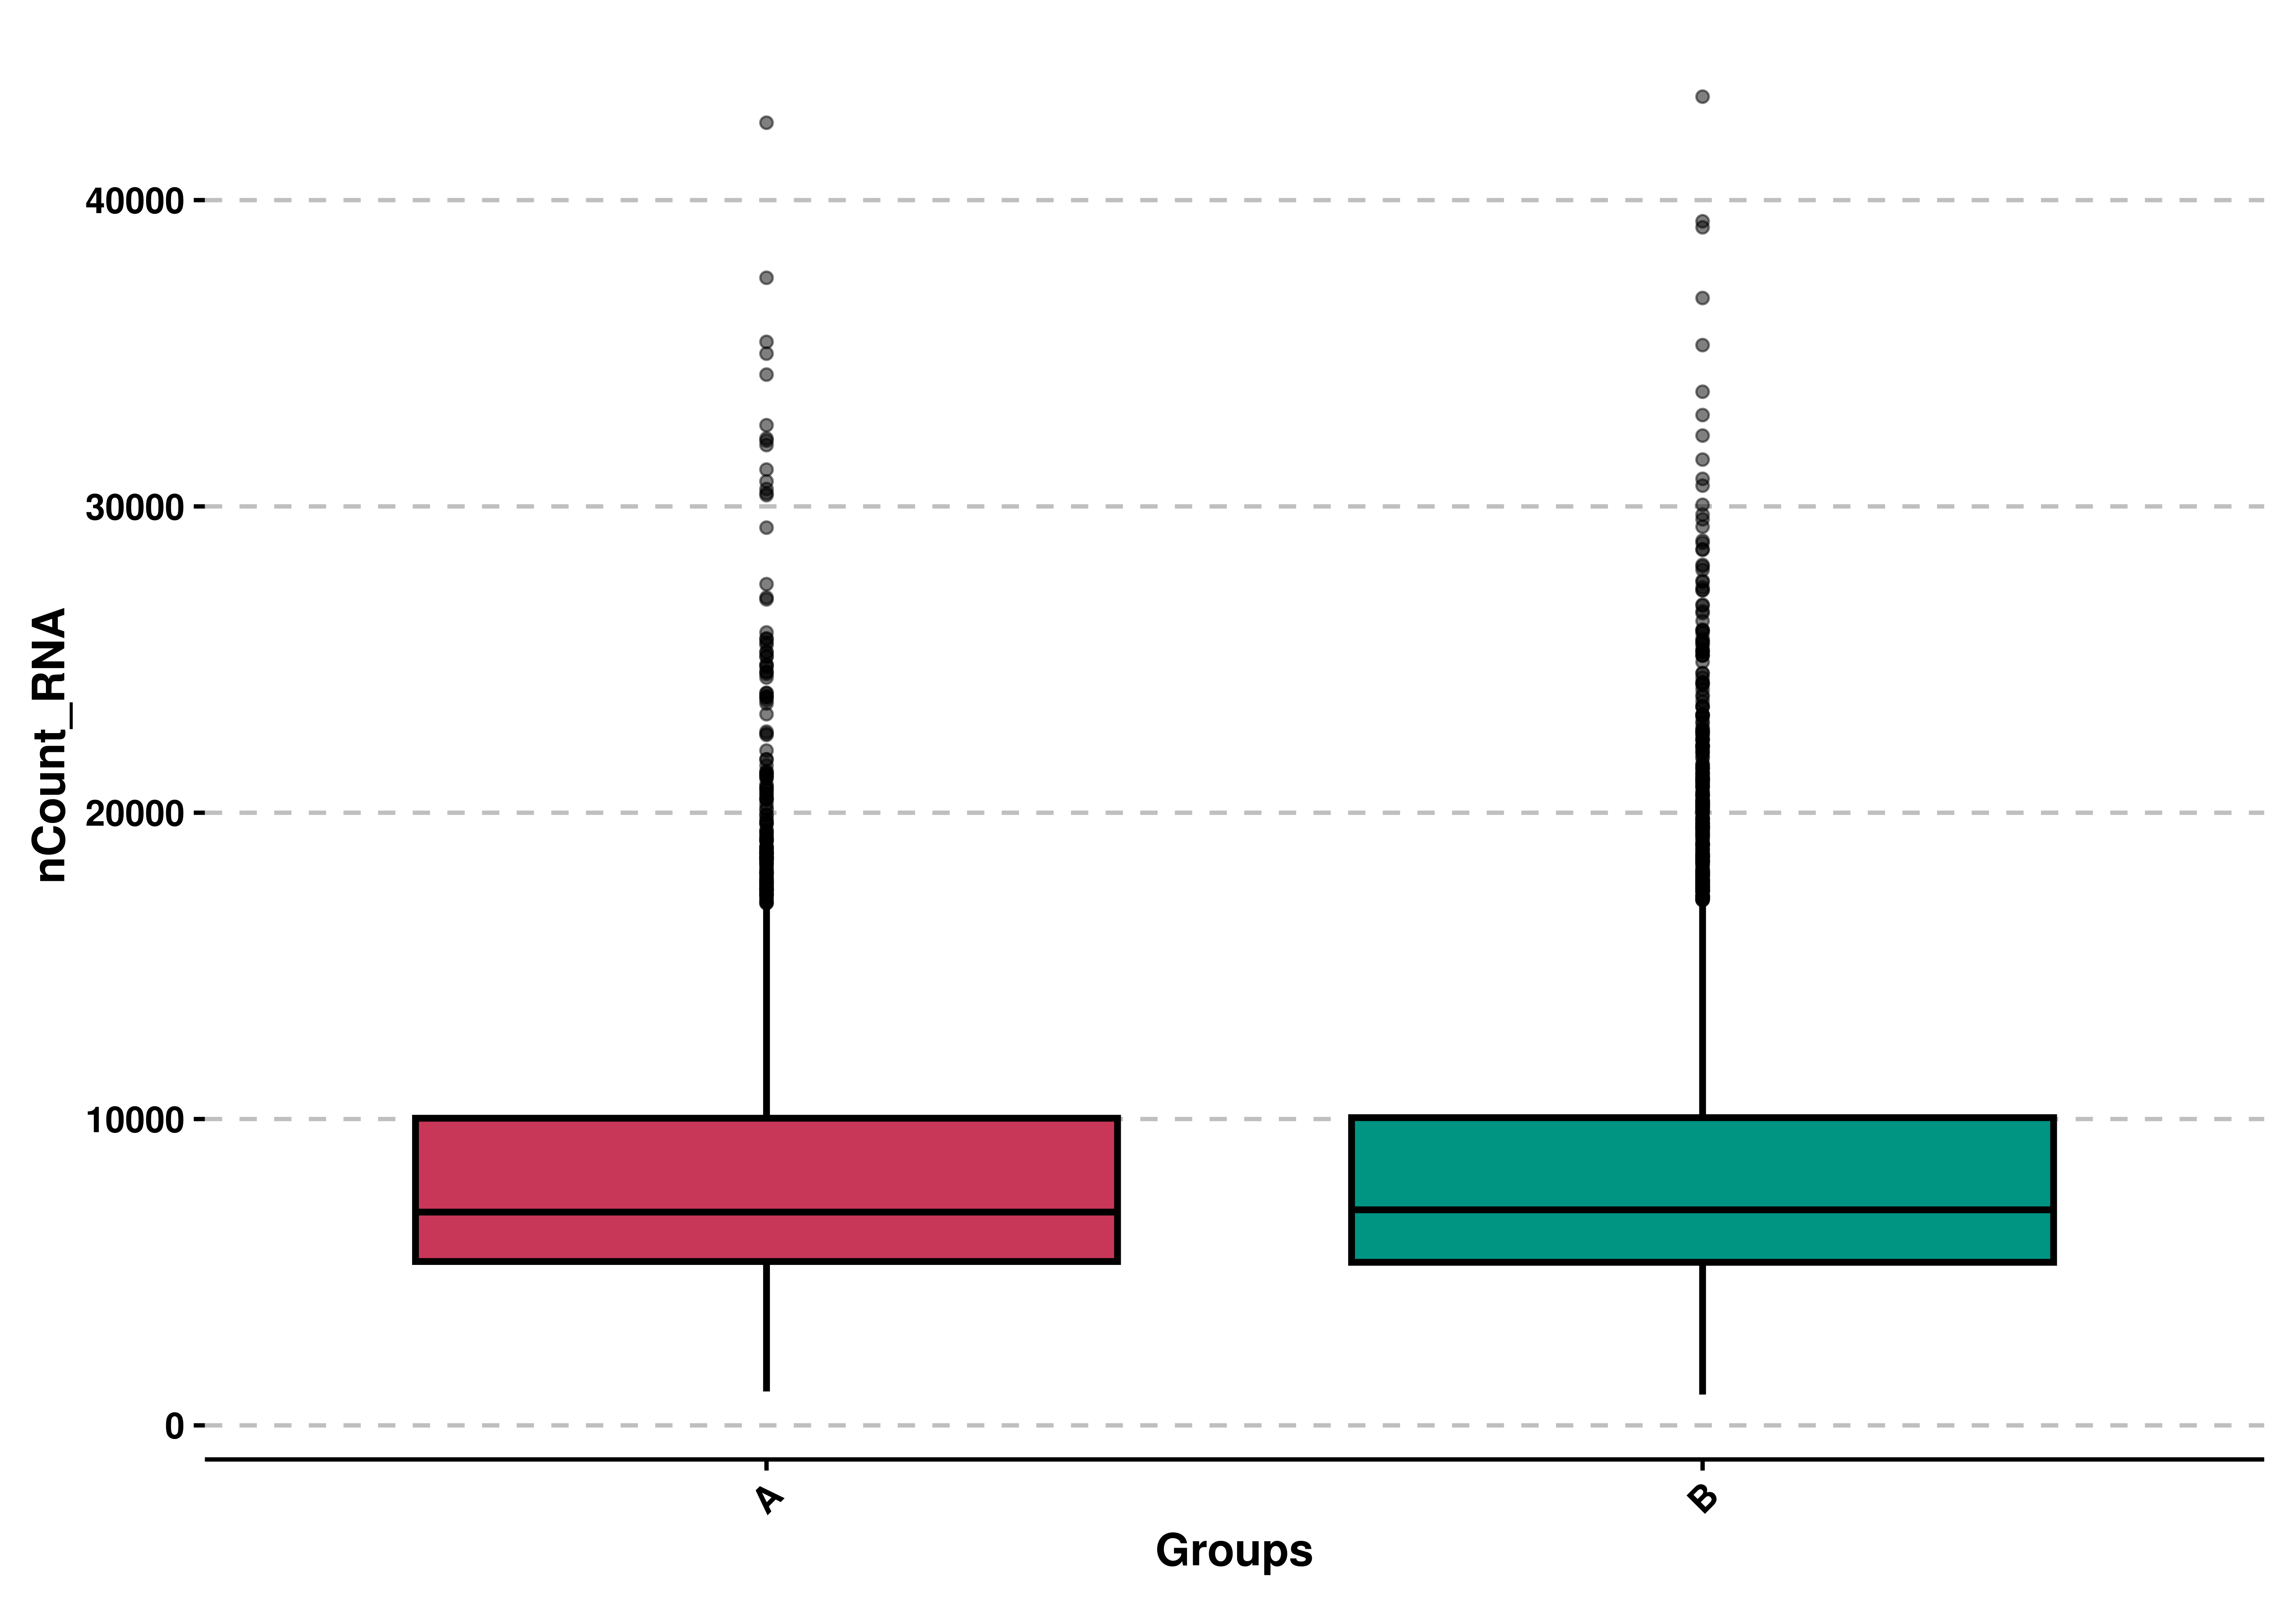
We can flip the plot if needed with flip = TRUE:
# Flip the box plot.
p <- SCpubr::do_BoxPlot(sample = sample,
                        feature = "nCount_RNA",
                        flip = TRUE)
p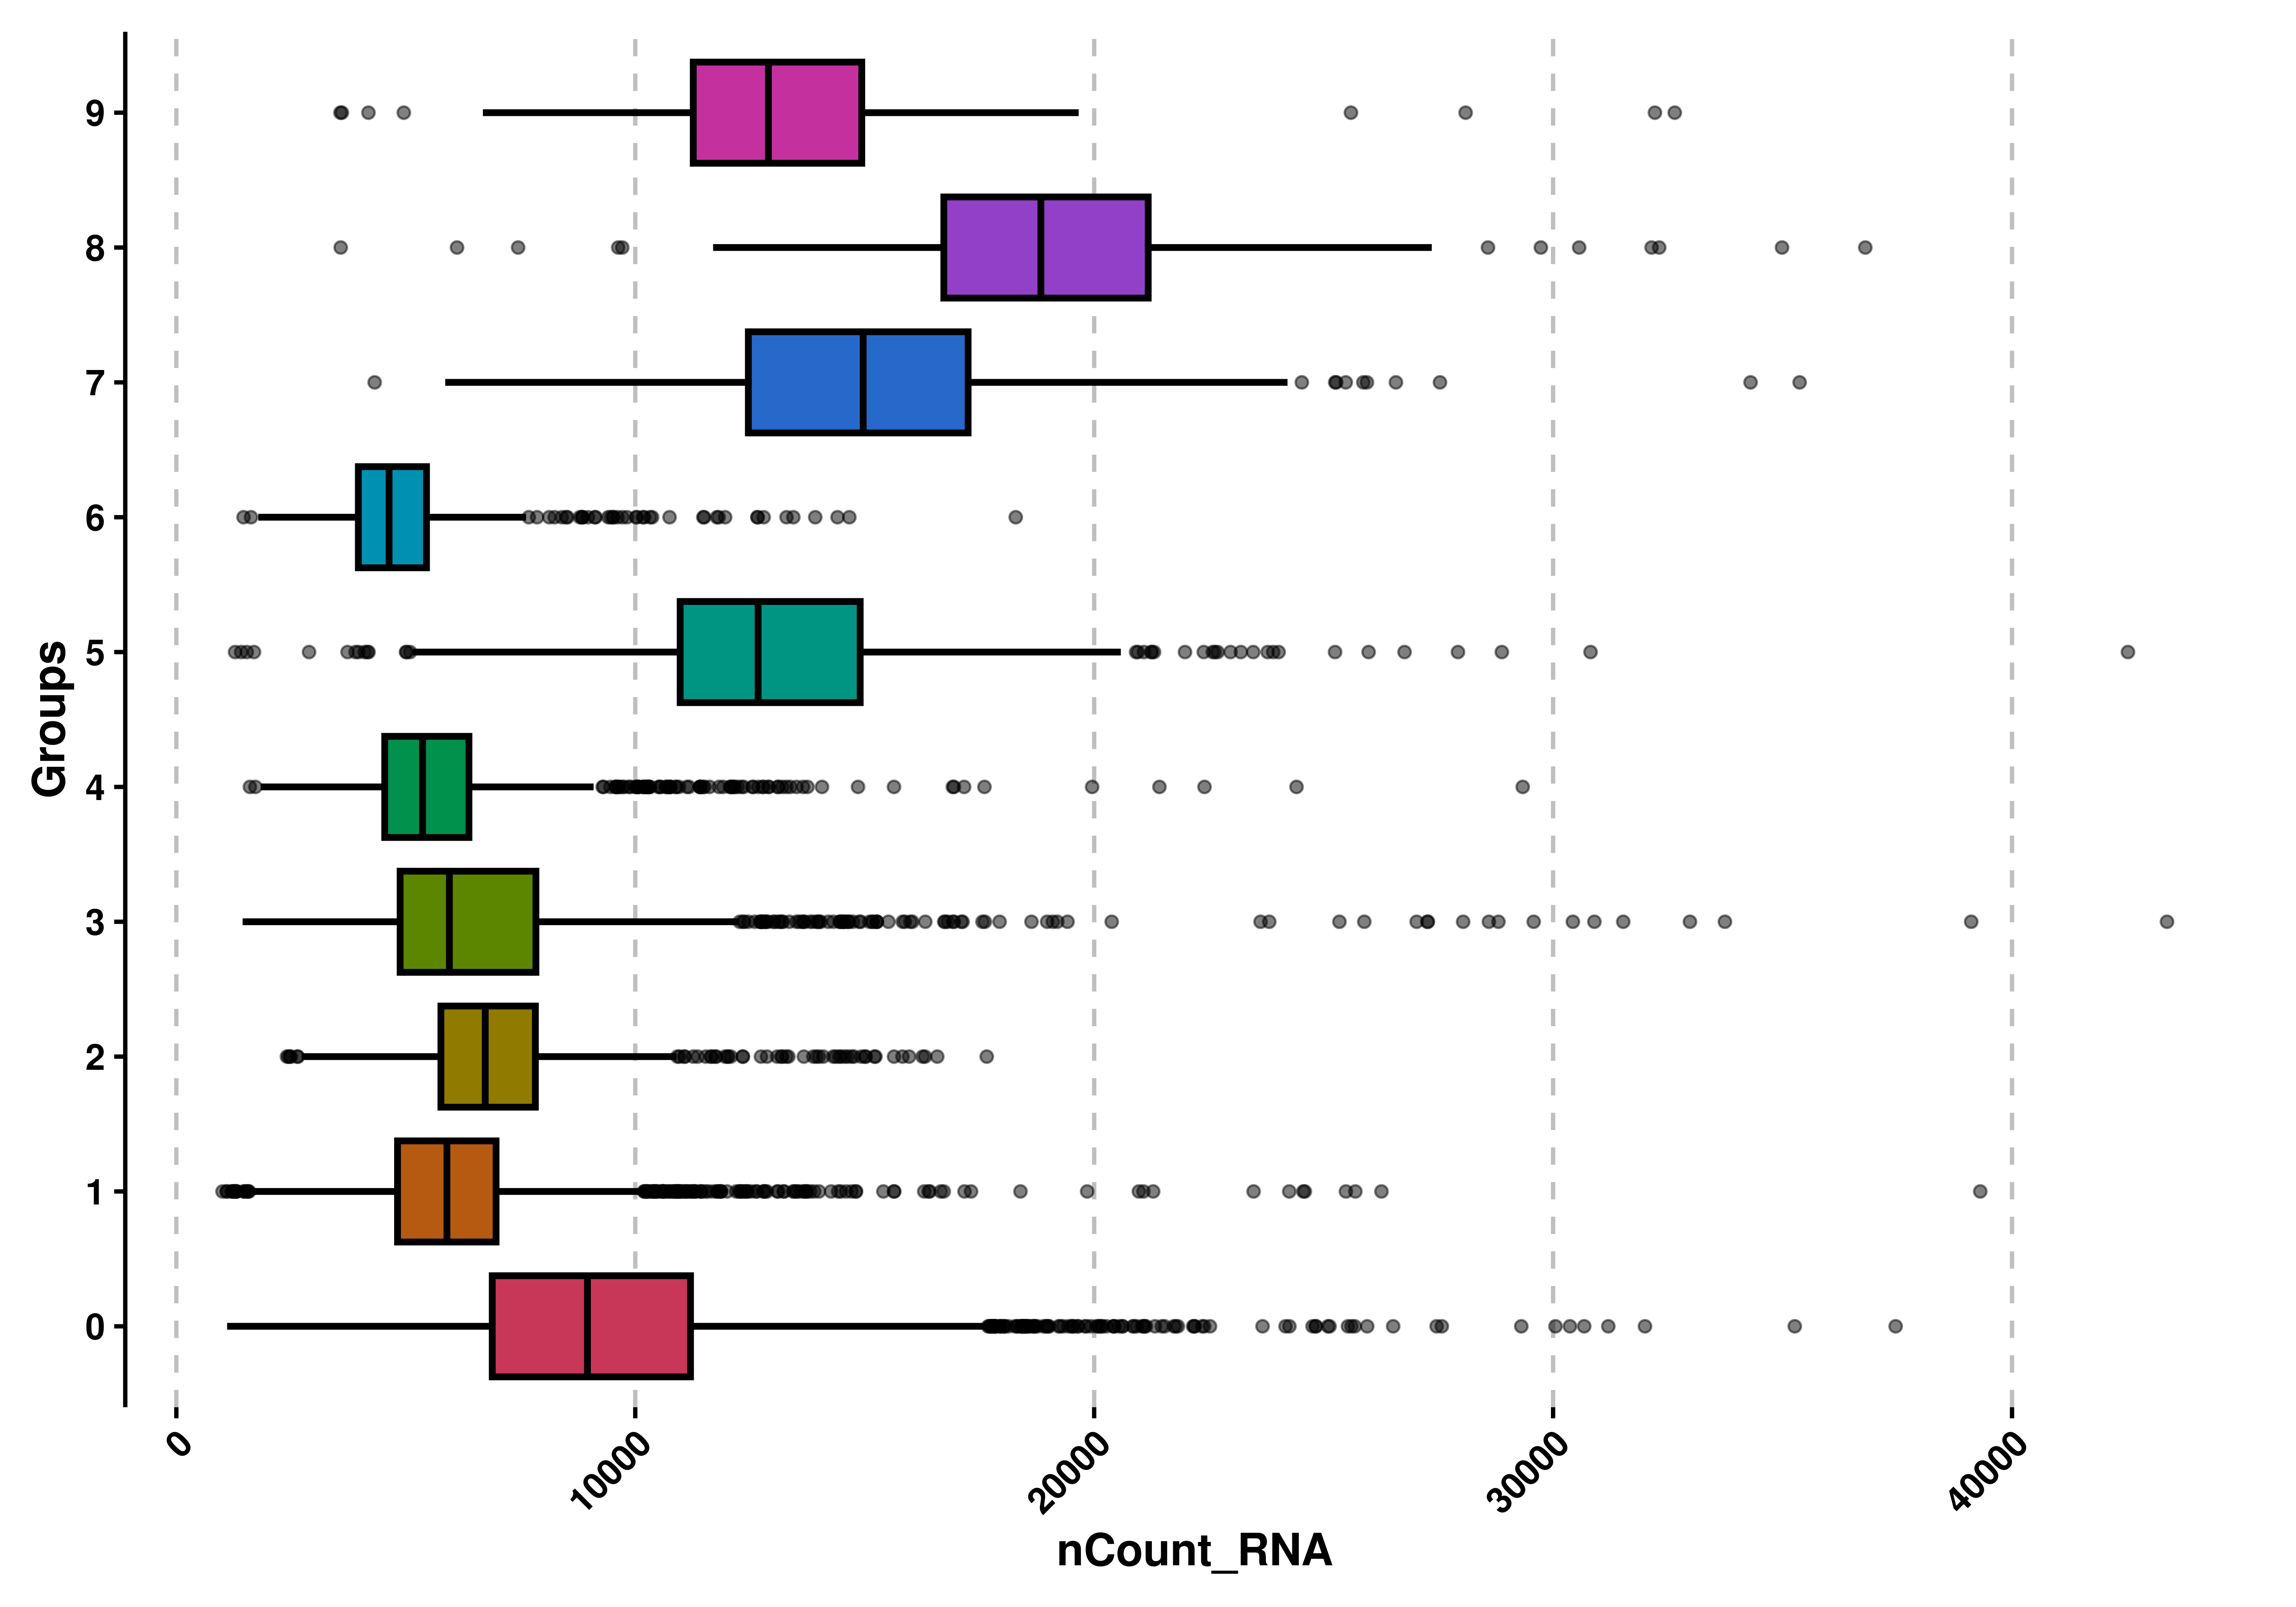
9.3 Modify aesthetic style
We can also apply another aesthetic style, which just colors the lines of the boxplots and leave the rest white with use_silhouette = TRUE:
# Use silhouette style.
p <- SCpubr::do_BoxPlot(sample = sample,
                        feature = "nCount_RNA",
                        use_silhouette = TRUE)
p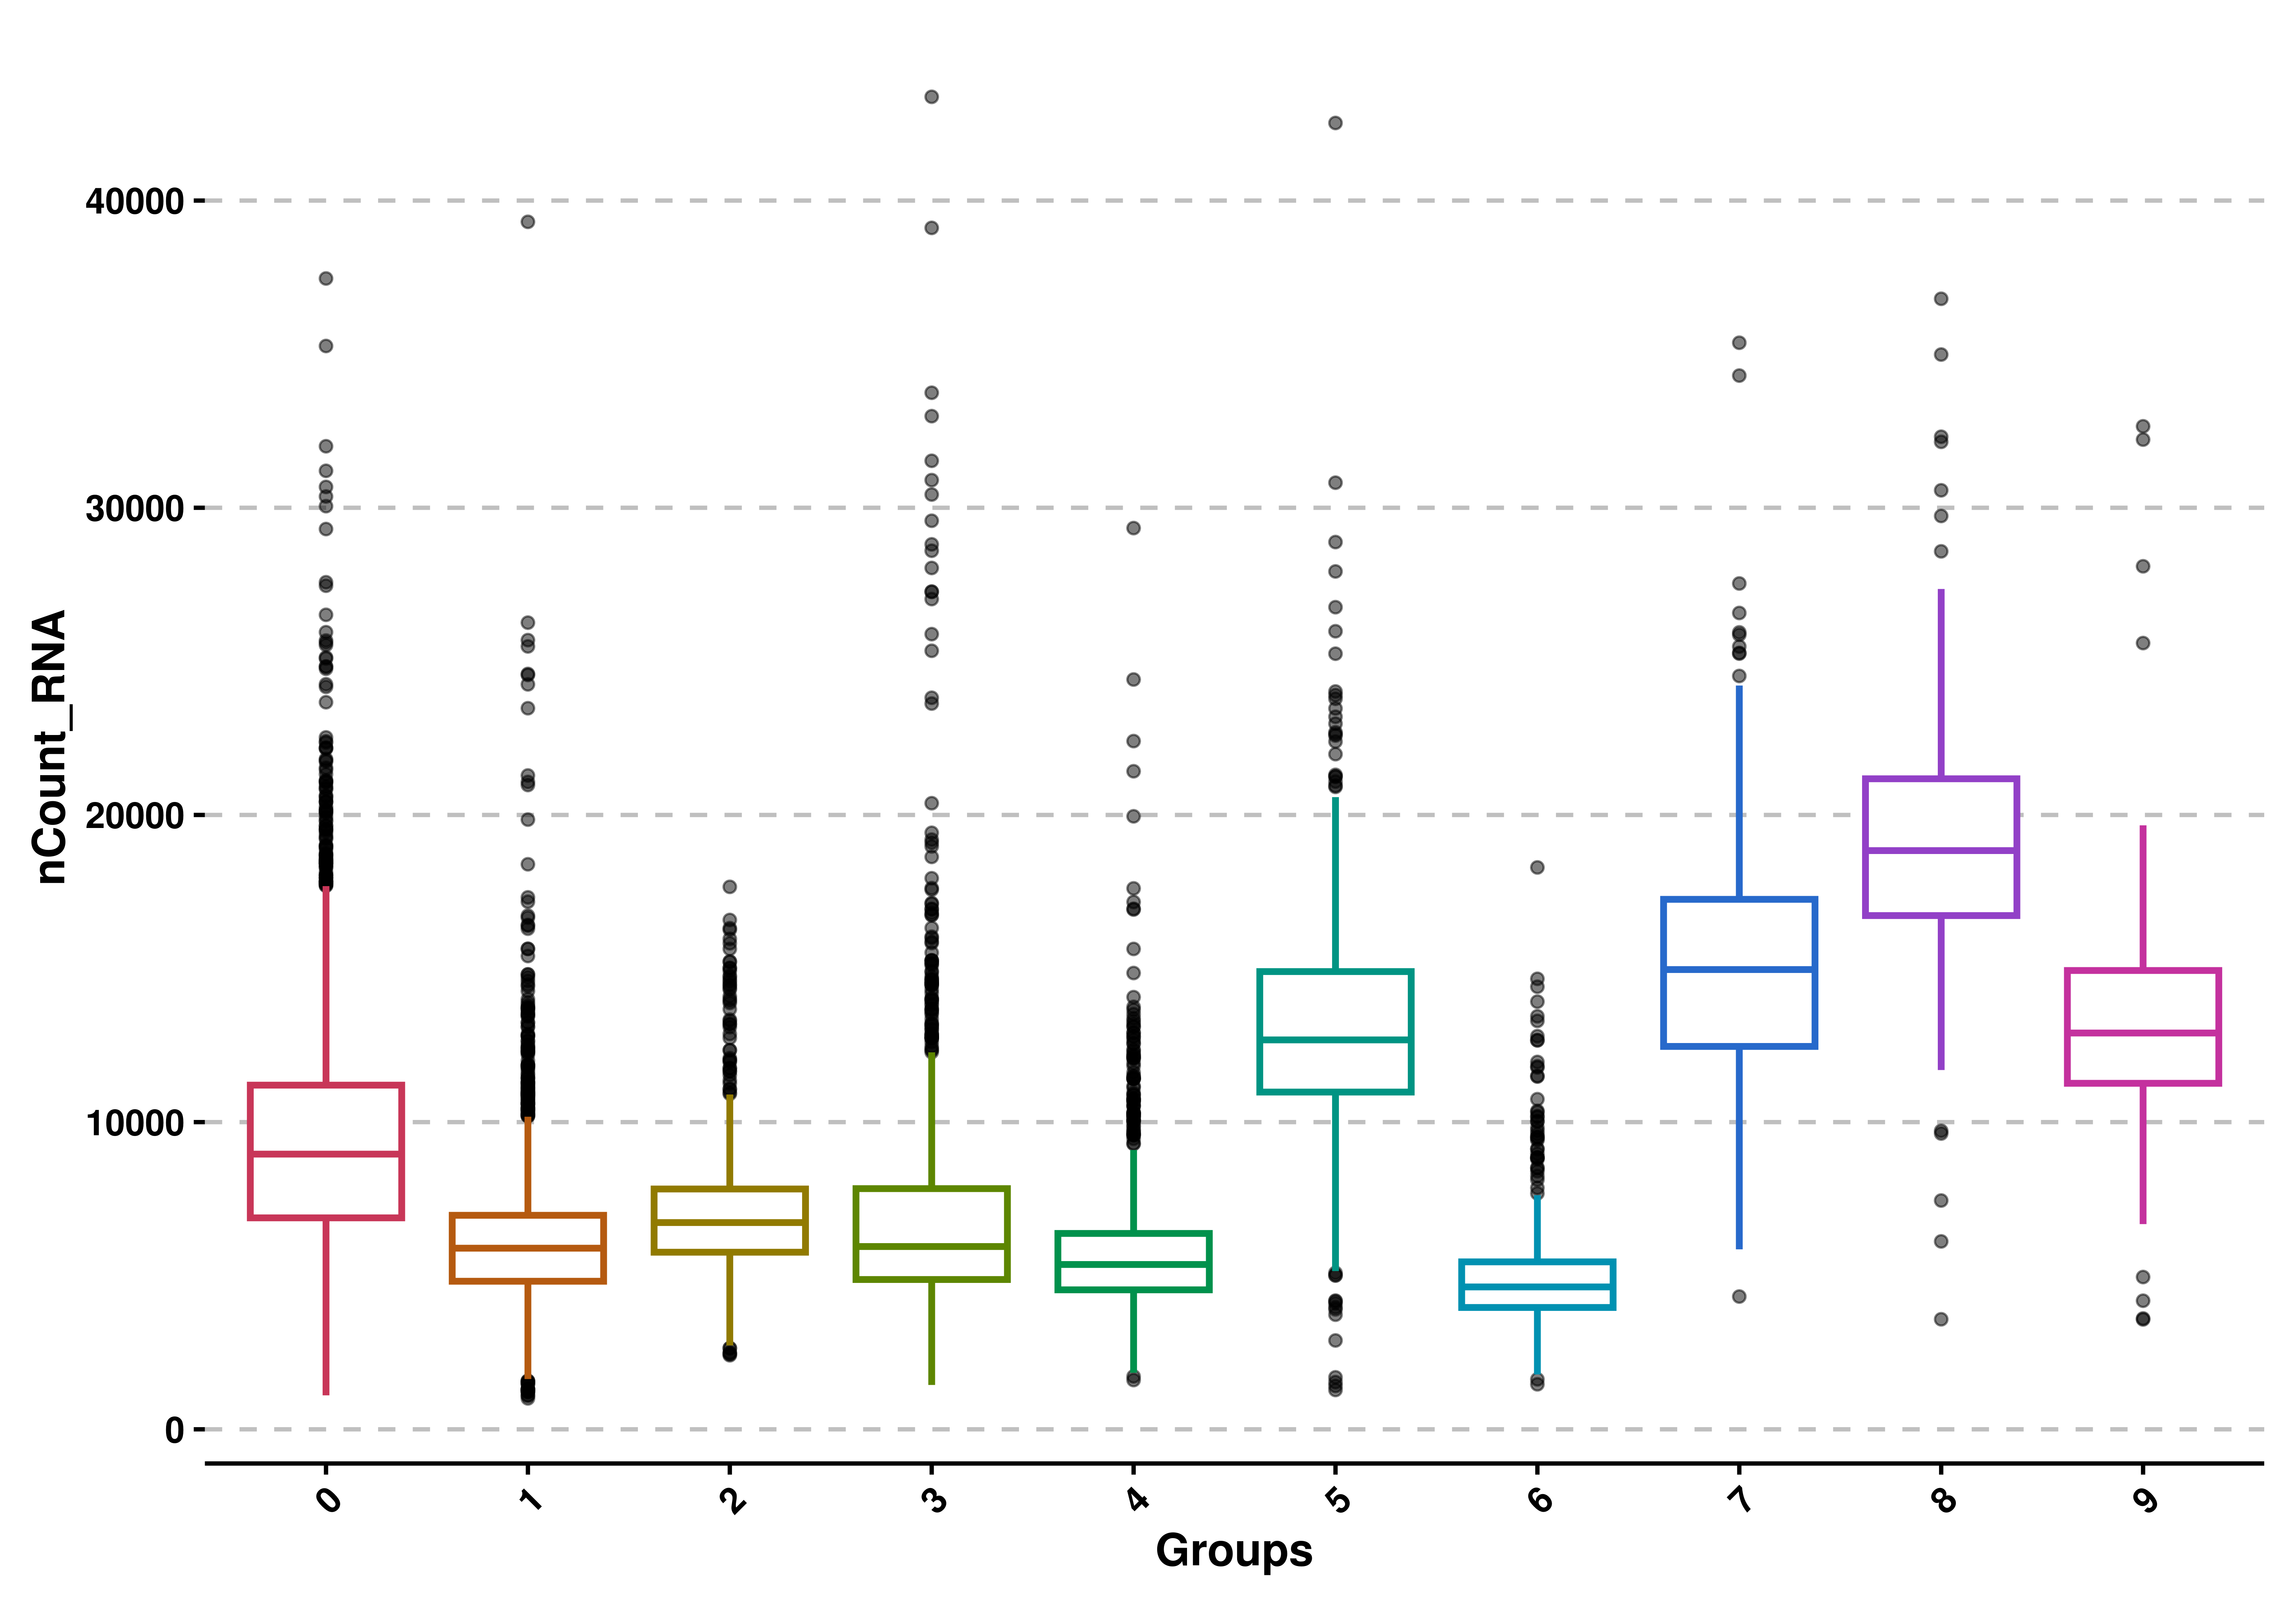
9.4 Reorder by mean values
We can reorder the values by their average mean, from highest to lowest with order = TRUE:
# Order by mean values.
p <- SCpubr::do_BoxPlot(sample = sample,
                        feature = "nCount_RNA",
                        order = TRUE)
p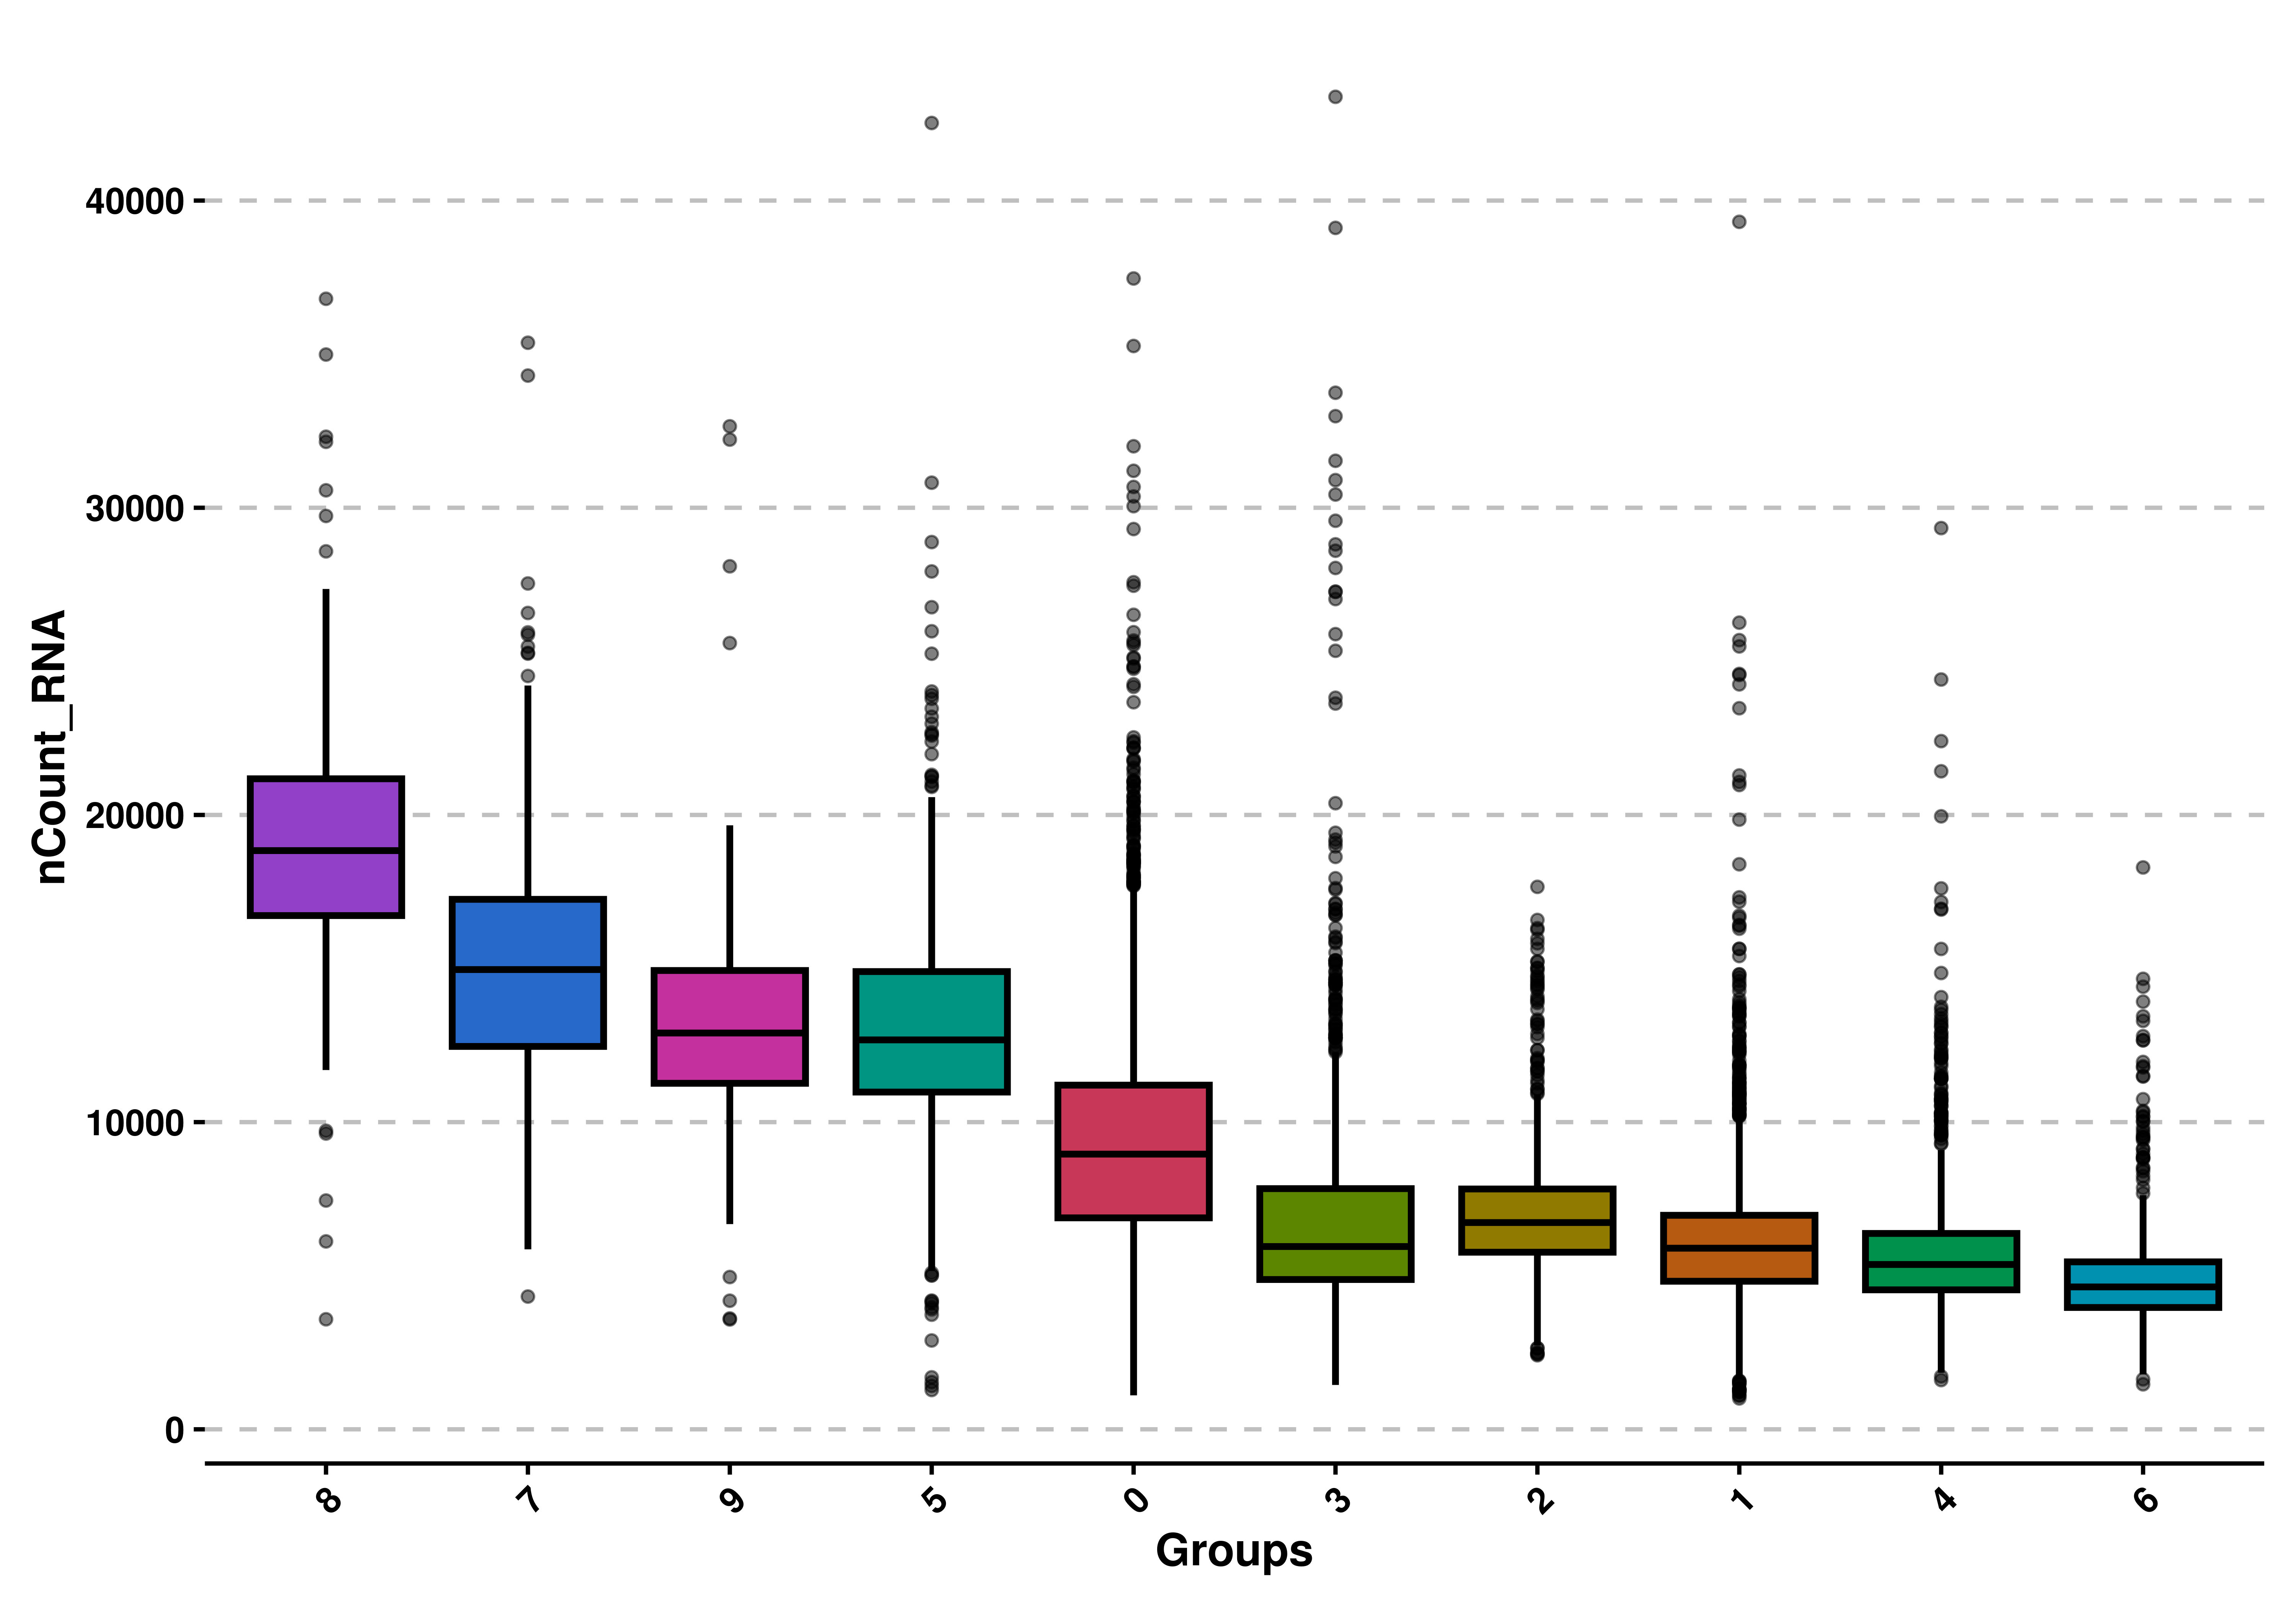
9.5 Split by a second variable
We can further apply a second grouping by using split.by.
# Apply second grouping.
p <- SCpubr::do_BoxPlot(sample = sample,
                        feature = "nCount_RNA",
                        split.by = "custom_group")
p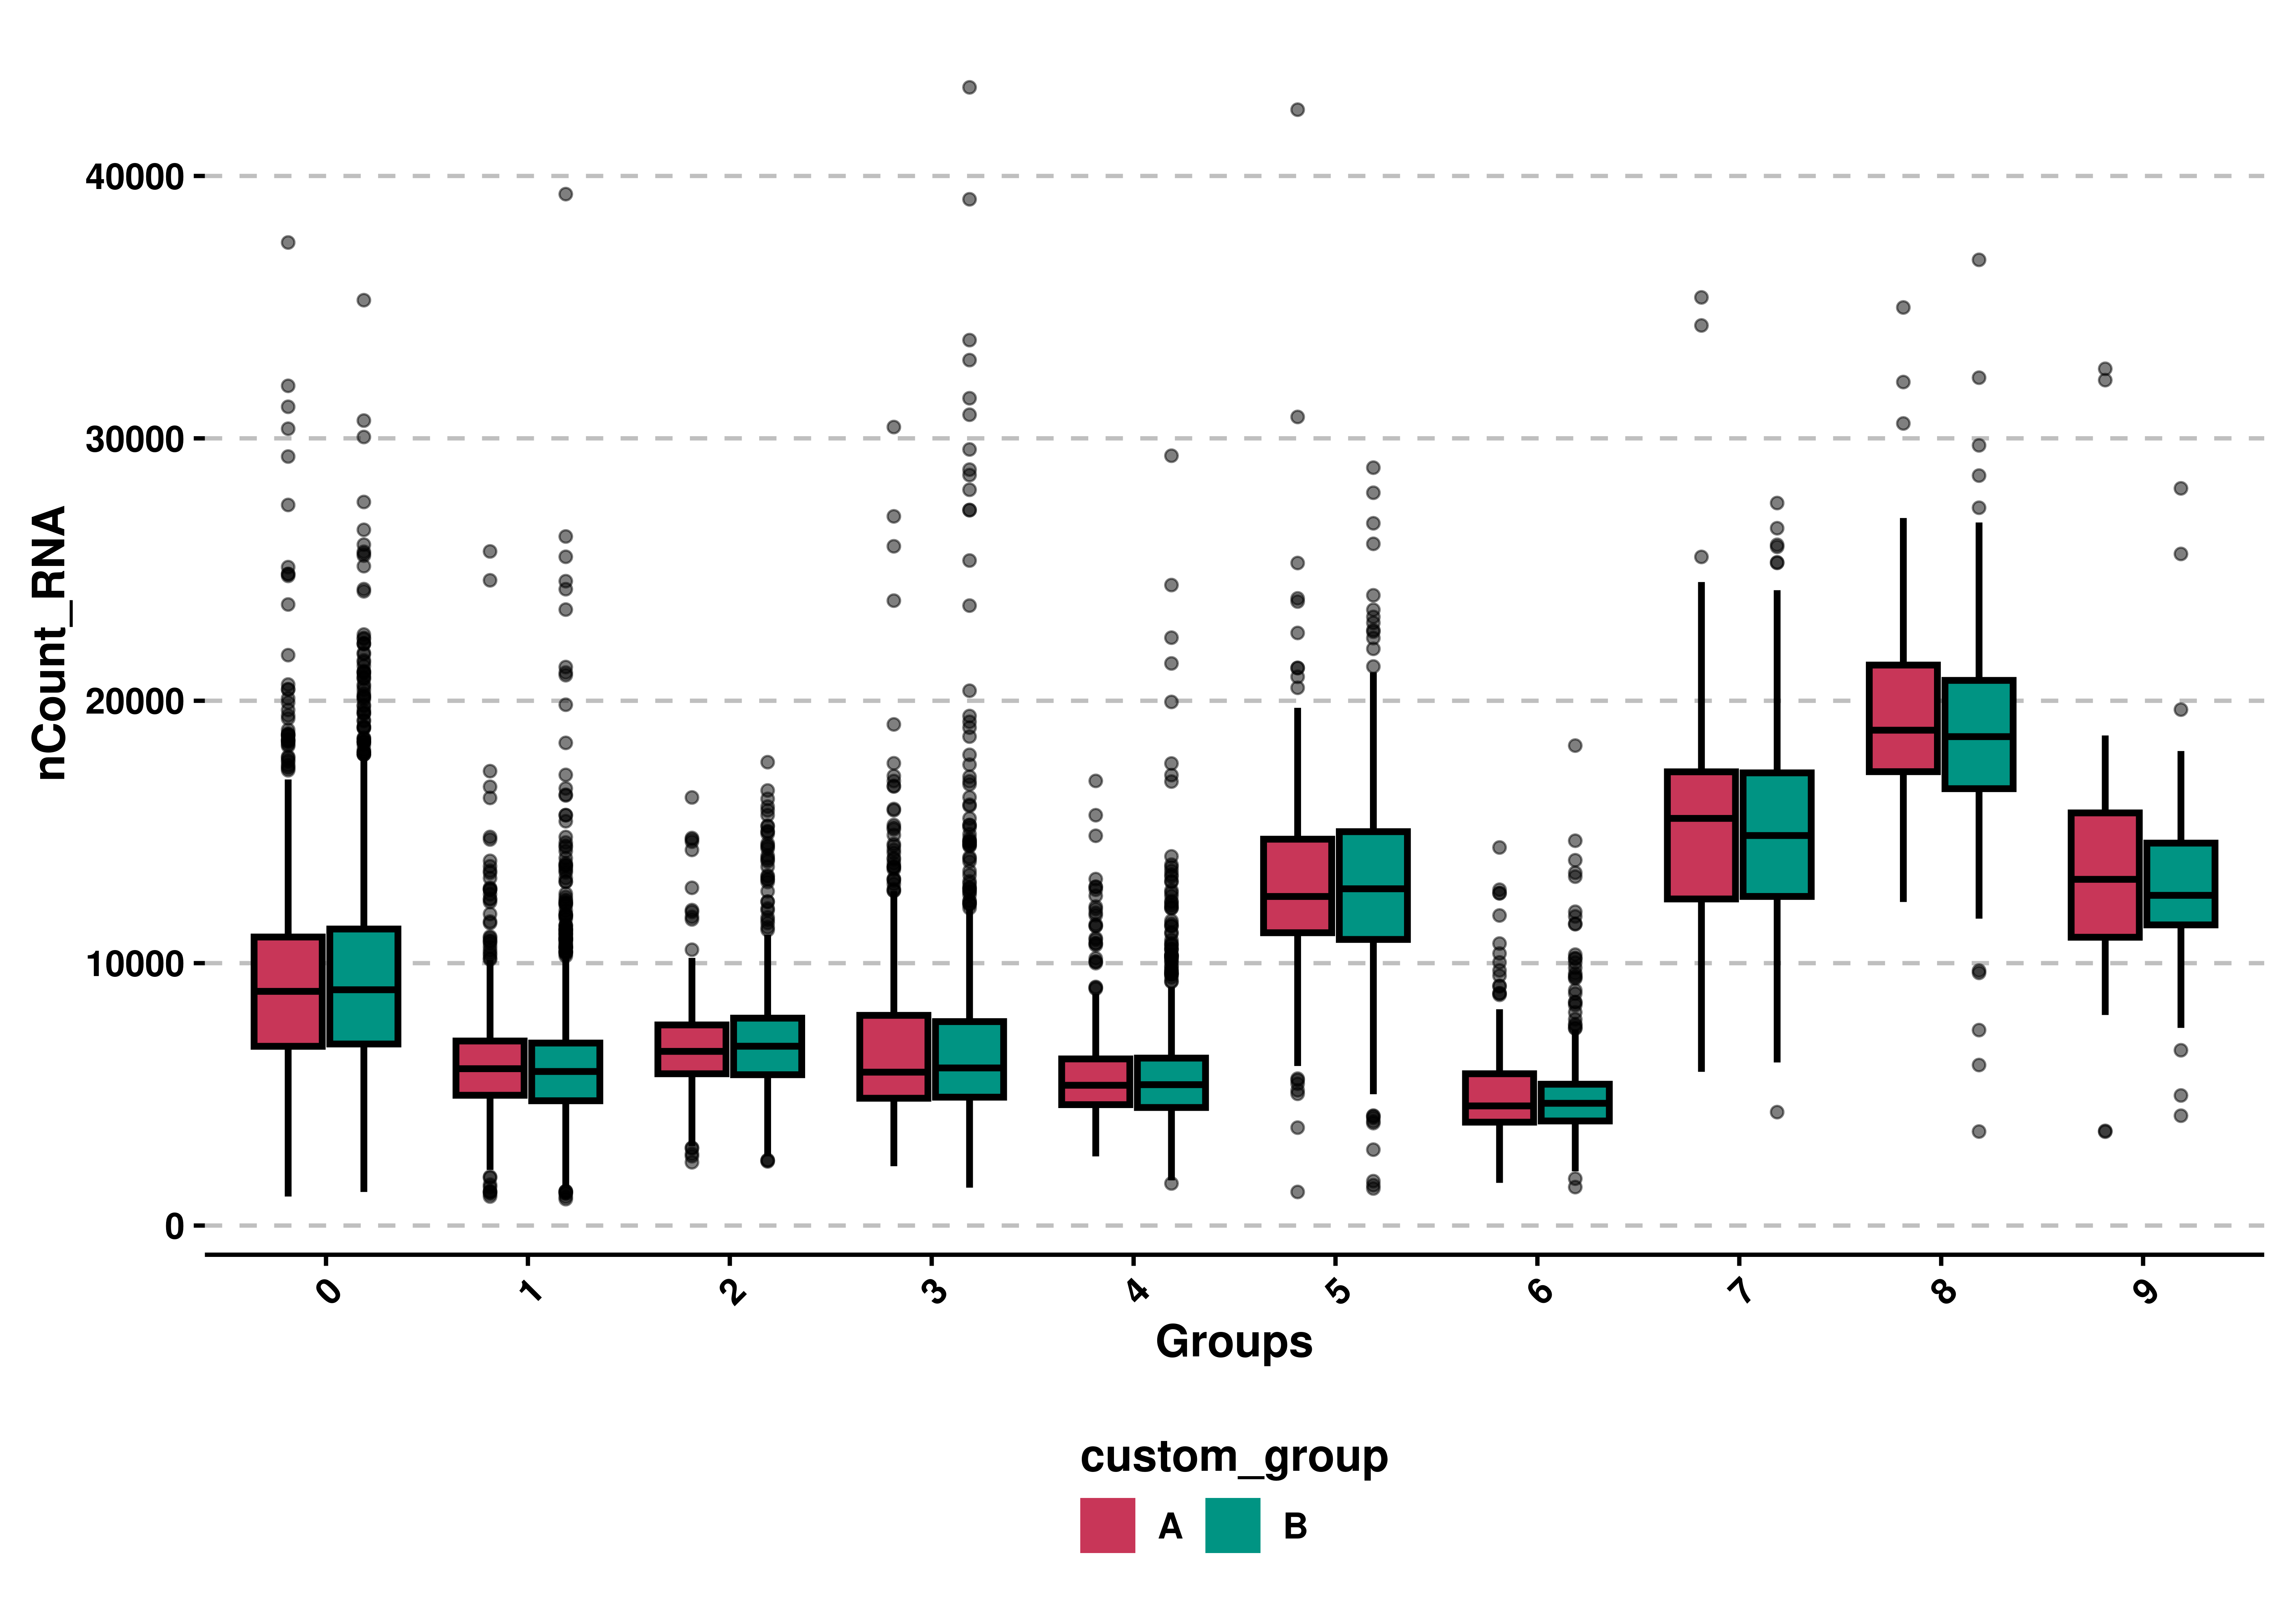
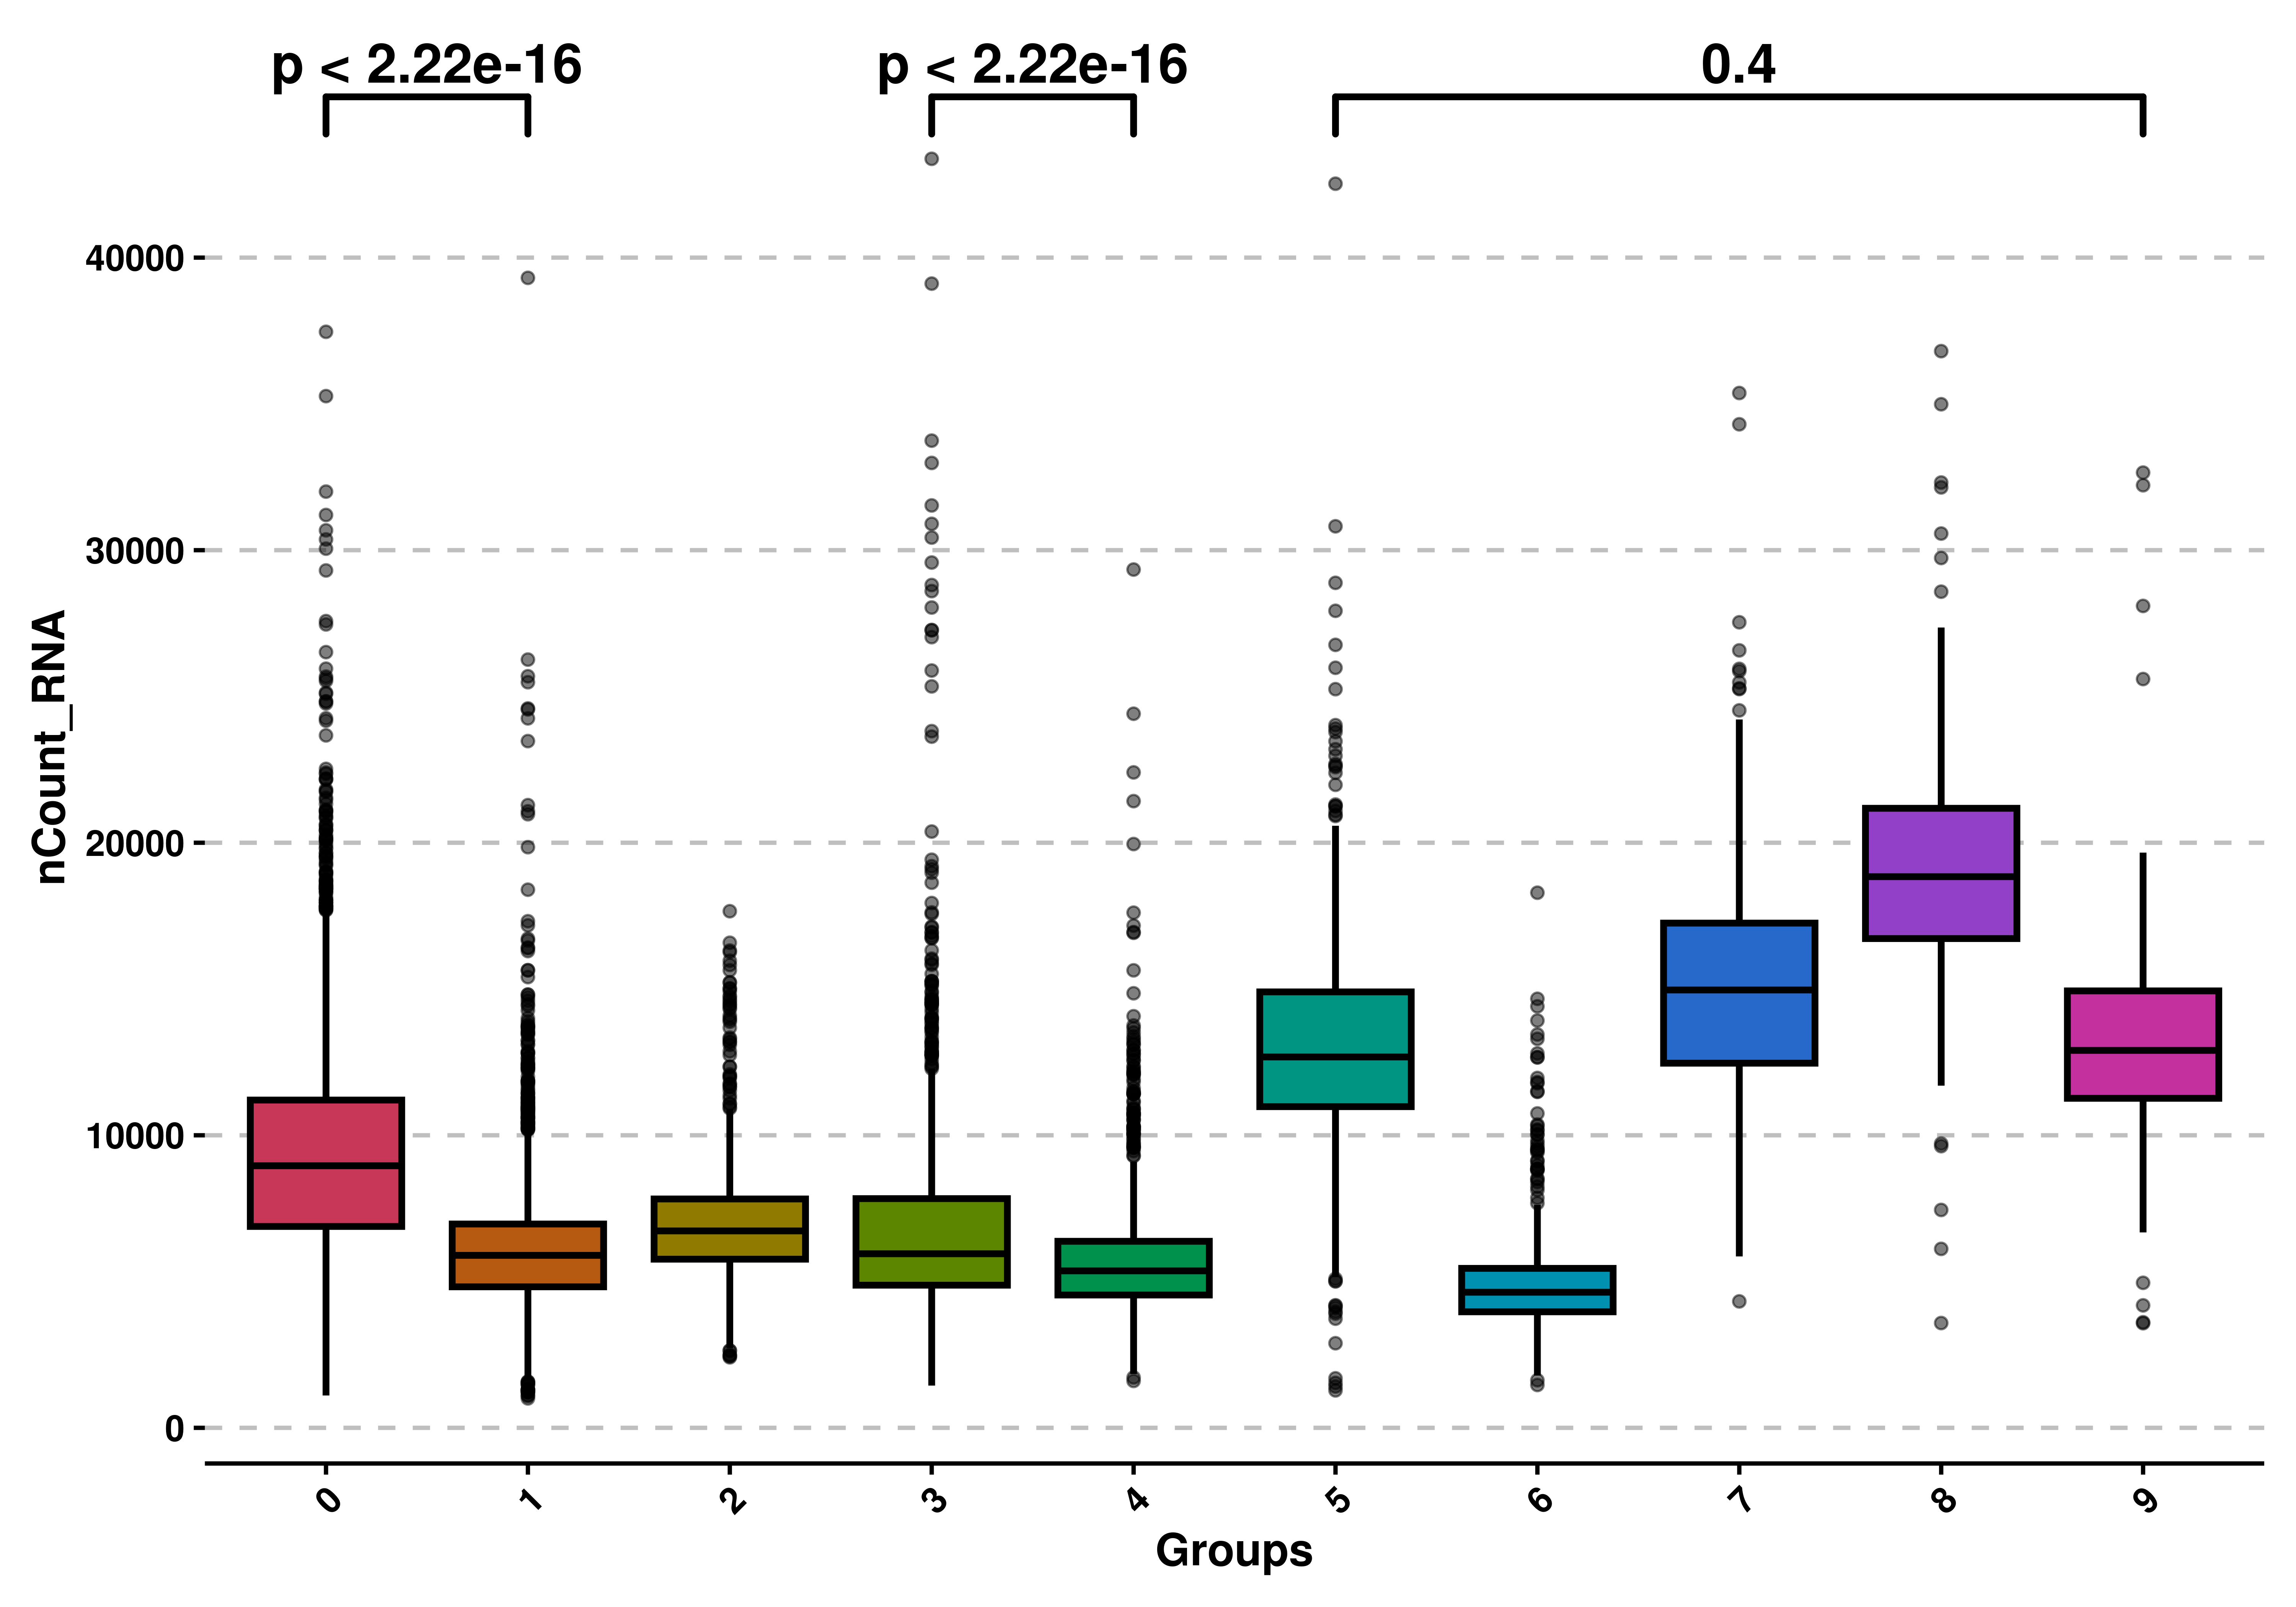
9.6 Apply statistical tests to compare groups
Finally we can apply statistical tests to the groups, if we do not use split.by. We can do that by setting use_test = TRUE and providing the comparison as a list of pairs of items. The test, by default is wilcoxon test, but can be modified using test. The correct use of such tests and their interpretation relies on the user.
# Apply statistical tests.
p <- SCpubr::do_BoxPlot(sample = sample,
                        feature = "nCount_RNA",
                        use_test = TRUE,
                        comparisons = list(c("0", "1"),
                                           c("3", "4"),
                                           c("5", "9")))
p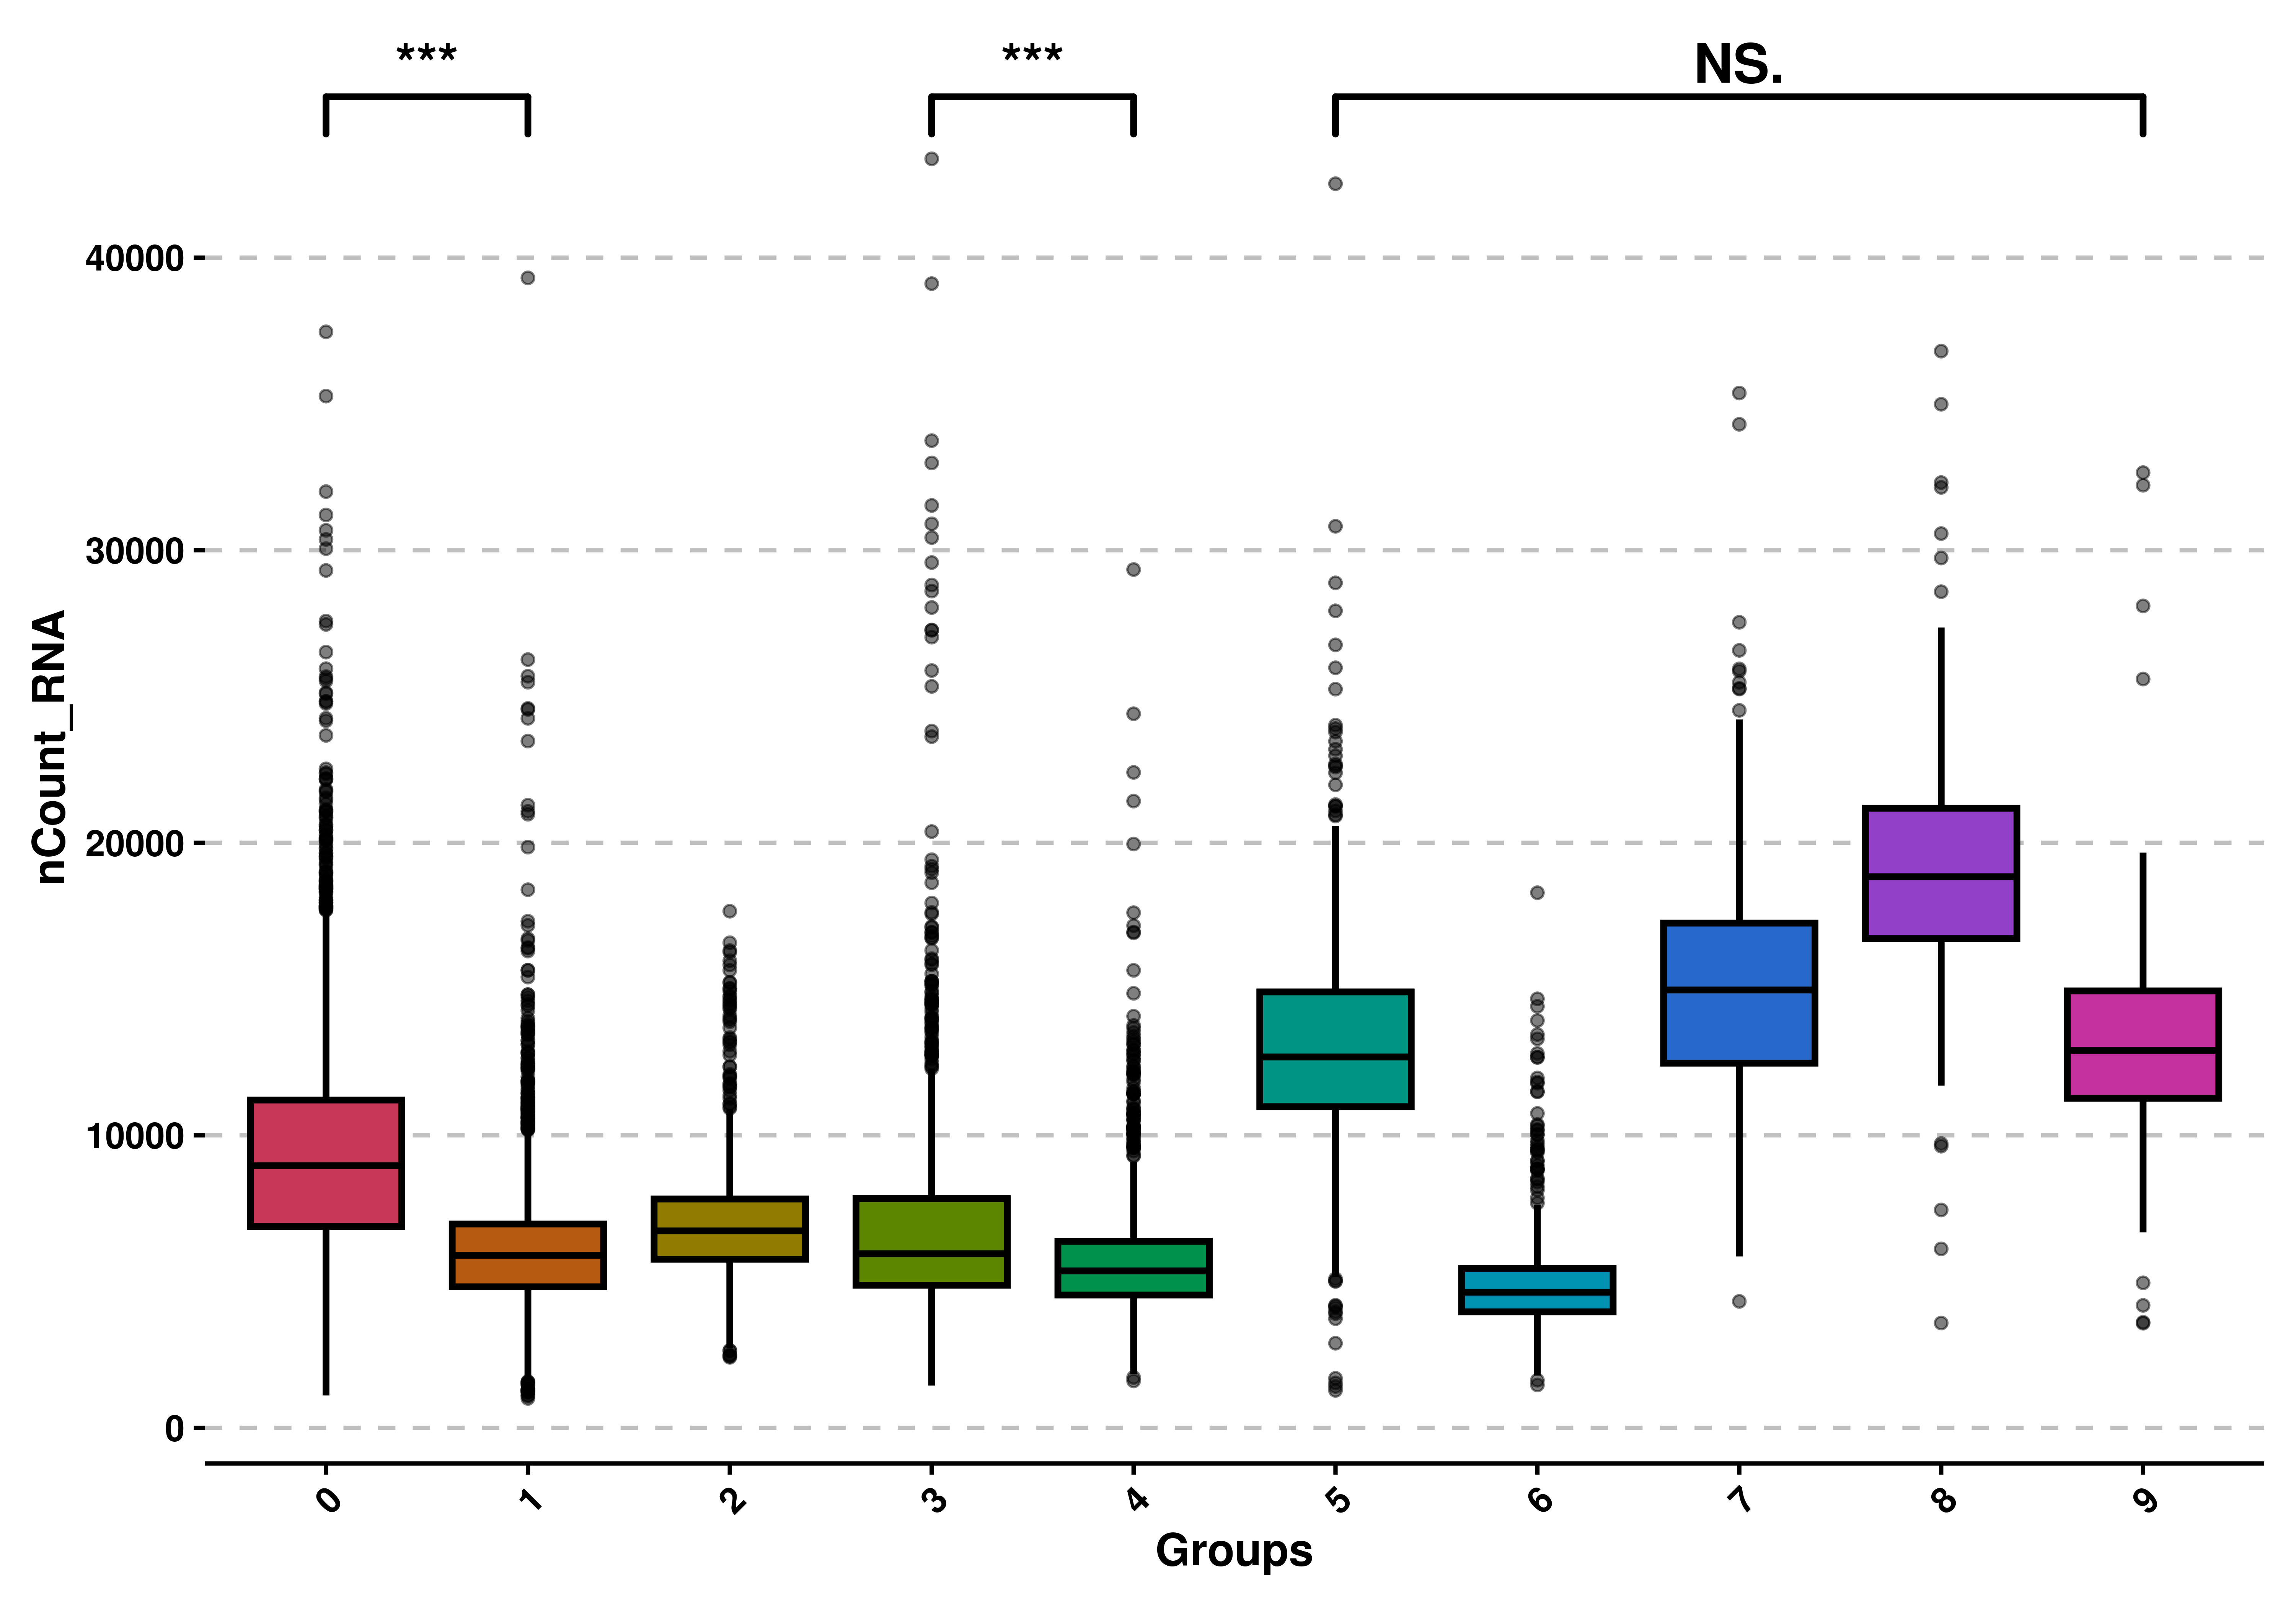
One can display this on symbols, or with numbers with map_signif_level:
# Apply statistical tests and show the p-value.
p <- SCpubr::do_BoxPlot(sample = sample,
                        feature = "nCount_RNA",
                        use_test = TRUE,
                        comparisons = list(c("0", "1"),
                                           c("3", "4"),
                                           c("5", "9")),
                        map_signif_level = FALSE)
p