p <- Seurat::VlnPlot(sample,
                     features = "nCount_RNA")
p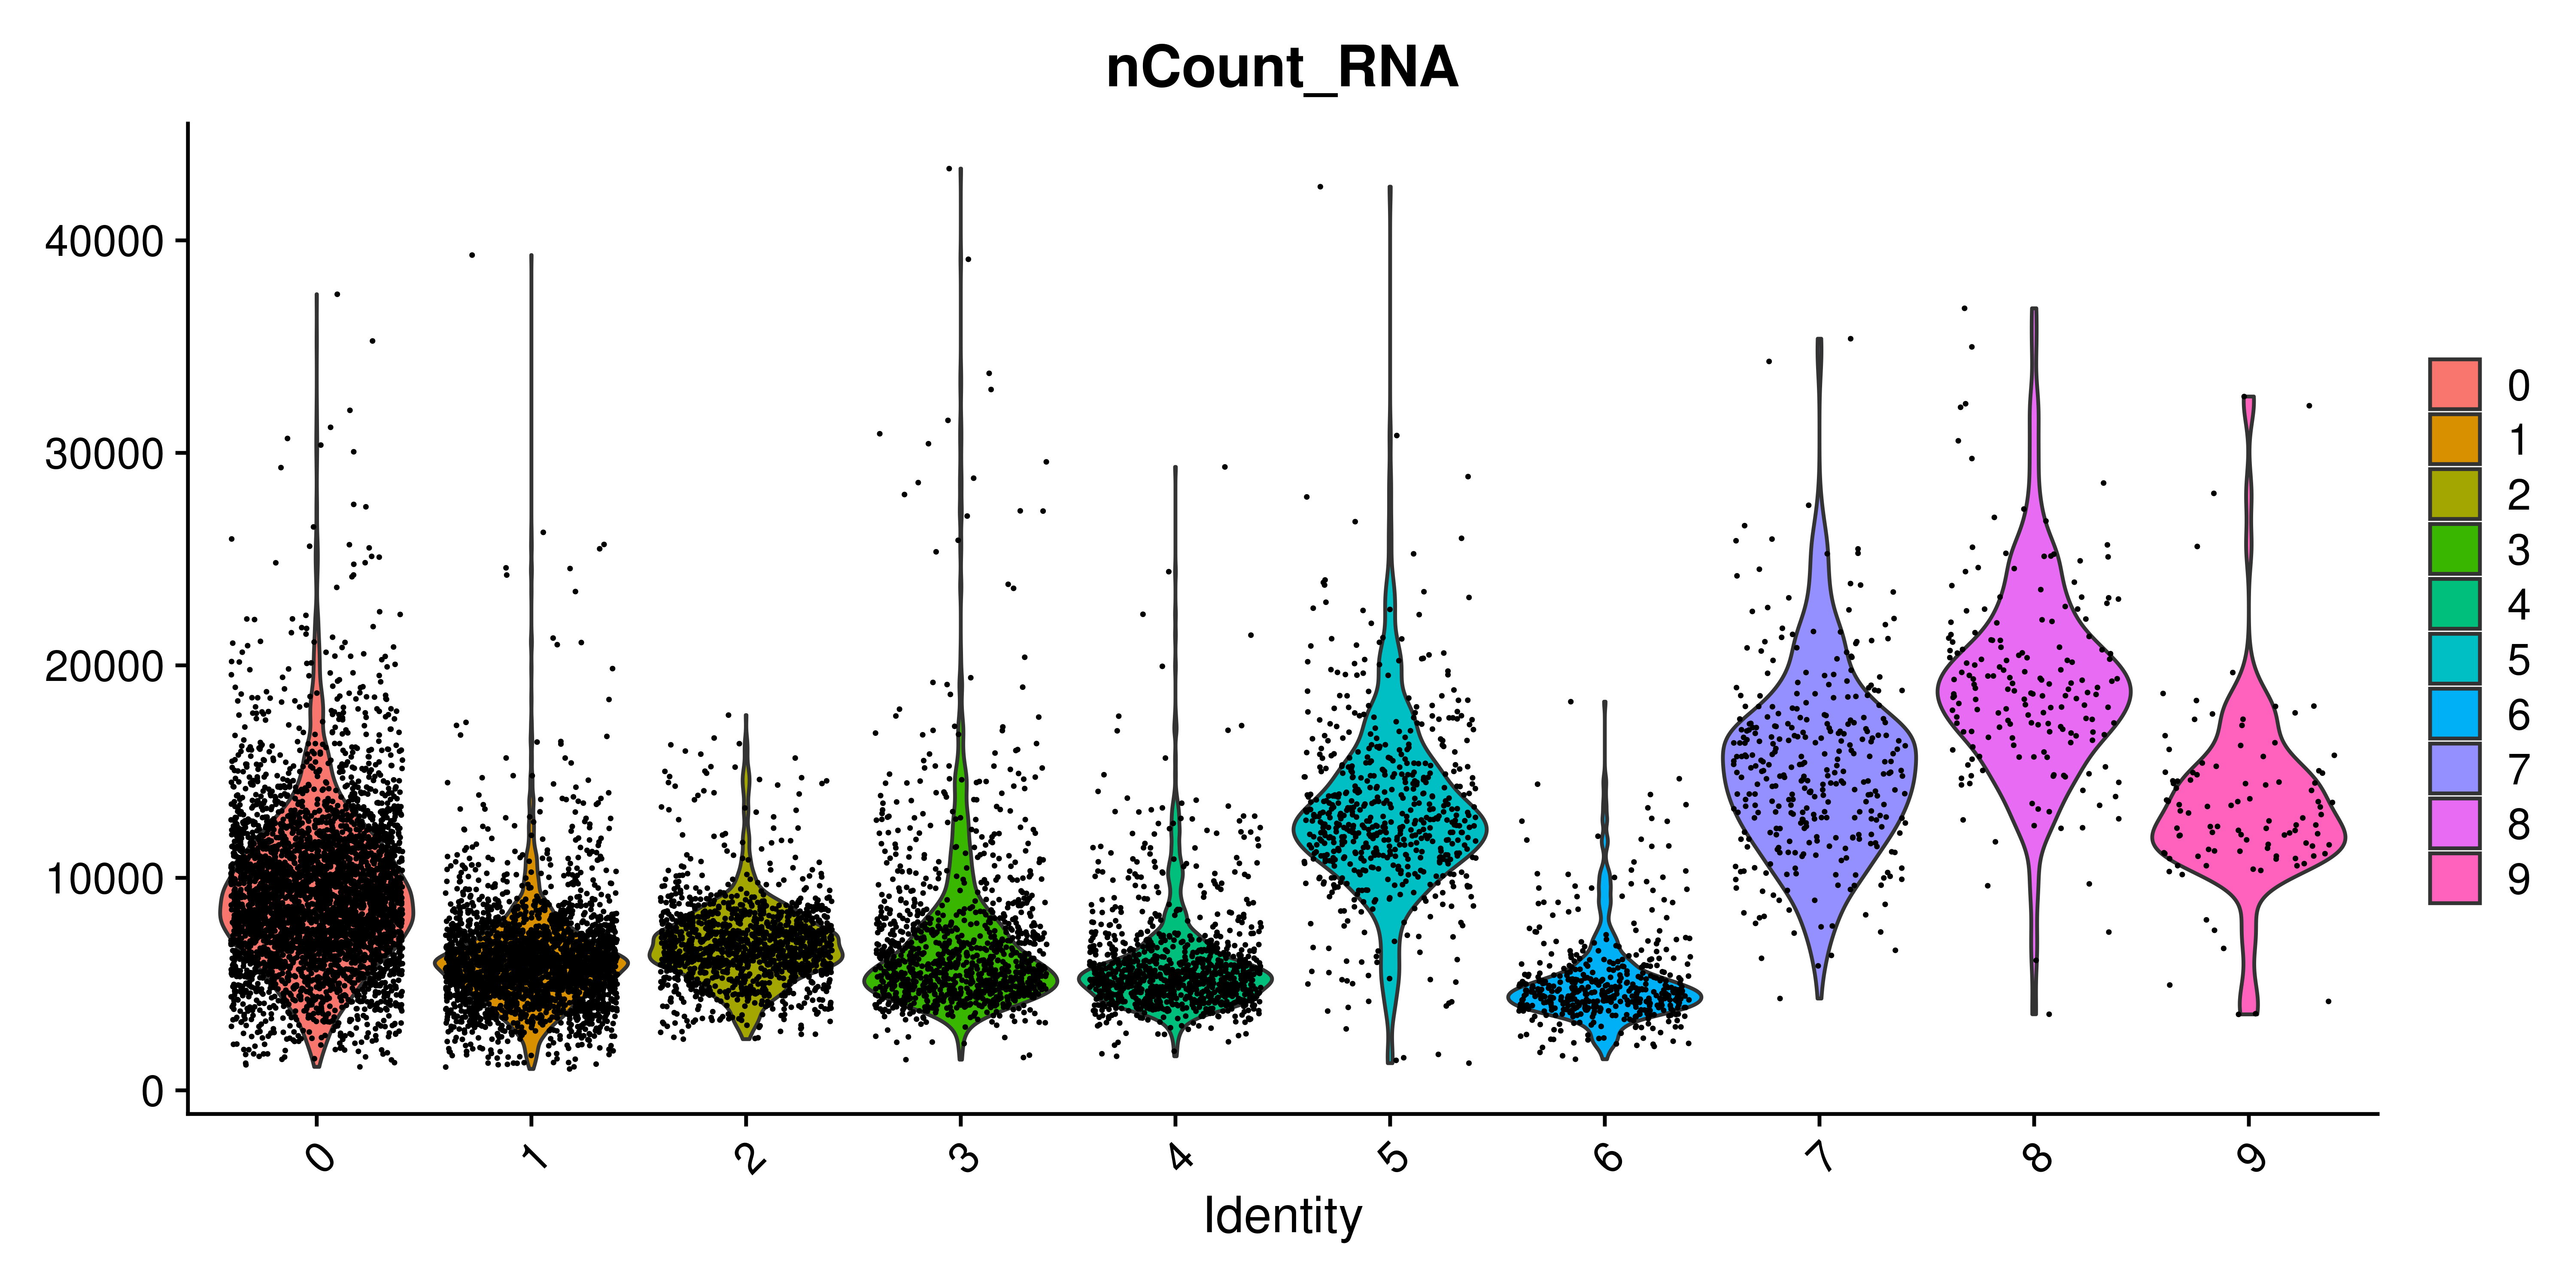
Violin plots require very little description. They are a depiction of the distribution of a variable. It makes it ideal in order to show differential enrichment patterns alongside different groups. As such, it is also included in Seurat under Seurat::VlnPlot() function. The very first time a new user encounters this function is likely going to be when querying for different QC parameters, such as the number of UMIs, the number of genes or the percentage of mitochondrial RNA. This is how it looks for the number of UMIs:
p <- Seurat::VlnPlot(sample,
features = "nCount_RNA")
p
The one thing that really stands out here is, indeed, the extra dots that are being plotted alongside the violin plot. Since each dot represent a cell, it quickly becomes the dominant feature of the figure. One can play with the alpha of the dots to reduce their presence:
p <- Seurat::VlnPlot(sample,
                     features = "nCount_RNA")

# "Surgically" add the alpha parameter in the ggplot2 object.
p$layers[[2]]$aes_params$alpha <- 0.05
p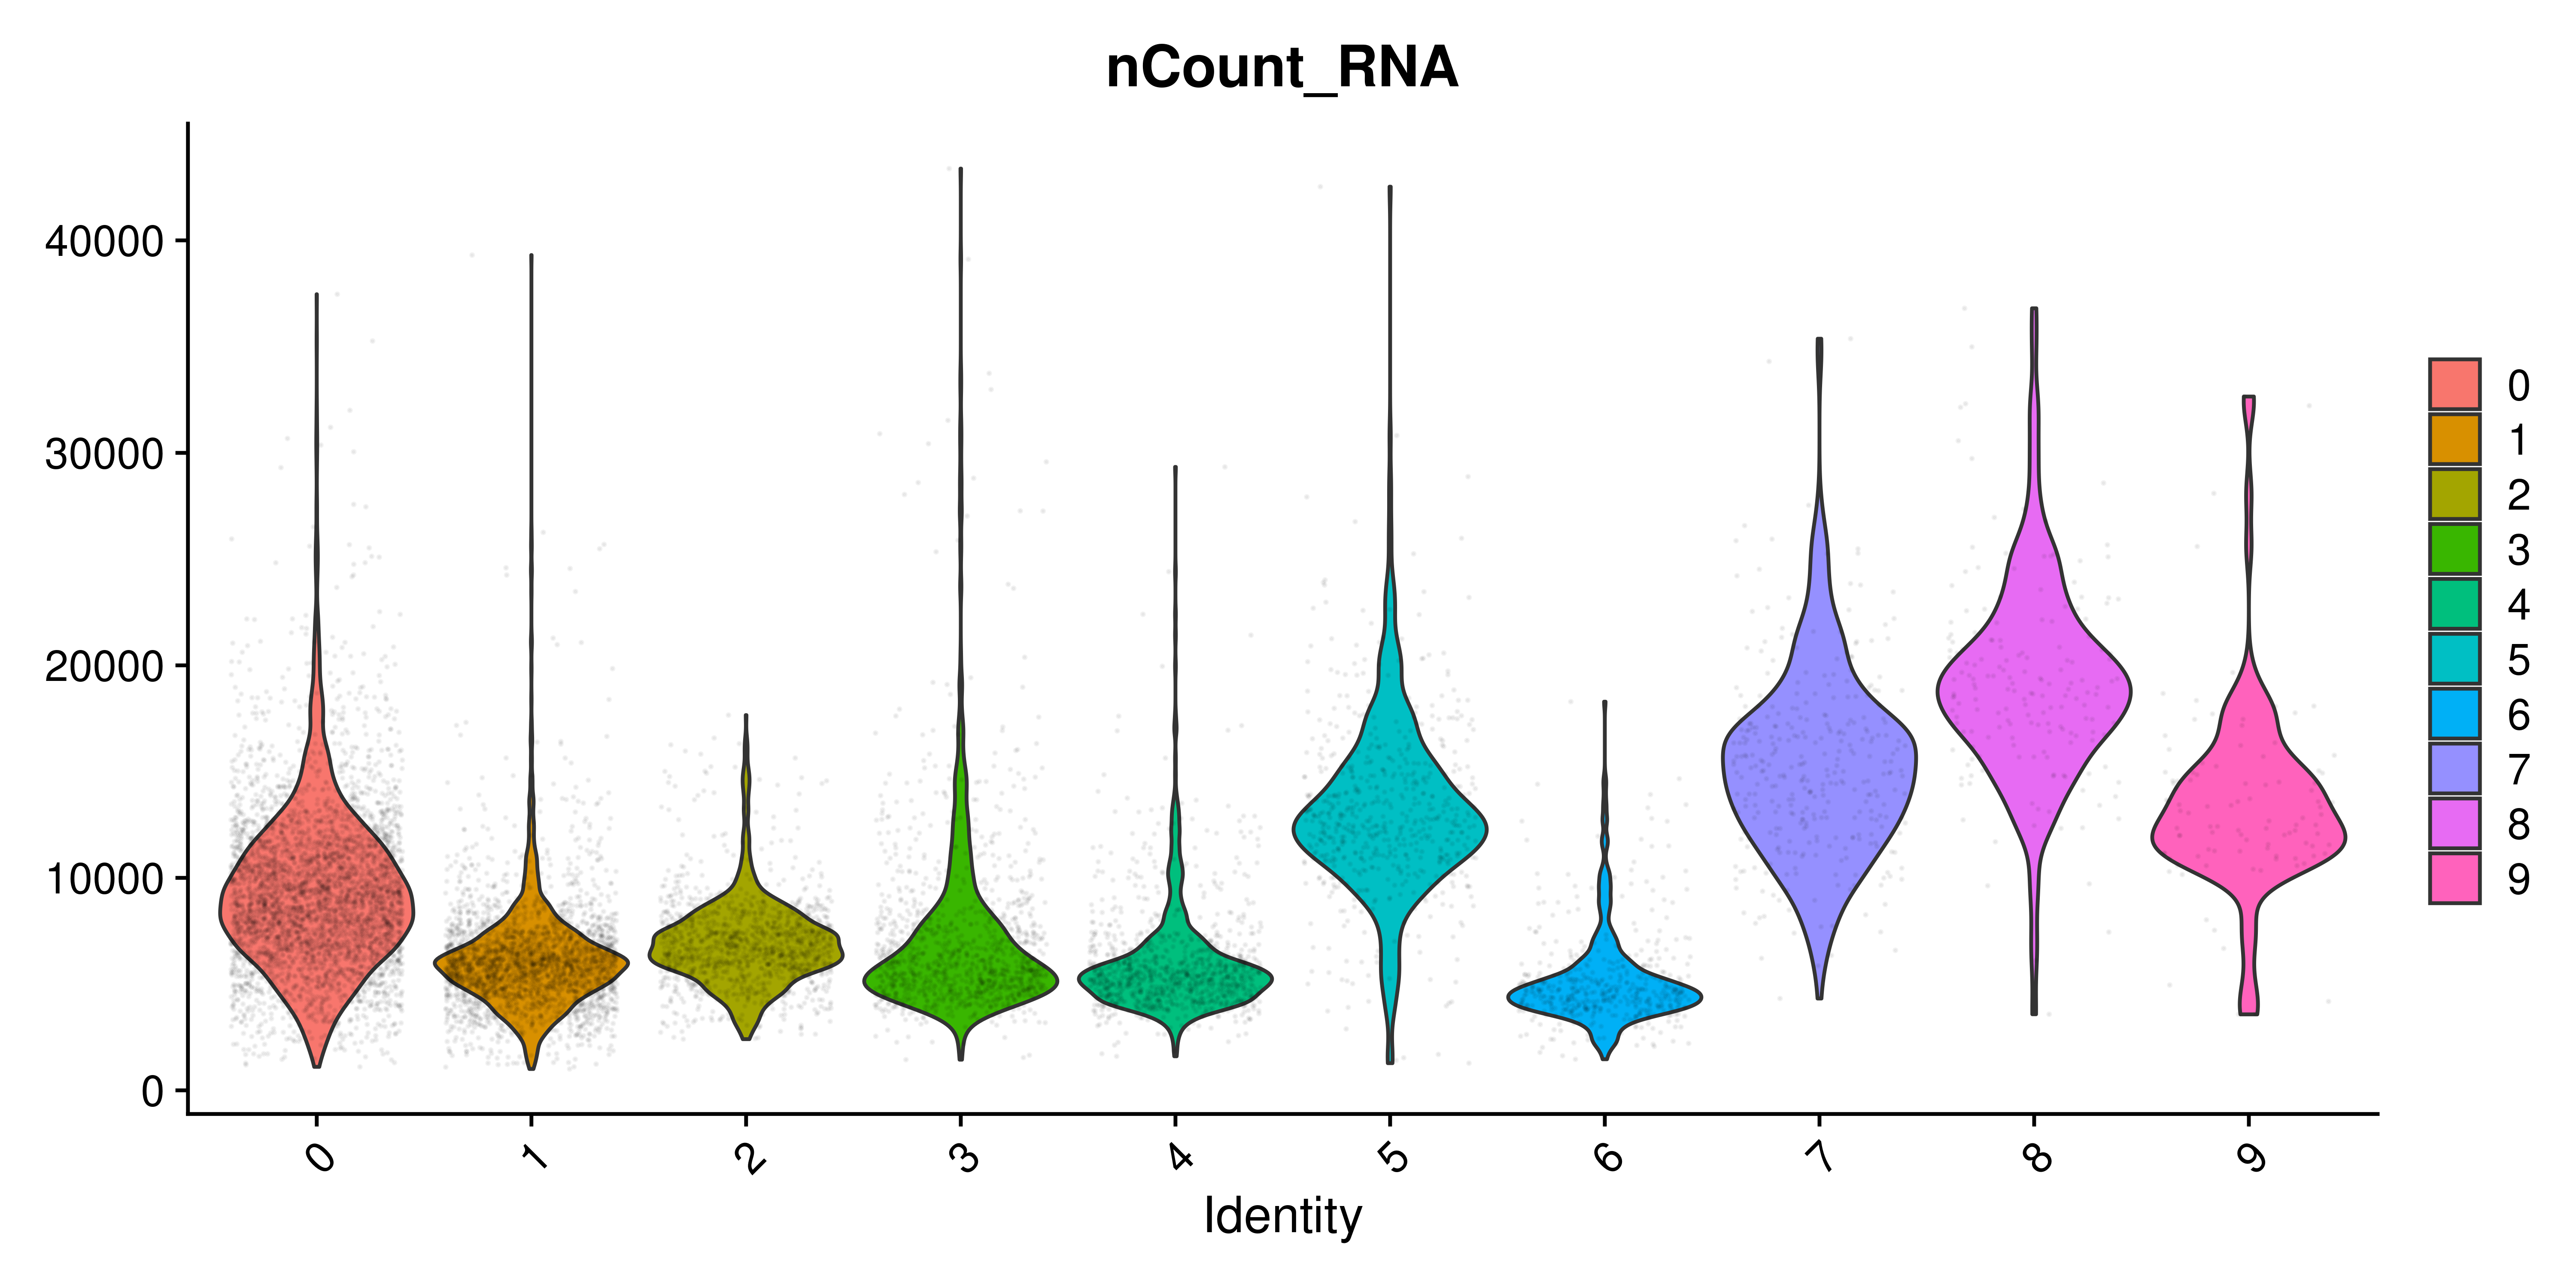
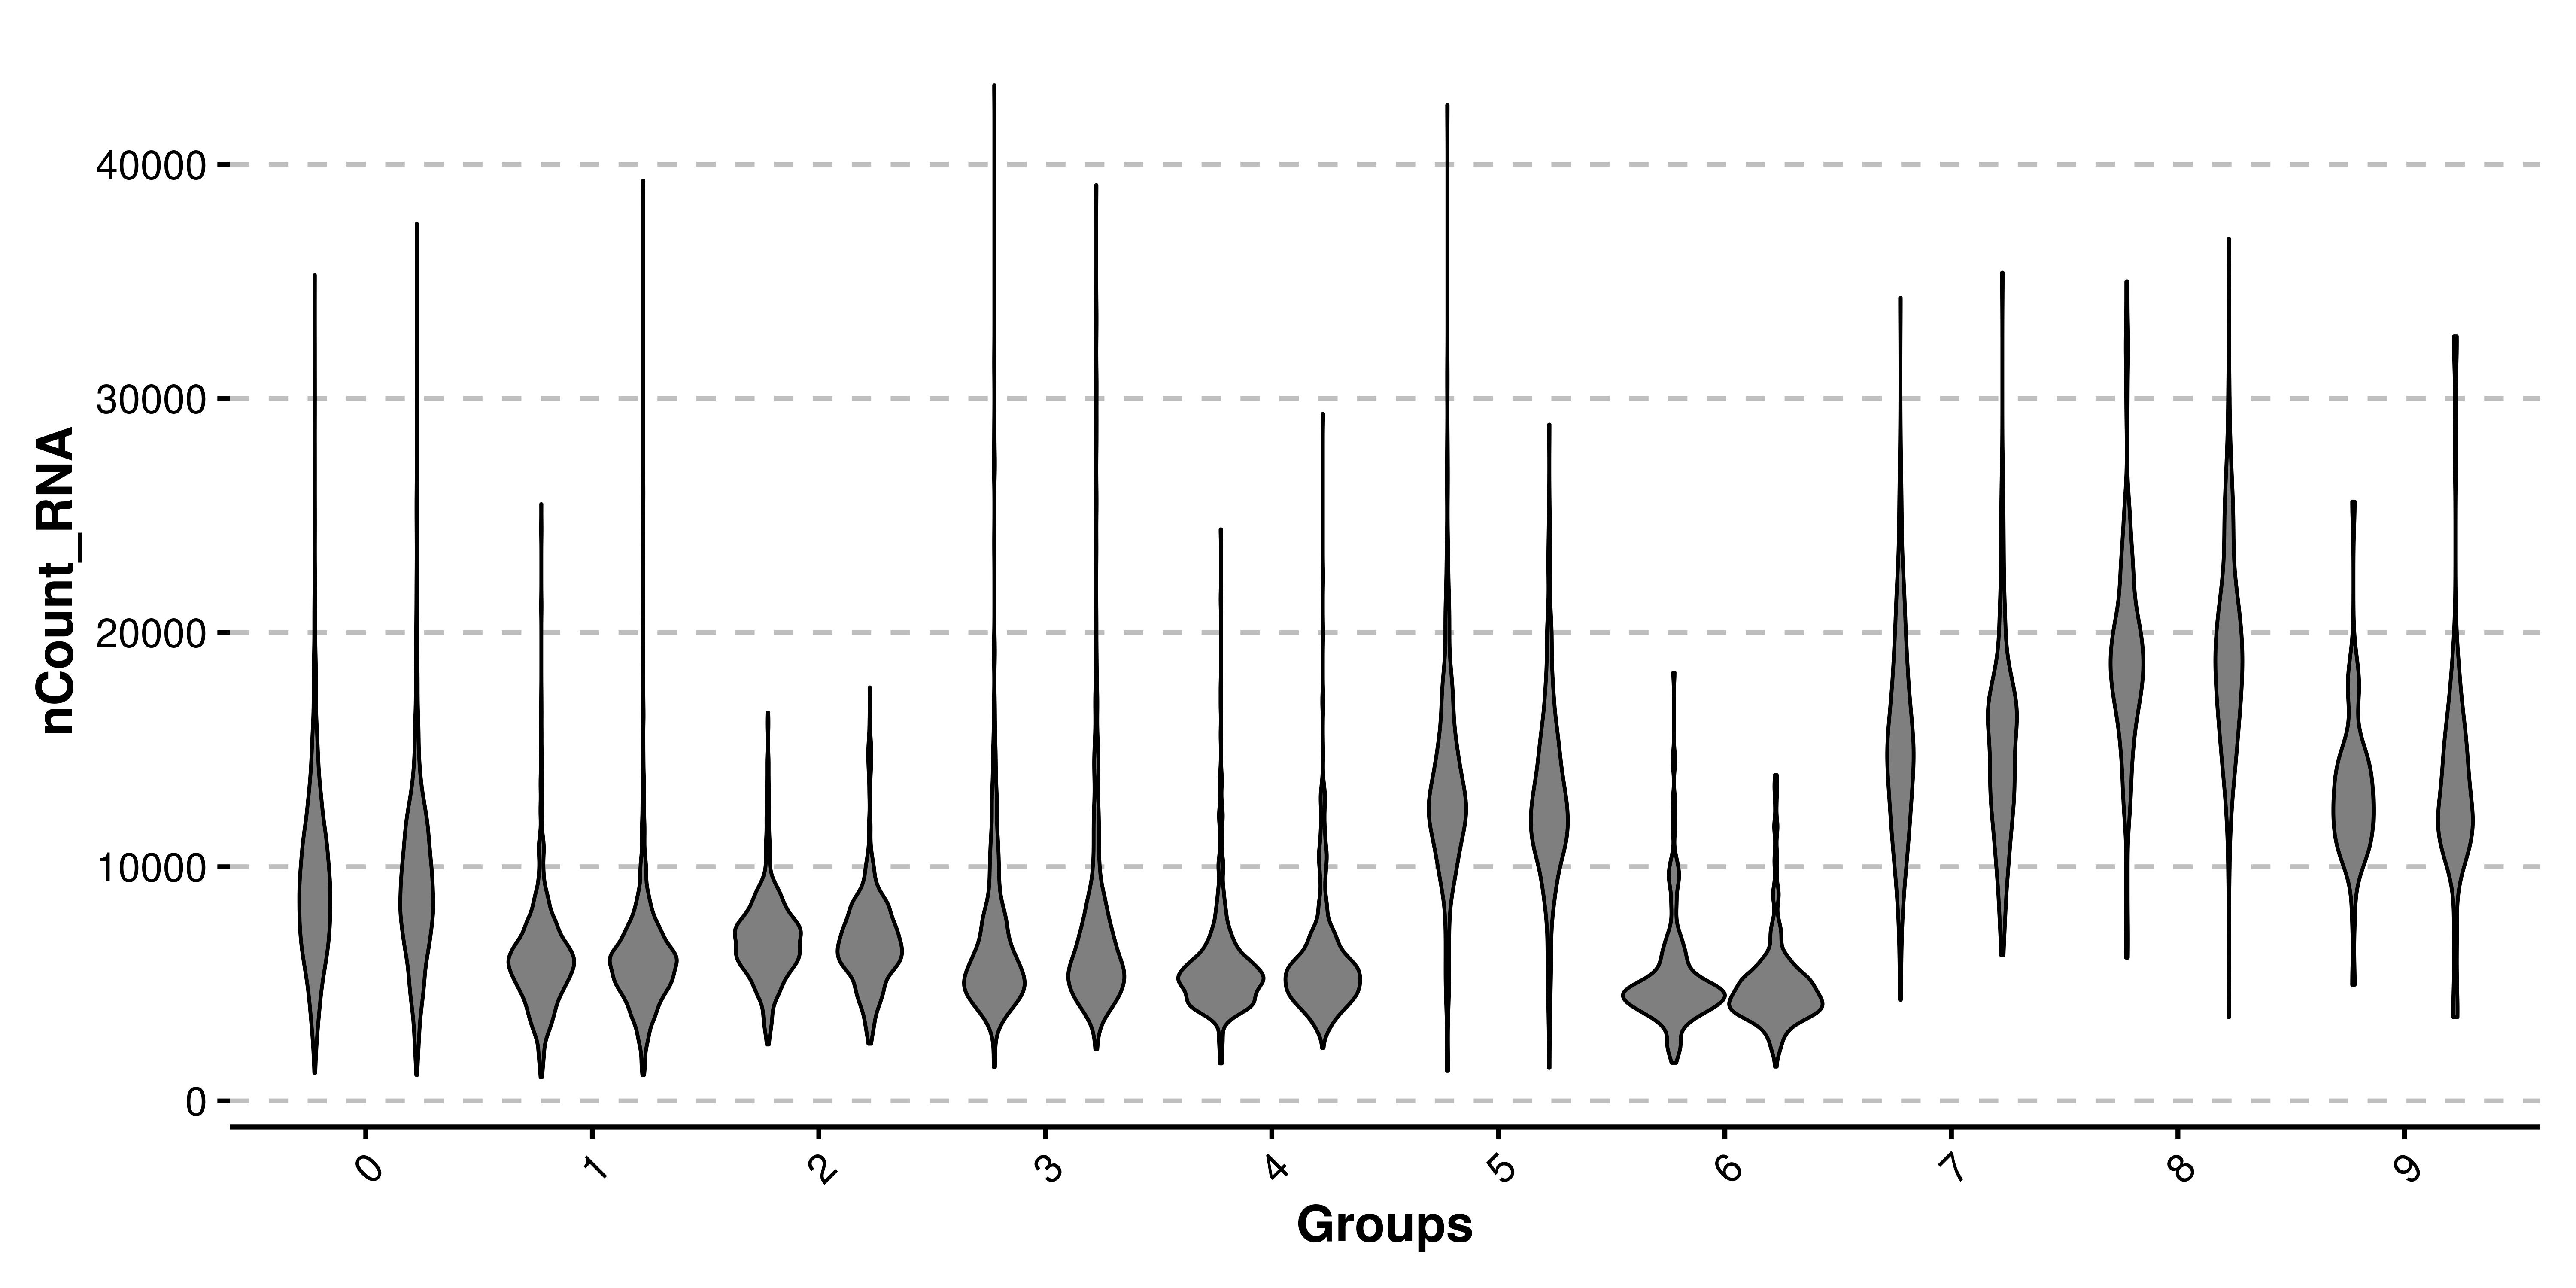
But still, by making the dots almost invisible, we still observe their dominance on the bigger clusters. Therefore, it’s better to remove it. This, together with other modifications are the basis of SCpubr::do_ViolinPlot(). This is how the default plot looks like:
# Basic violin plot.
p <- SCpubr::do_ViolinPlot(sample = sample,
                           features = "nCount_RNA")
p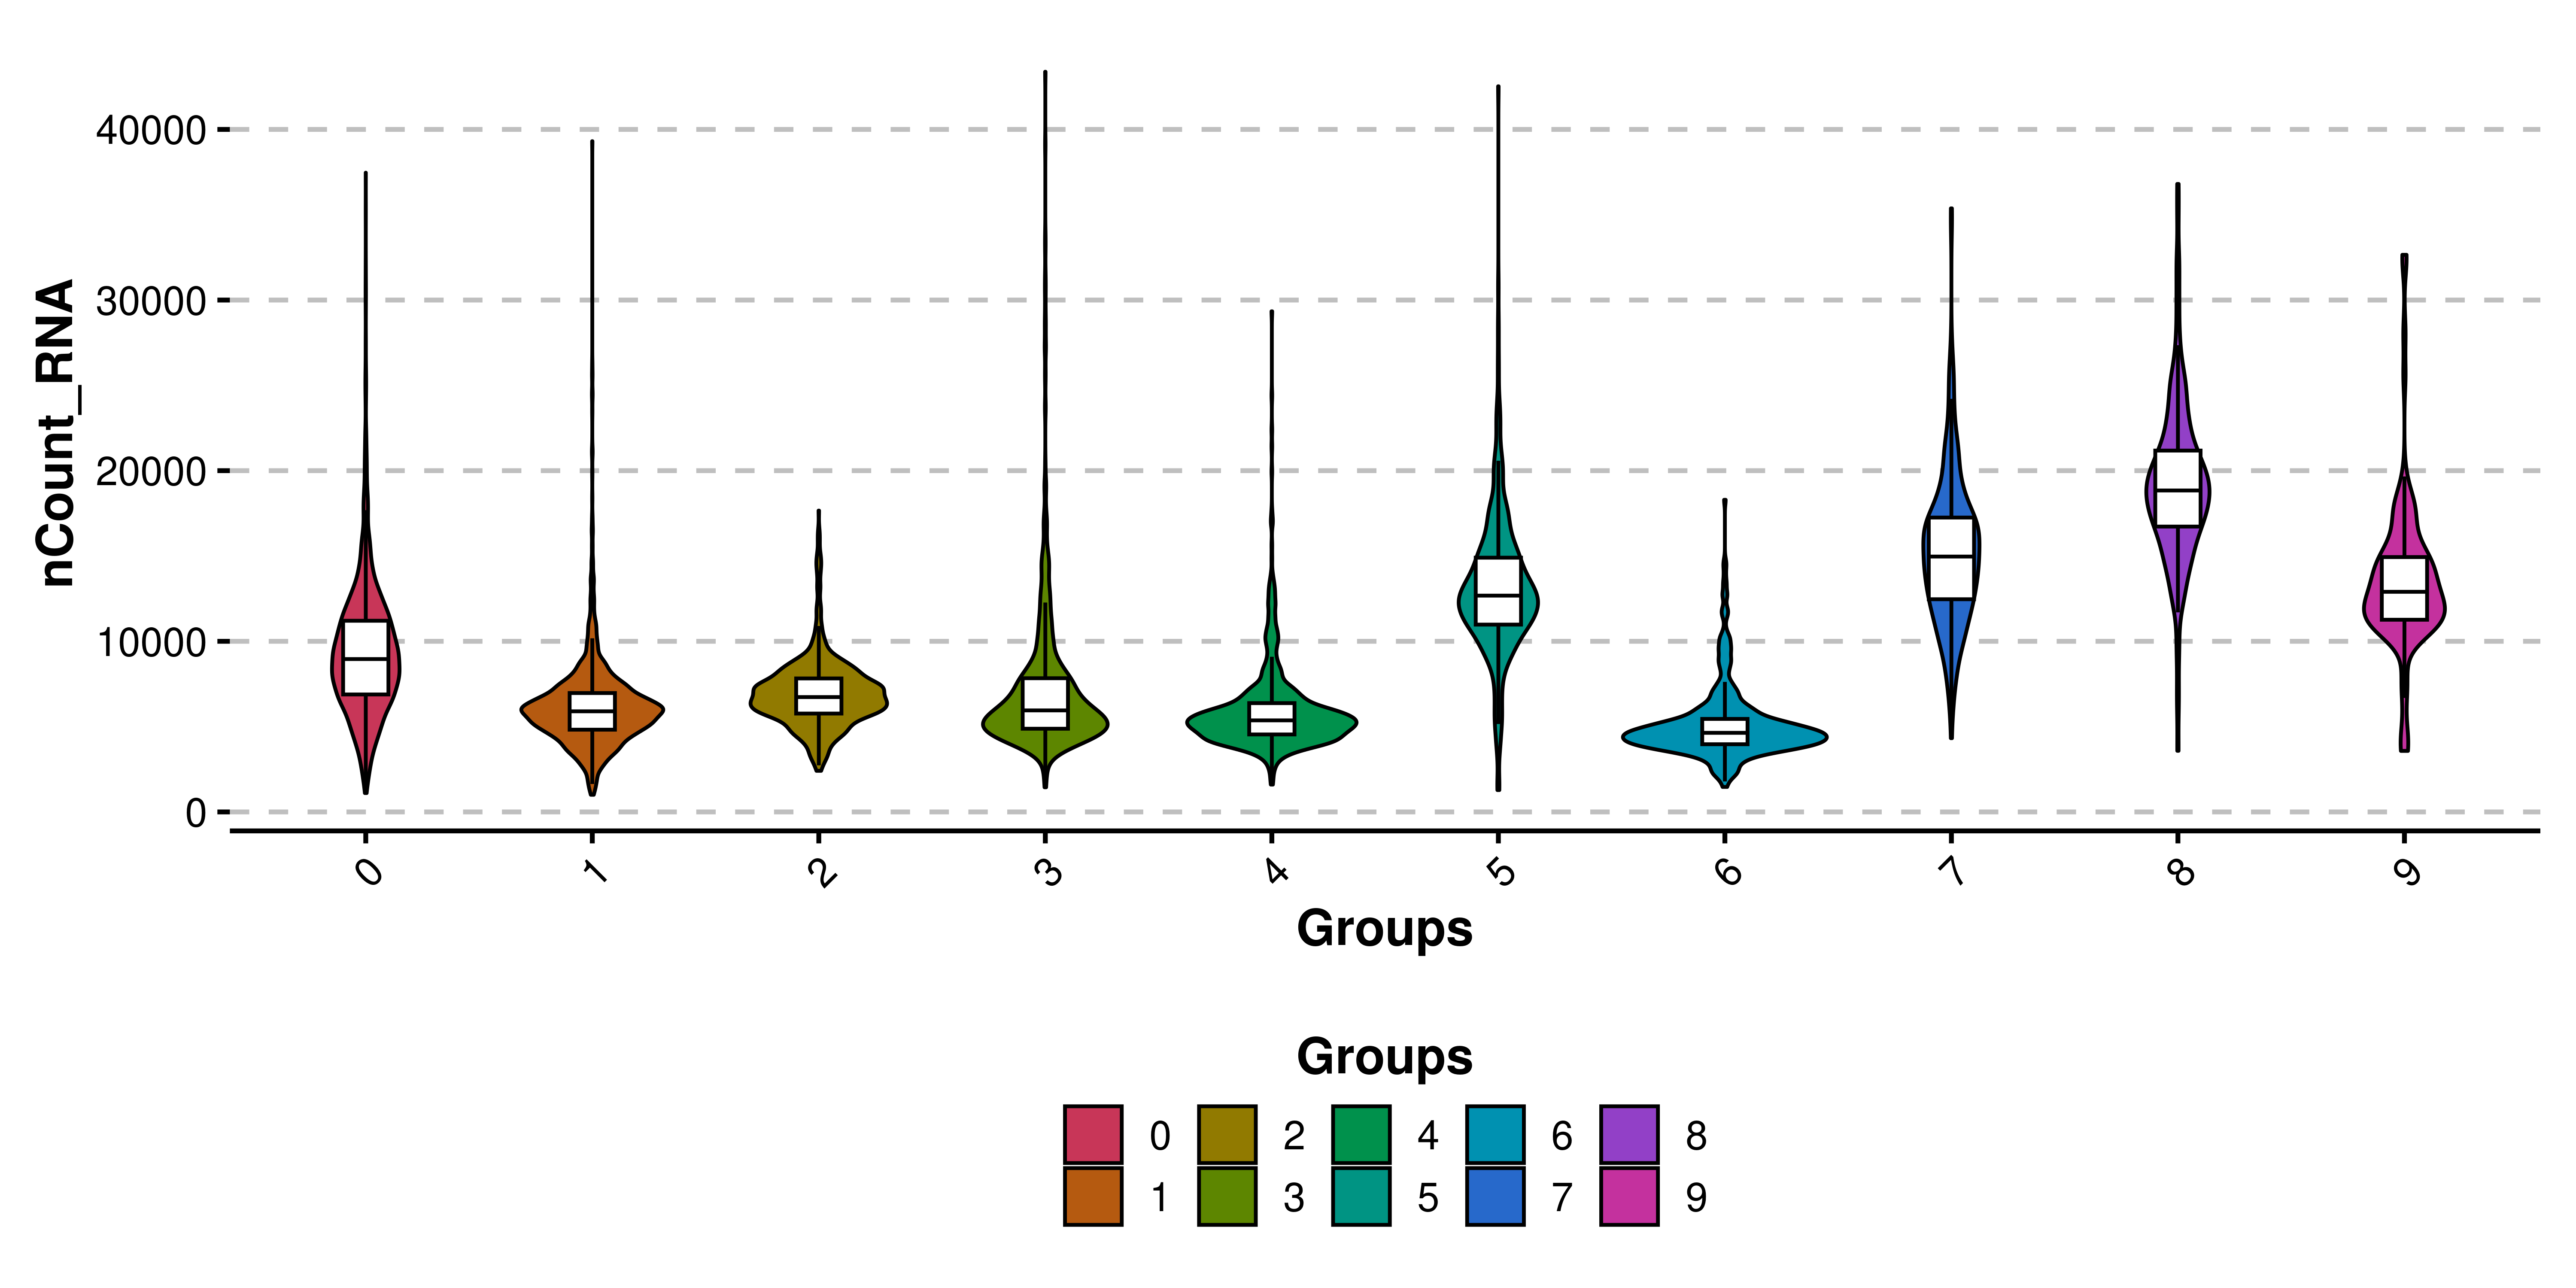
In addition to removing the dots, a boxplot is added to each violin shape, to get a better sense of the quantiles of the distribution. This effect can be removed by using plot_boxplot = FALSE. Also, legend is by default removed, as the groups are being displayed already in the X axis.
# Remove the box plots.
p <- SCpubr::do_ViolinPlot(sample = sample,
                           features = "nCount_RNA",
                           plot_boxplot = FALSE)
p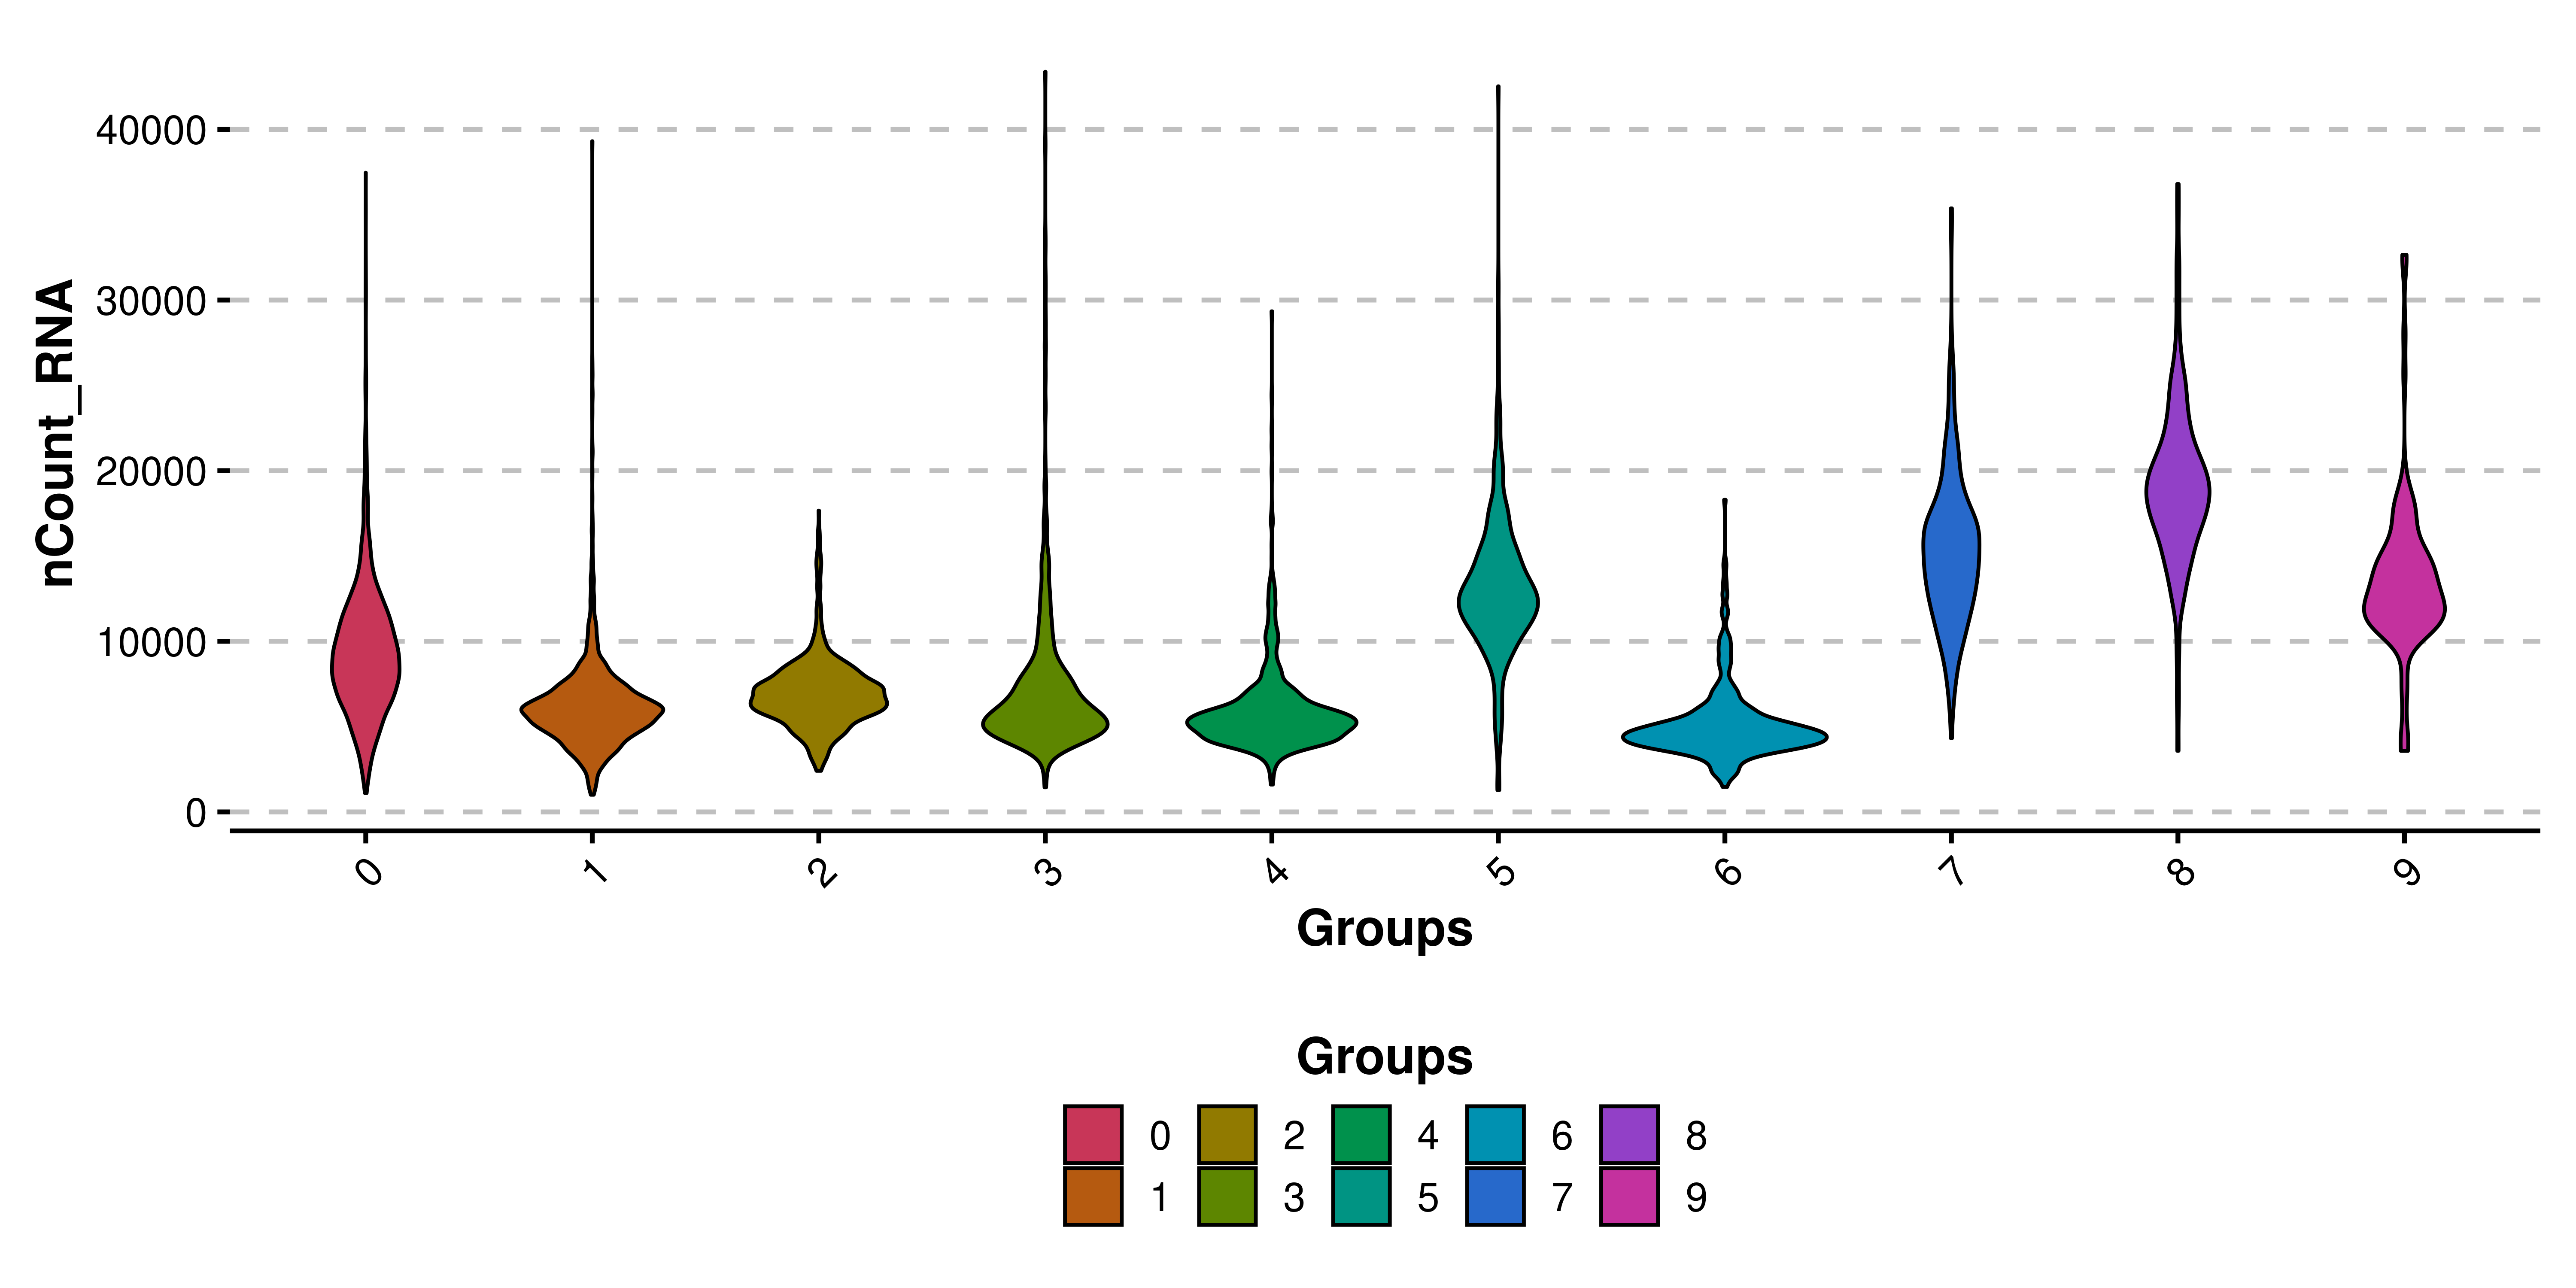
For QC analyses, users might want to also add some other features such as a line indicating where to put the cutoff. This can be achieved by using y_cut parameter. Currently, only one value per plot for y_cut can be used.
# Add horizontal lines.
p <- SCpubr::do_ViolinPlot(sample = sample,
                           features = "nCount_RNA",
                           y_cut = 25000)
p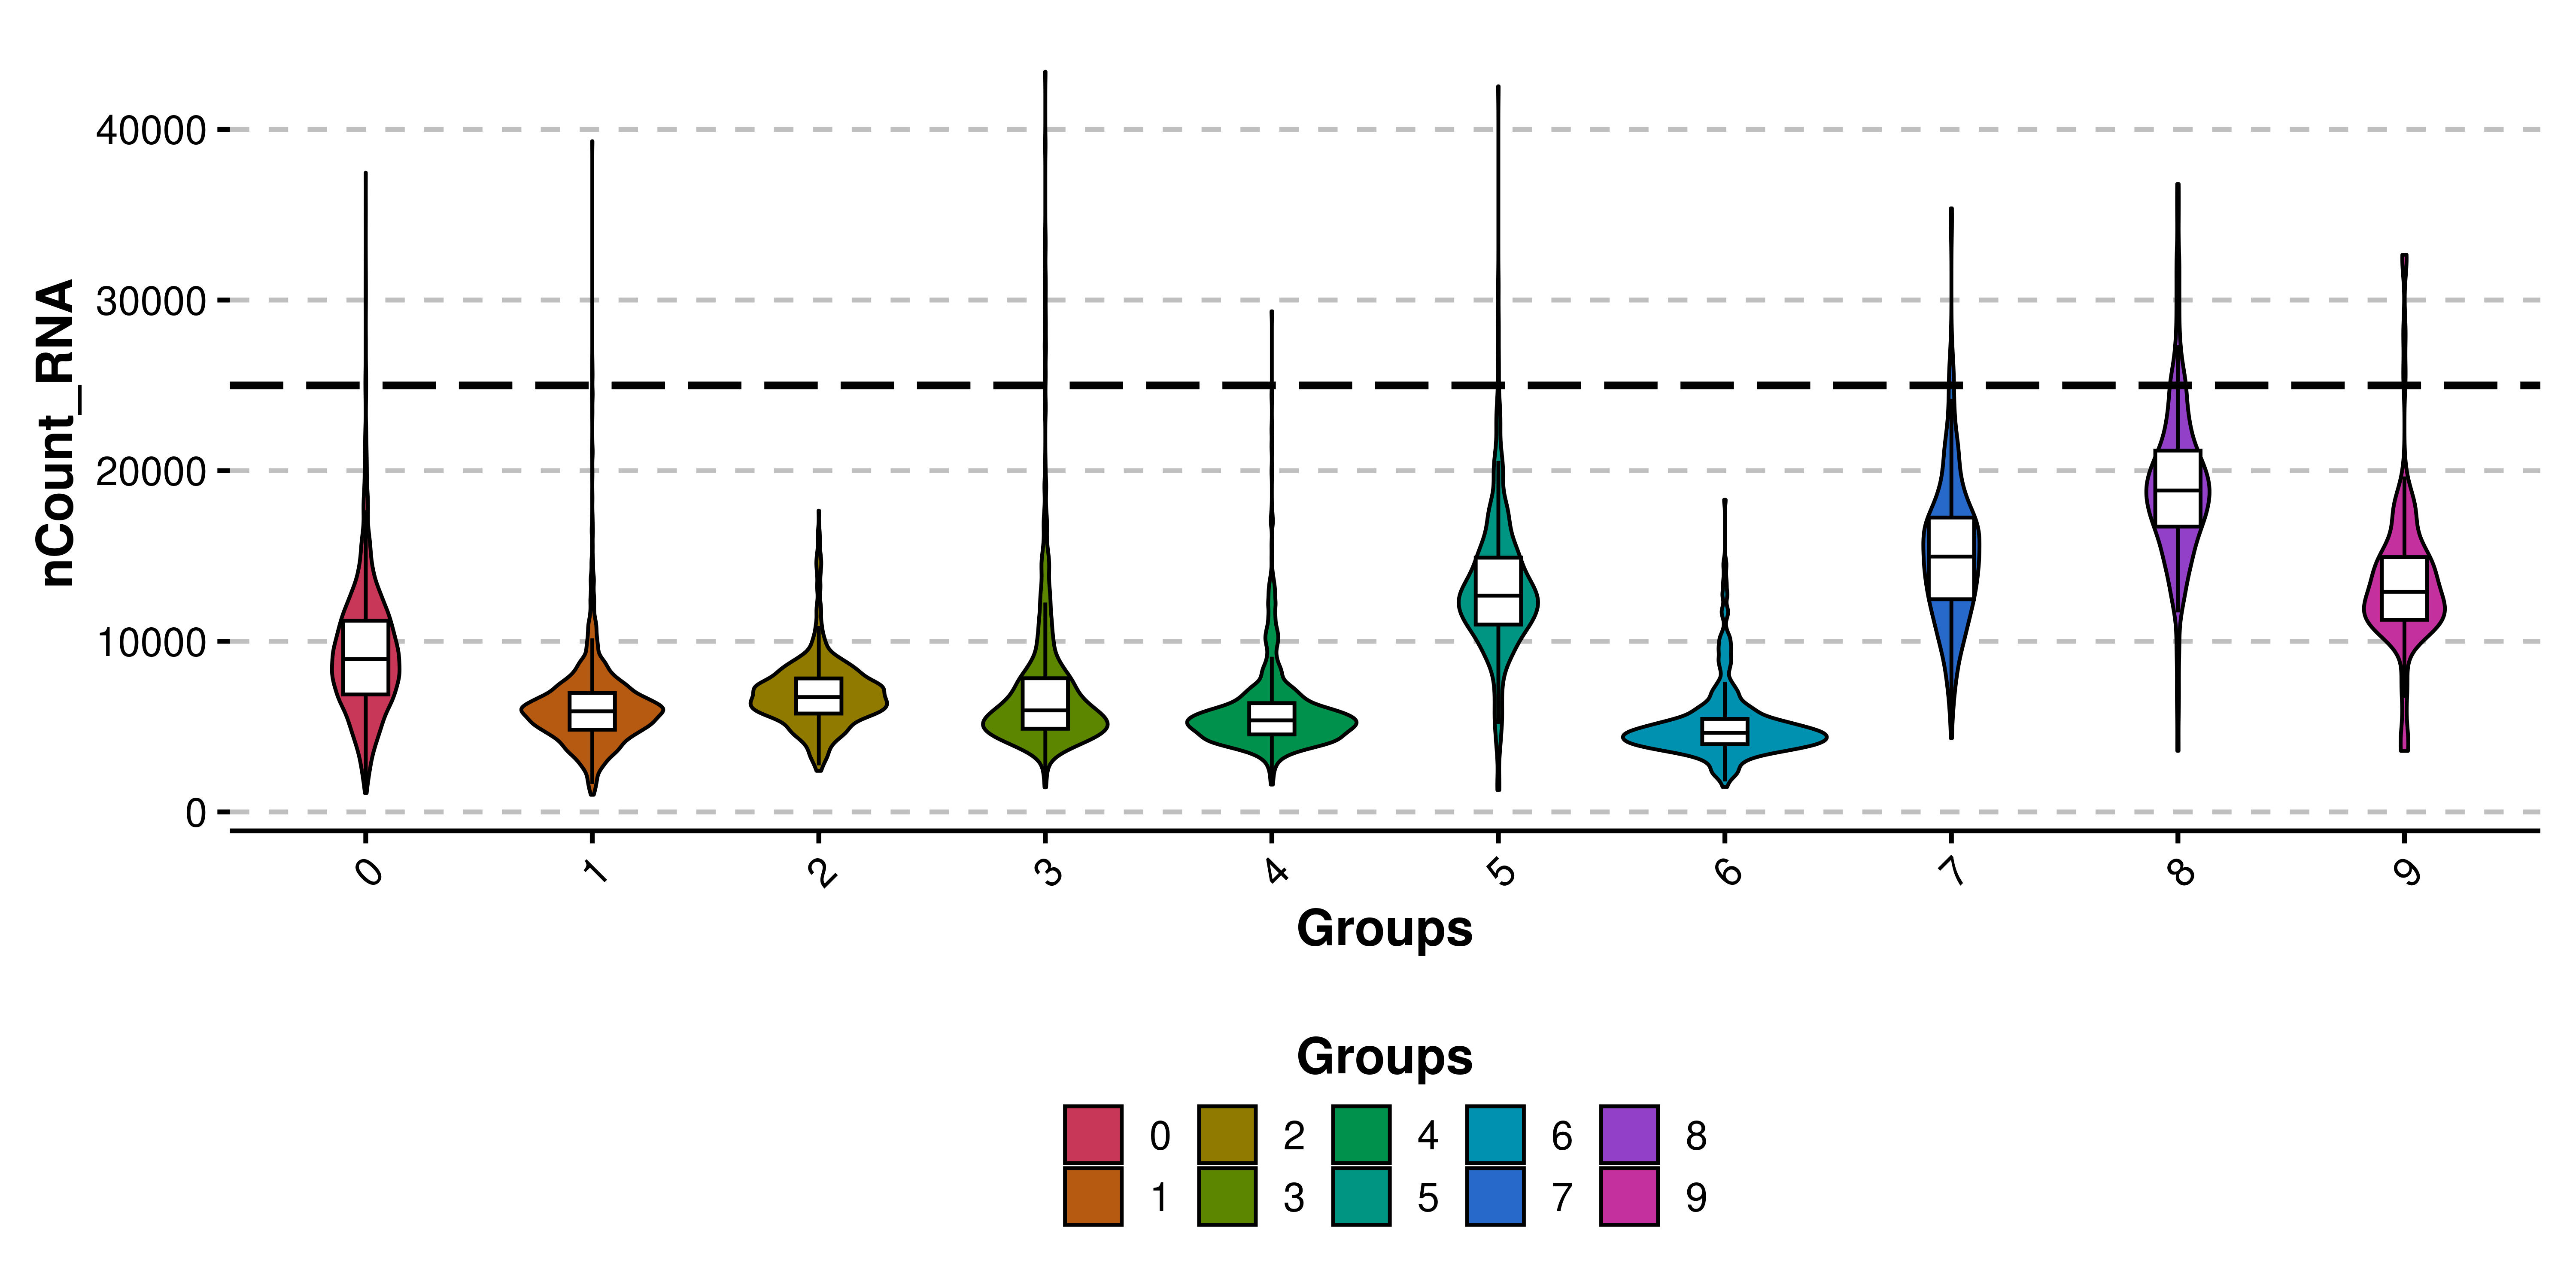
Sometimes we might want to modify the overall look of the violin plots. For instance, the line width of both the violin shape and the box plot can be modified with line_width parameter, which defaults to 1.
# Increase line width.
p1 <- SCpubr::do_ViolinPlot(sample = sample,
                         features = "nCount_RNA")

p2 <- SCpubr::do_ViolinPlot(sample = sample,
                         features = "nCount_RNA",
                         line_width = 2)

p <- p1 / p2
p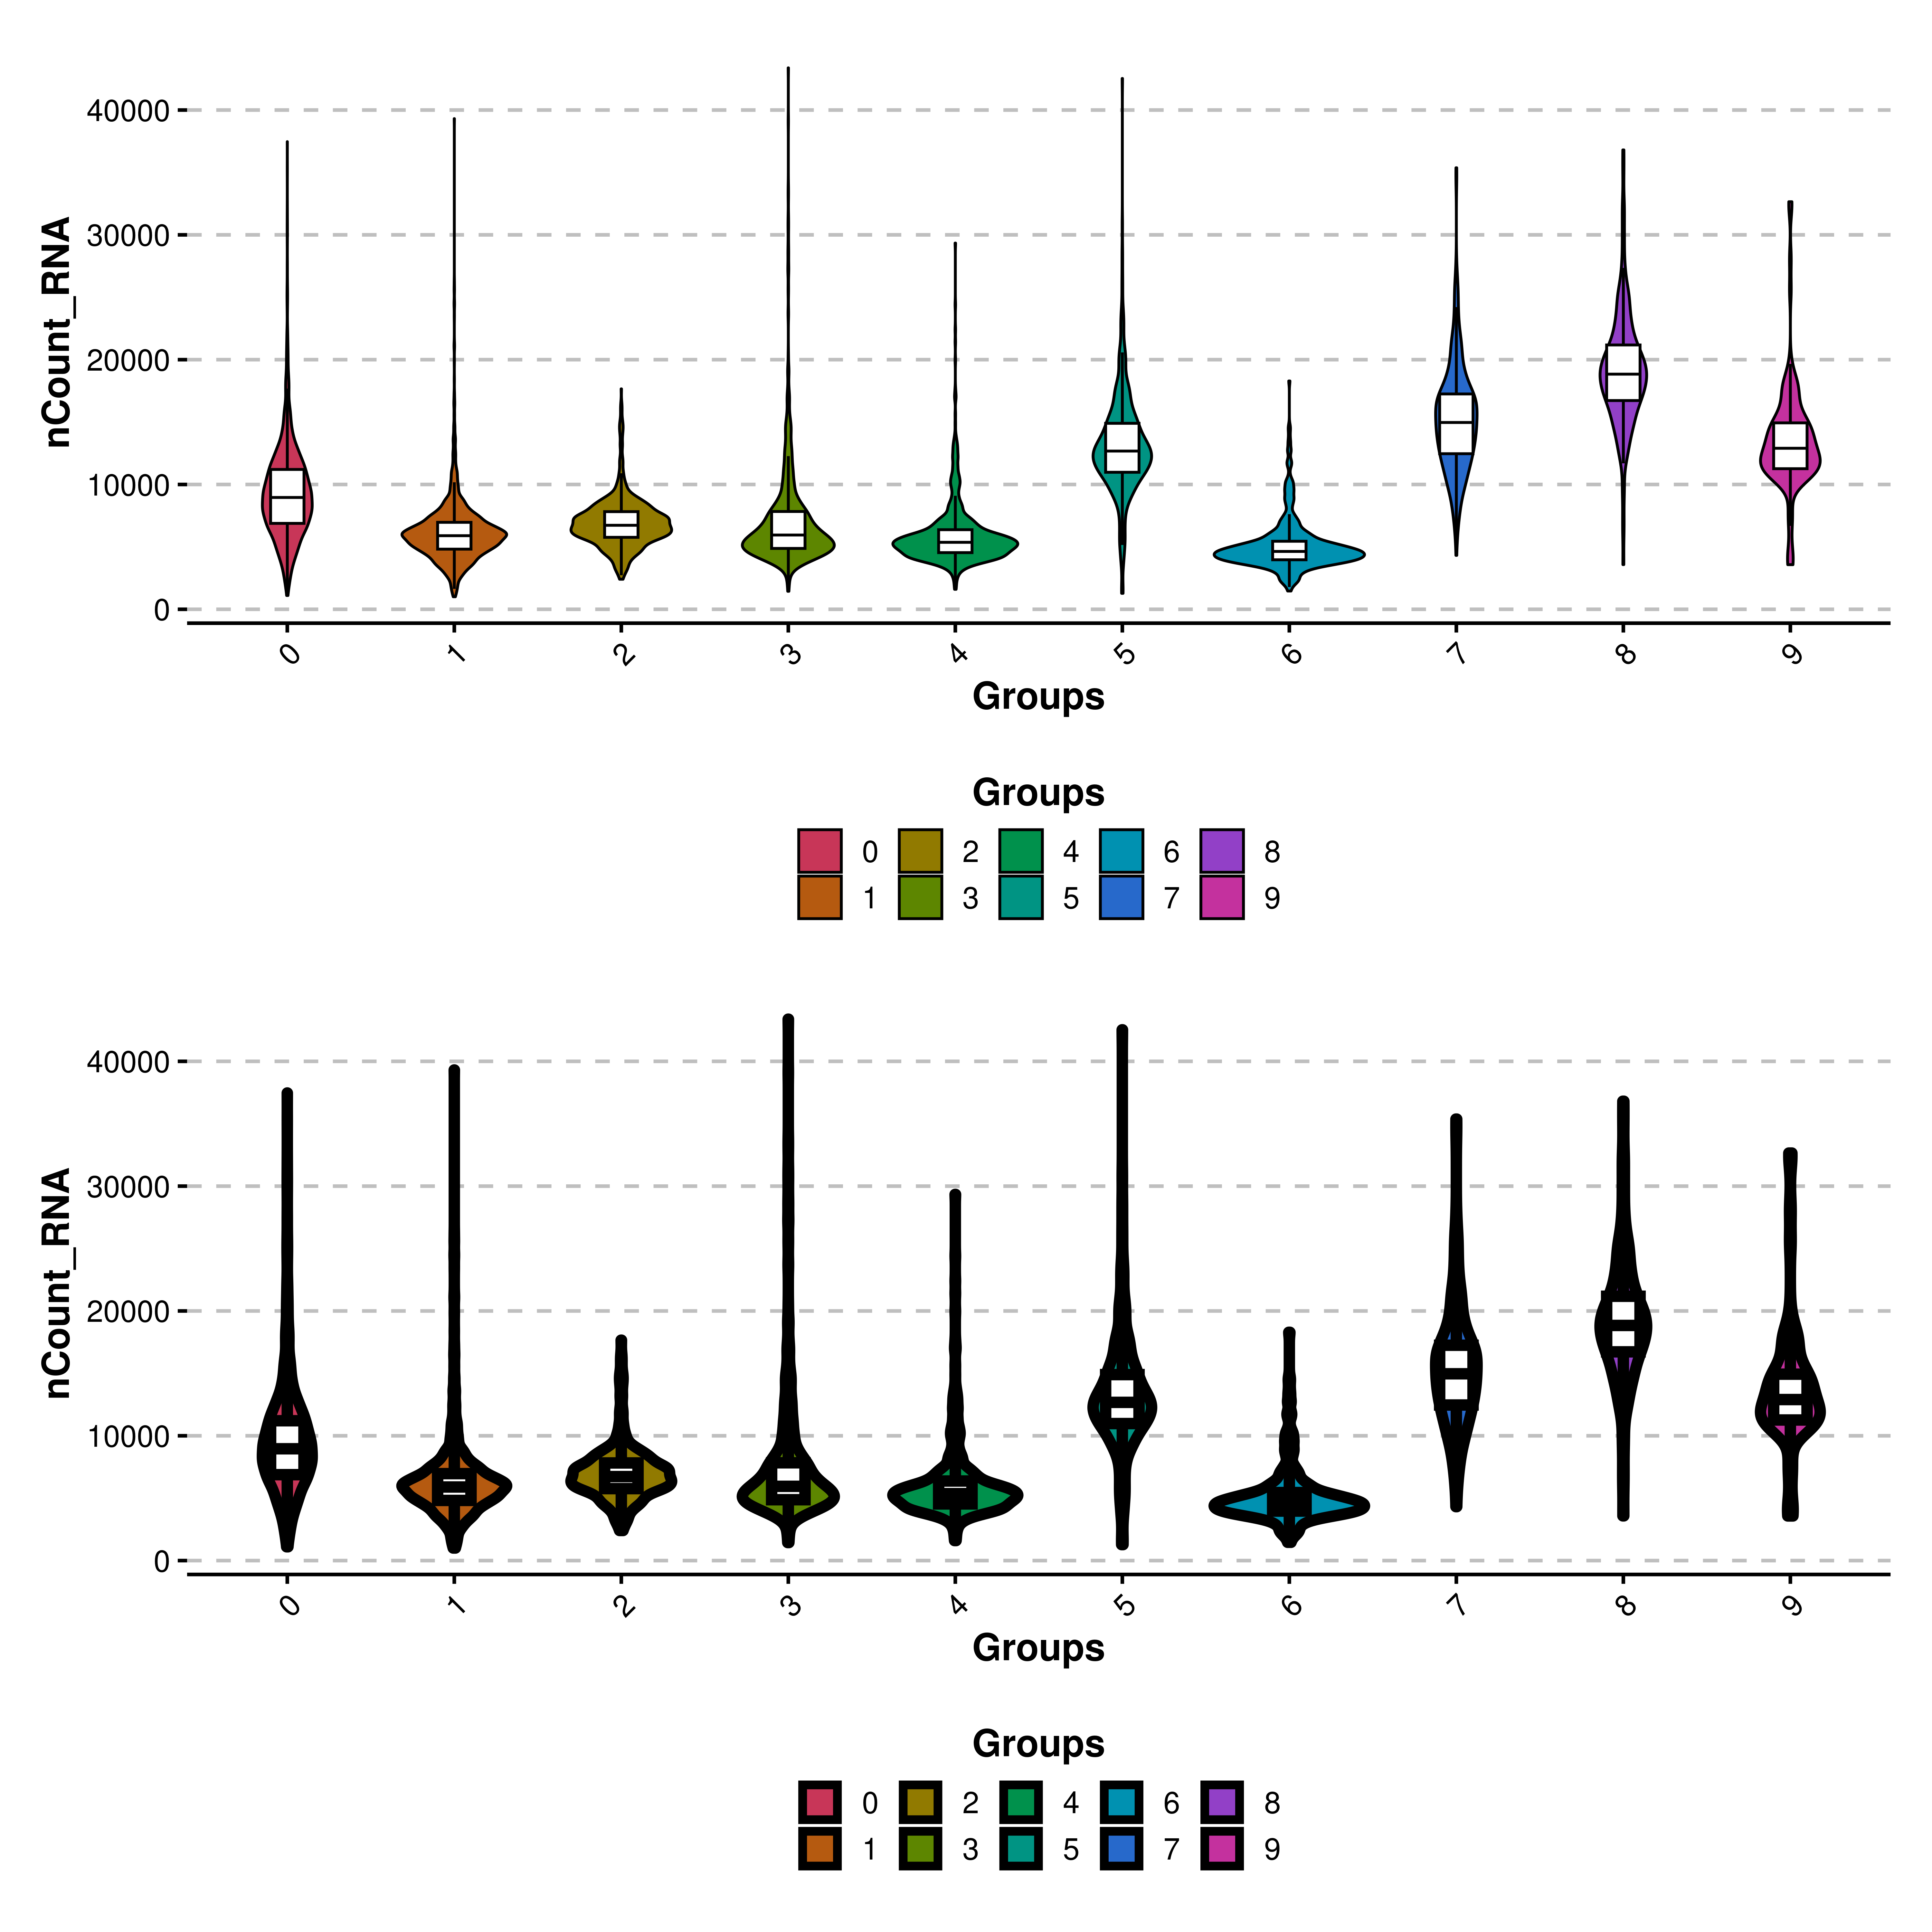
Also, the width of the box plots can be modified with boxplot_width parameter, which defaults to 0.2. Be aware that this parameter scales the width of the boxplot. This is, if a value of 1 is provided, the box plot will take as much space as the violin shape. It is recommended to deviate from 0.2 by a small amount.
# Decrease boxplot width.
p1 <- SCpubr::do_ViolinPlot(sample = sample,
                            features = "nCount_RNA")

p2 <- SCpubr::do_ViolinPlot(sample = sample,
                            features = "nCount_RNA",
                            boxplot_width = 0.1)

p <- p1 / p2
p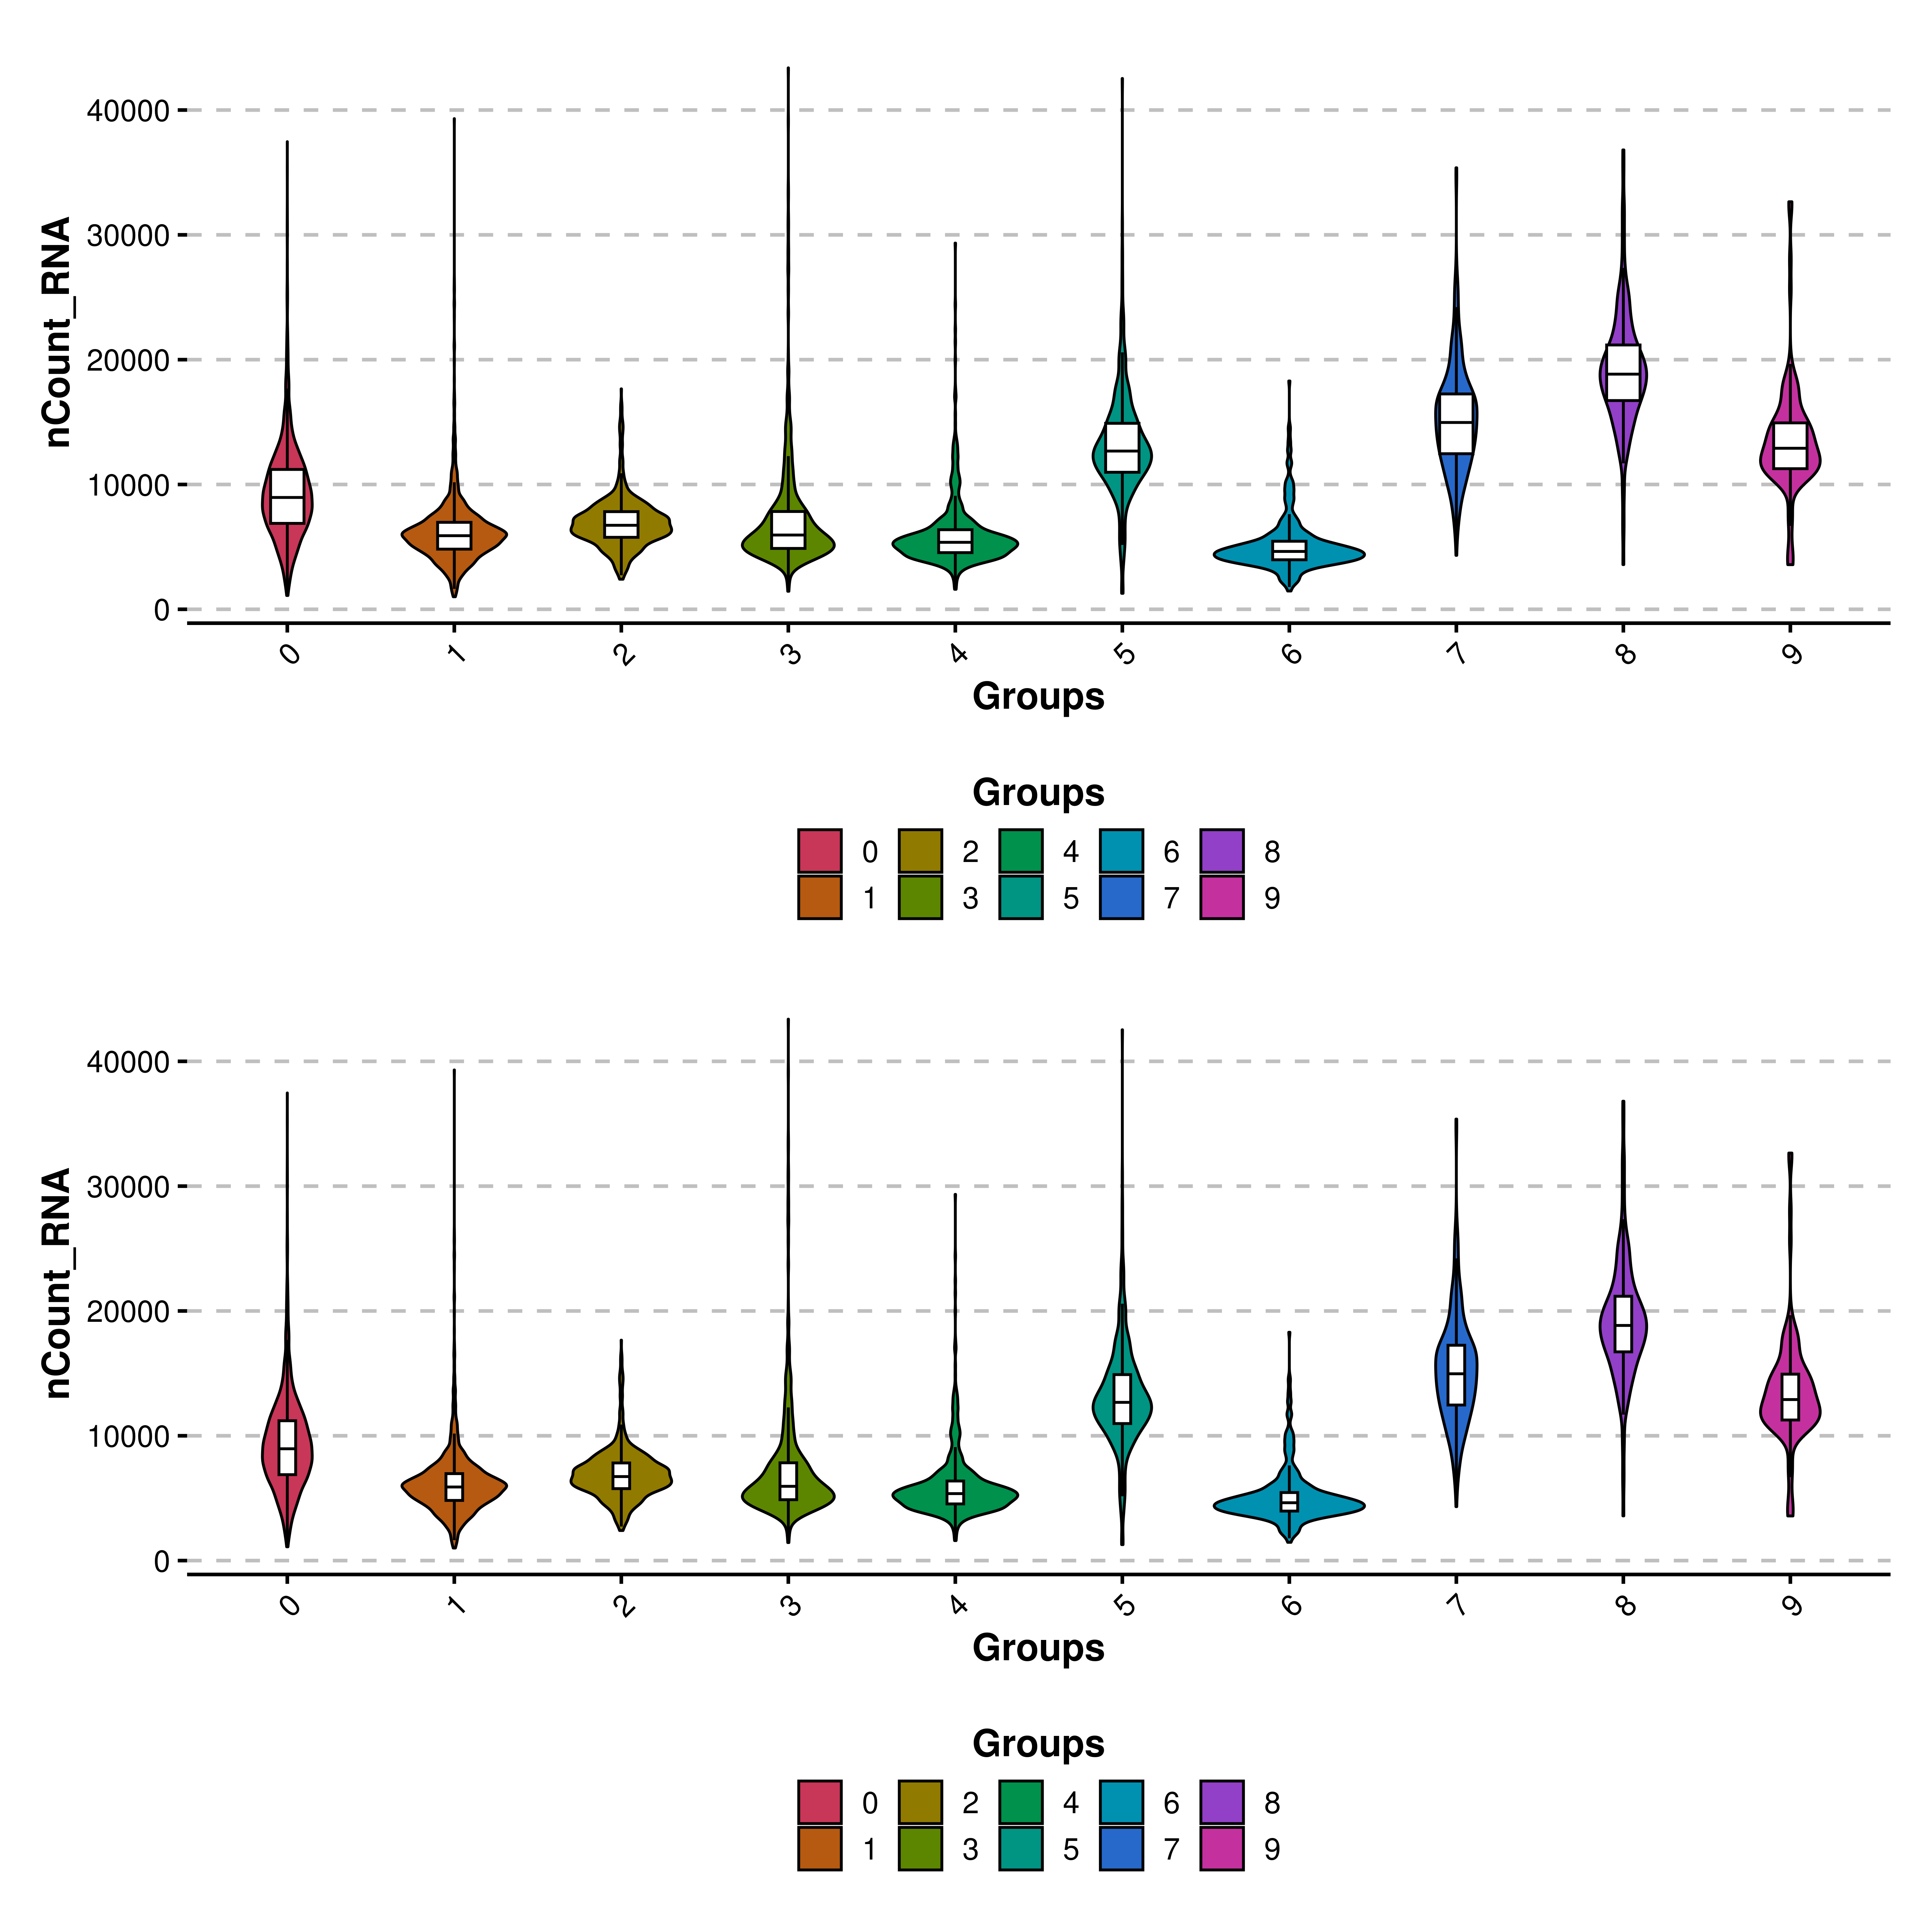
Finally, we can also set the same range of values for the Y axis using share.y.lims = TRUE. For this, we need to provide multiple features to features parameter. The maximum and minimum values will be the absolute maximum and minimum across the features.
# Share the same Y axis.
p <- SCpubr::do_ViolinPlot(sample = sample,
                           features = c("nCount_RNA", "nFeature_RNA"),
                           ncol = 1,
                           share.y.lims = TRUE)
p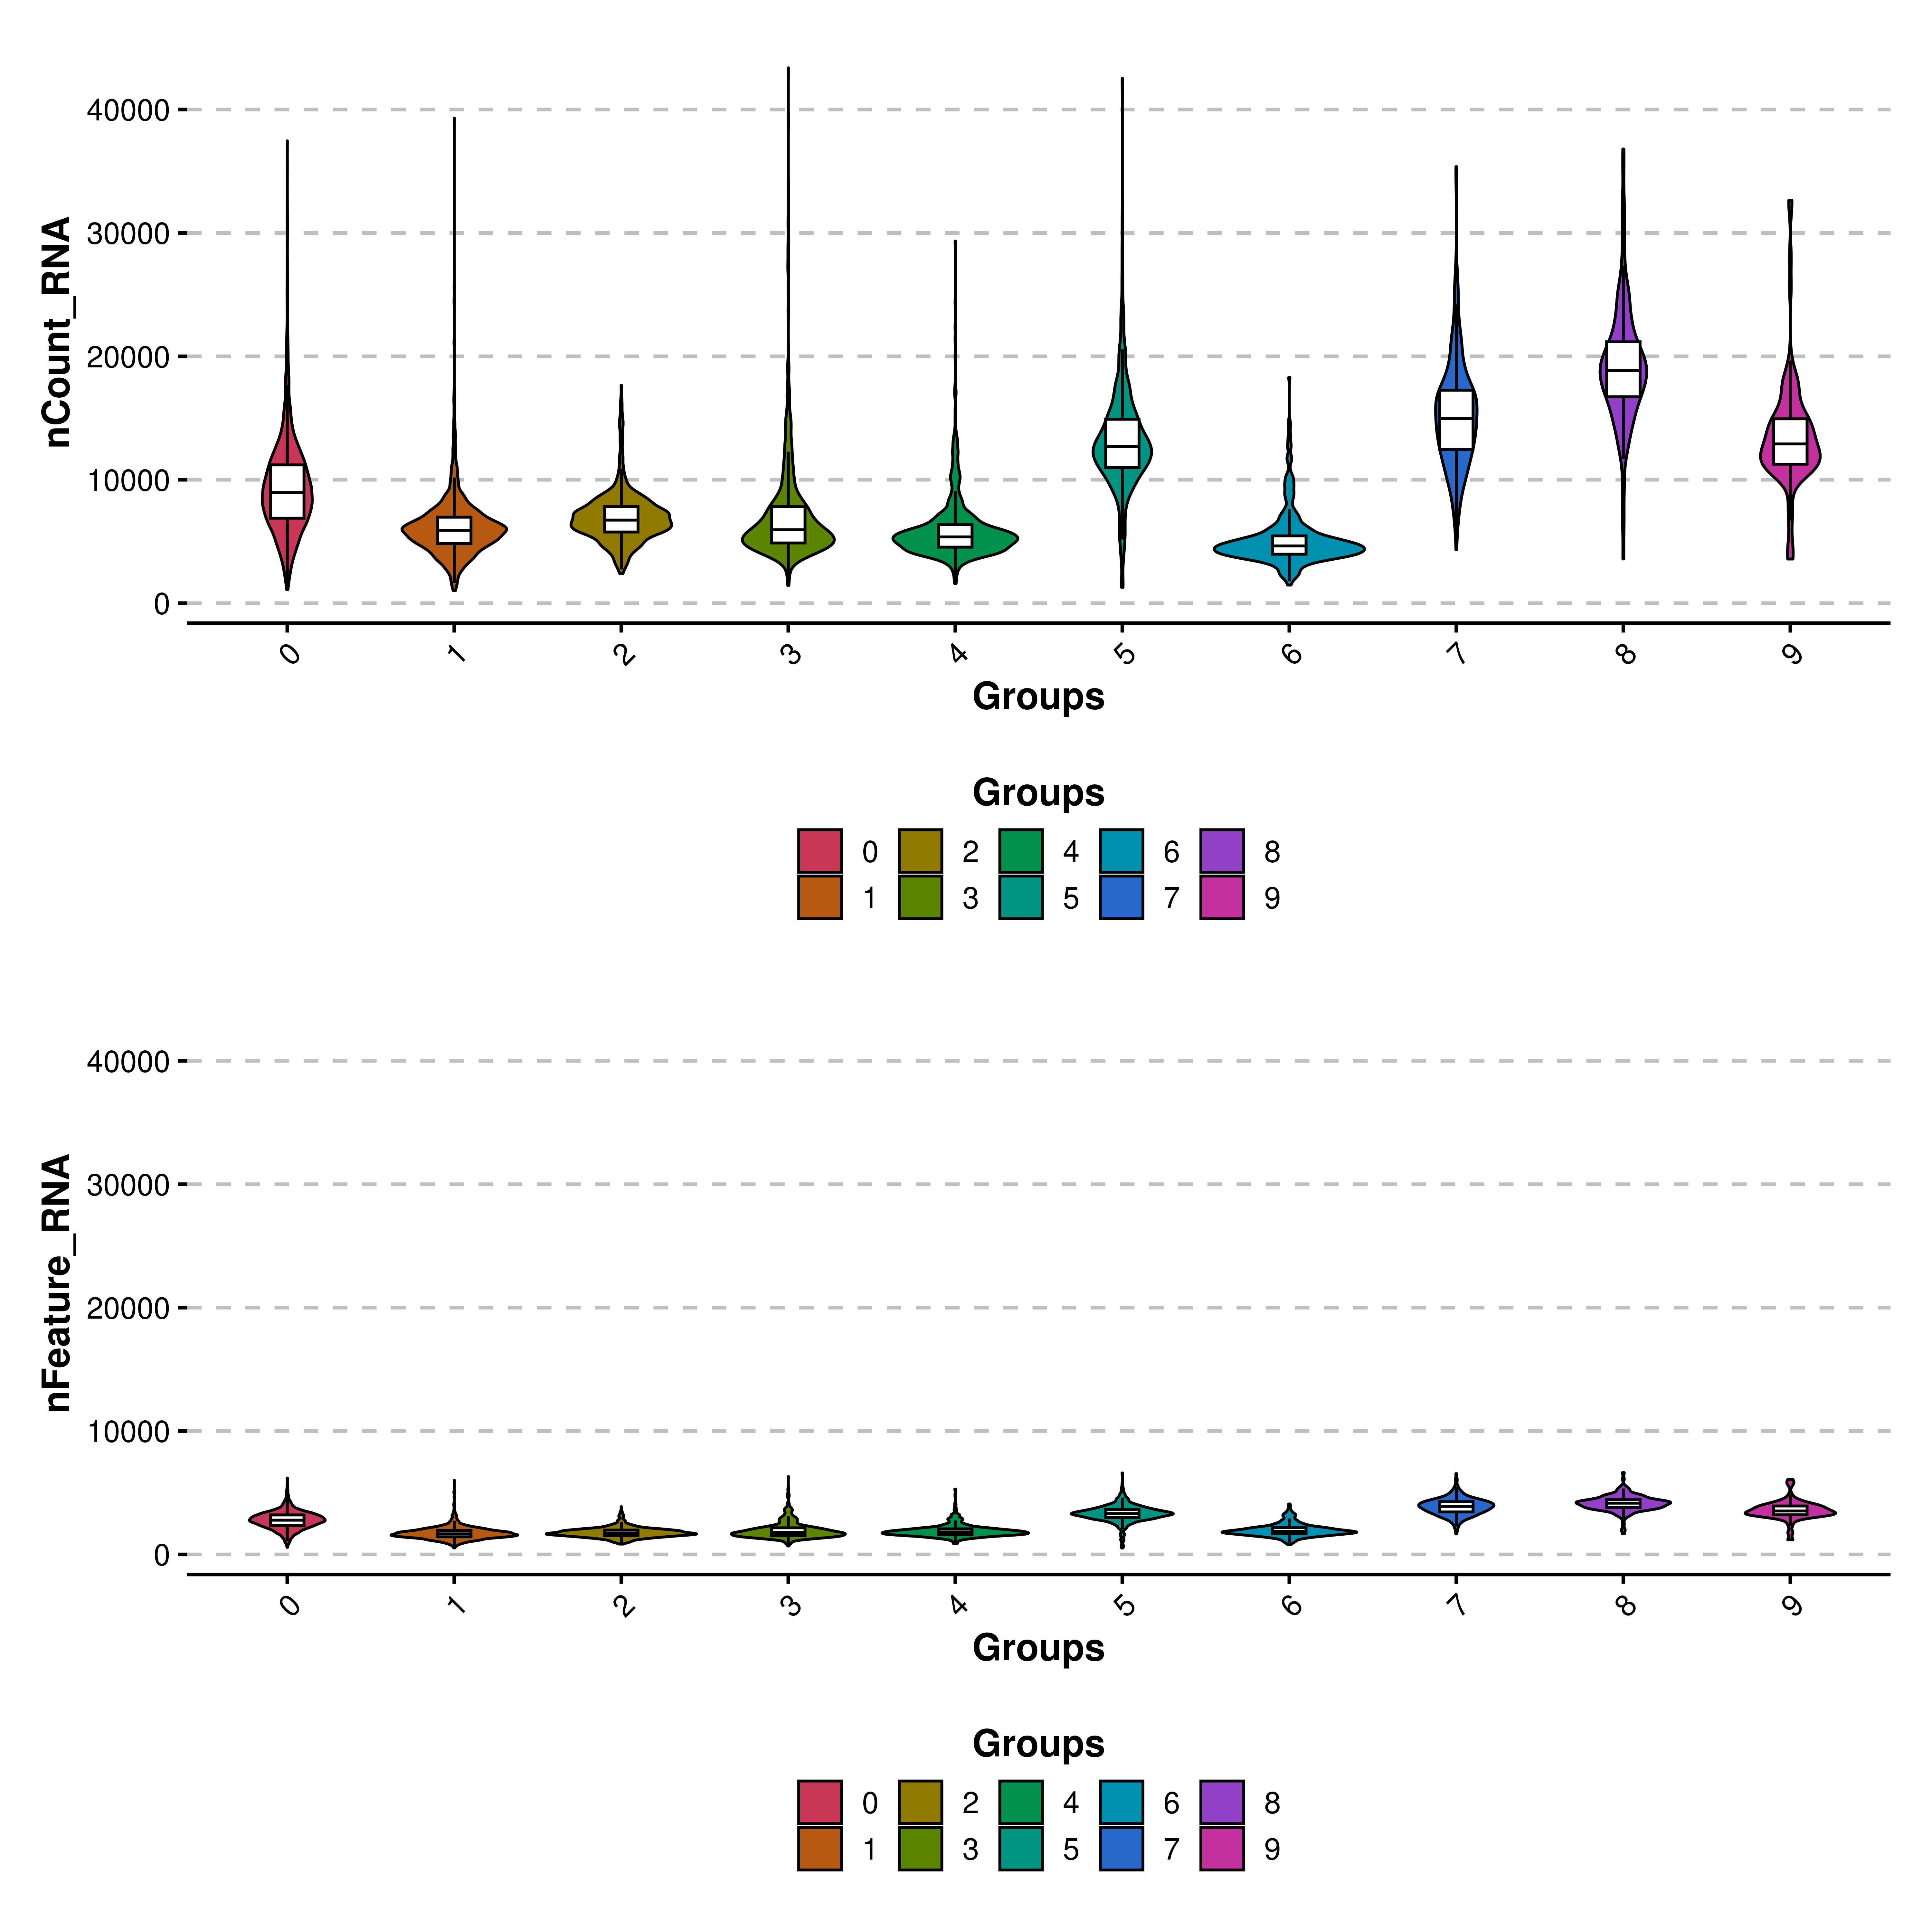
Finally, we can also generate split violin plots using the split.by parameter. However, plot_boxplot has to be set to FALSE:
p <- SCpubr::do_ViolinPlot(sample = sample,
                           features = "nCount_RNA",
                           split.by = "annotation",
                           plot_boxplot = FALSE)

p