SCpubr::do_DimPlot(sample = sample)
SCpubr::do_DimPlot(sample = sample)
SCpubr::do_DimPlot(sample = sample,
                   group.by = "annotation")
SCpubr::do_DimPlot(sample = sample,
                   split.by = "annotation")
SCpubr::do_DimPlot(sample = sample,
                   group.by = "seurat_clusters",
                   split.by = "annotation")
SCpubr::do_DimPlot(sample = sample,
                   idents.keep = c("0", "2"))
# Highlight a given set of cells
SCpubr::do_DimPlot(sample = sample,
                   cells.highlight = sample(colnames(sample), 100))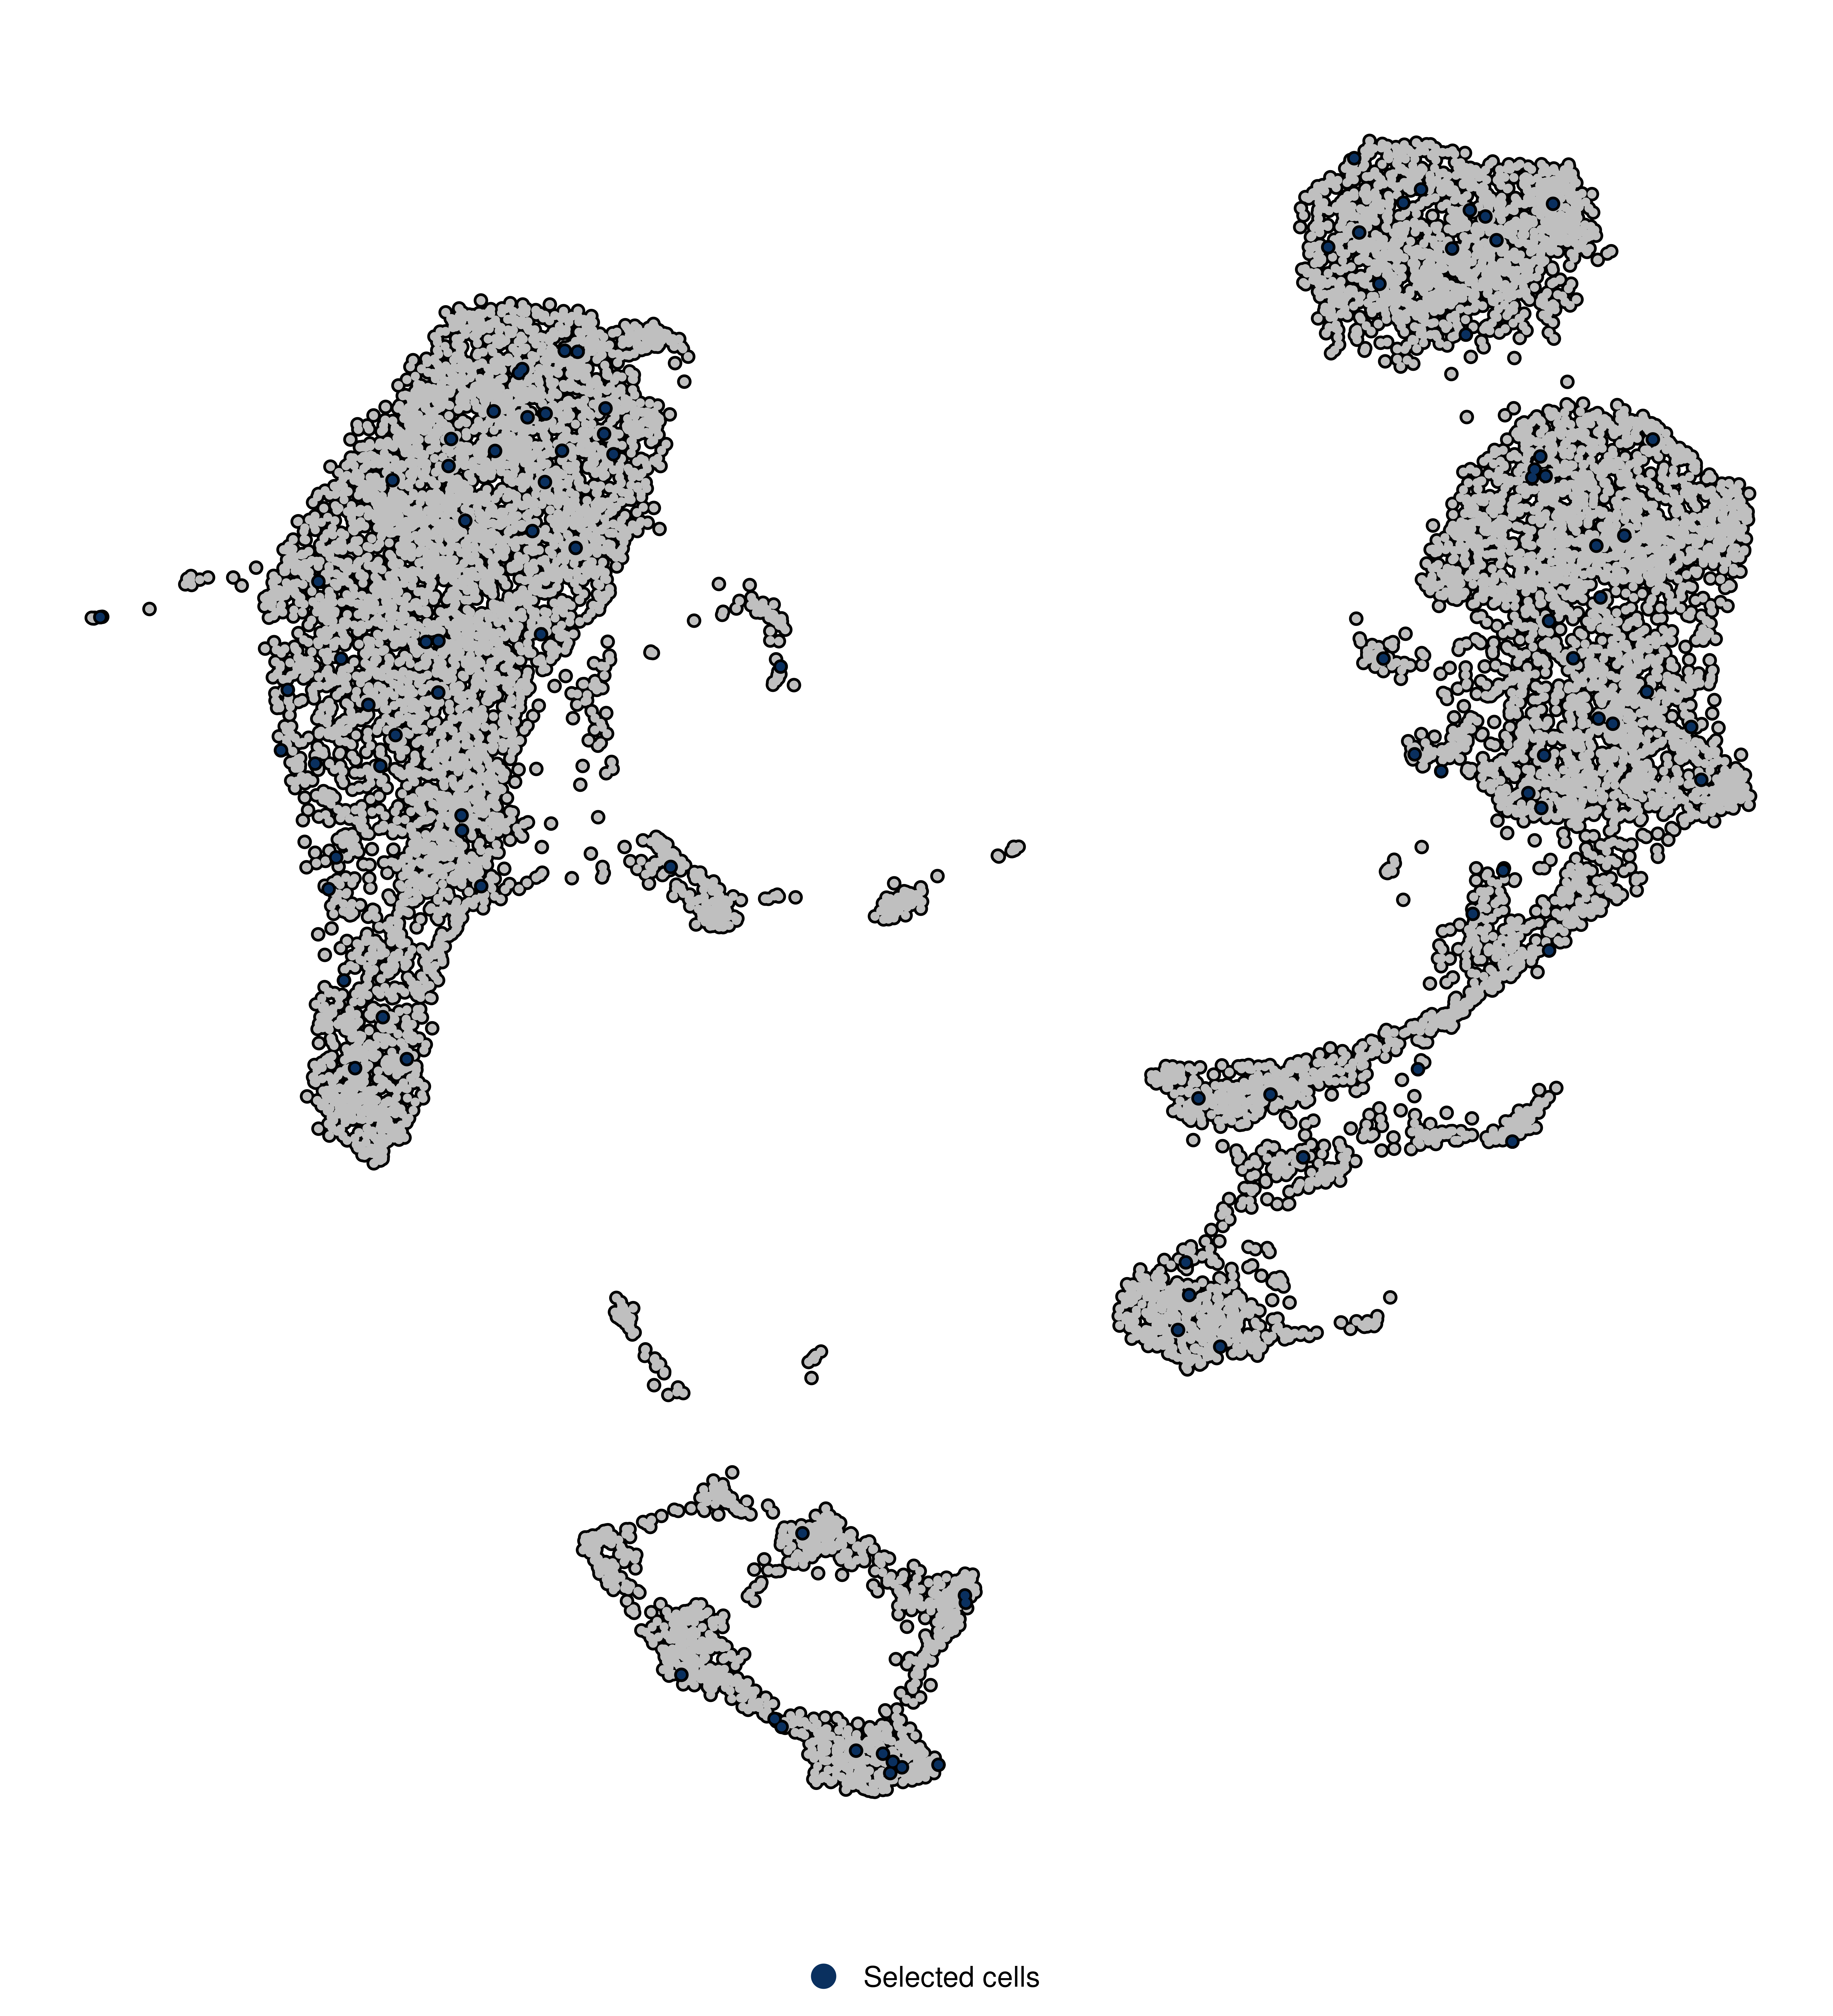
# Highlight a given identity from Seurat::Idents(sample).
SCpubr::do_DimPlot(sample = sample,
                   idents.highlight = "0")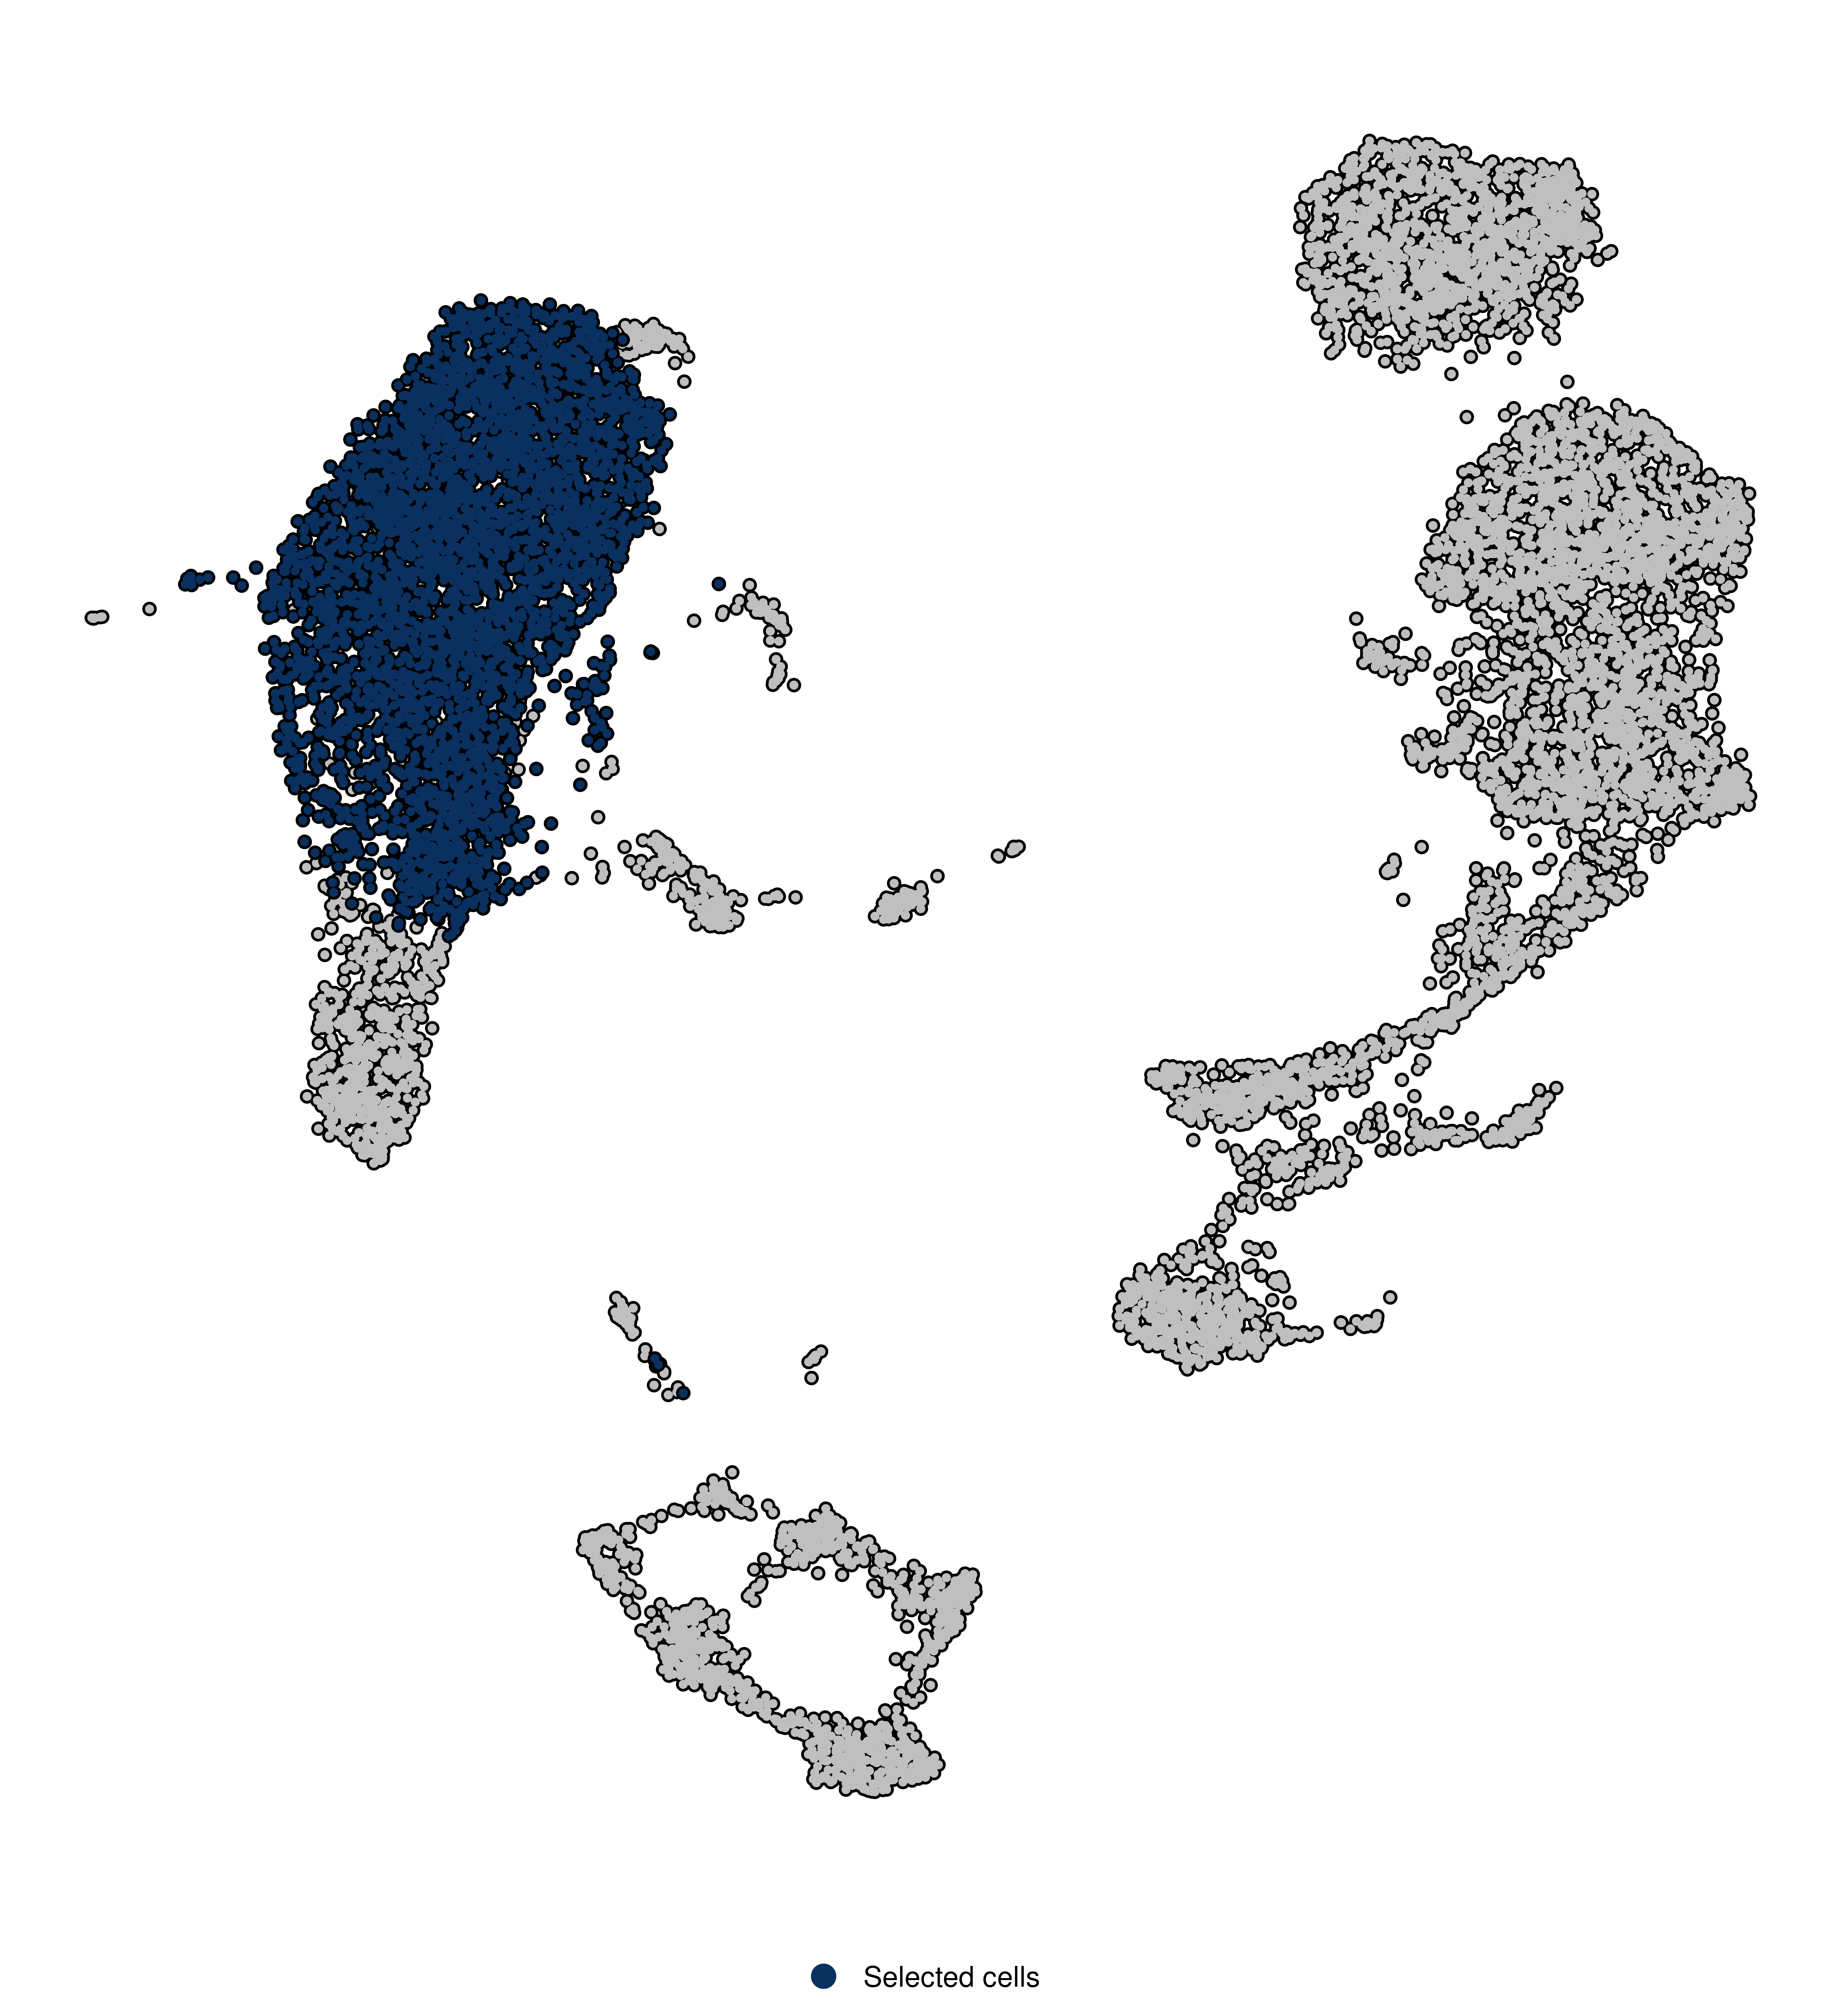
A combination of cells.highlight and idents.hightlight also works!
SCpubr::do_DimPlot(sample = sample,
                   reduction = "pca")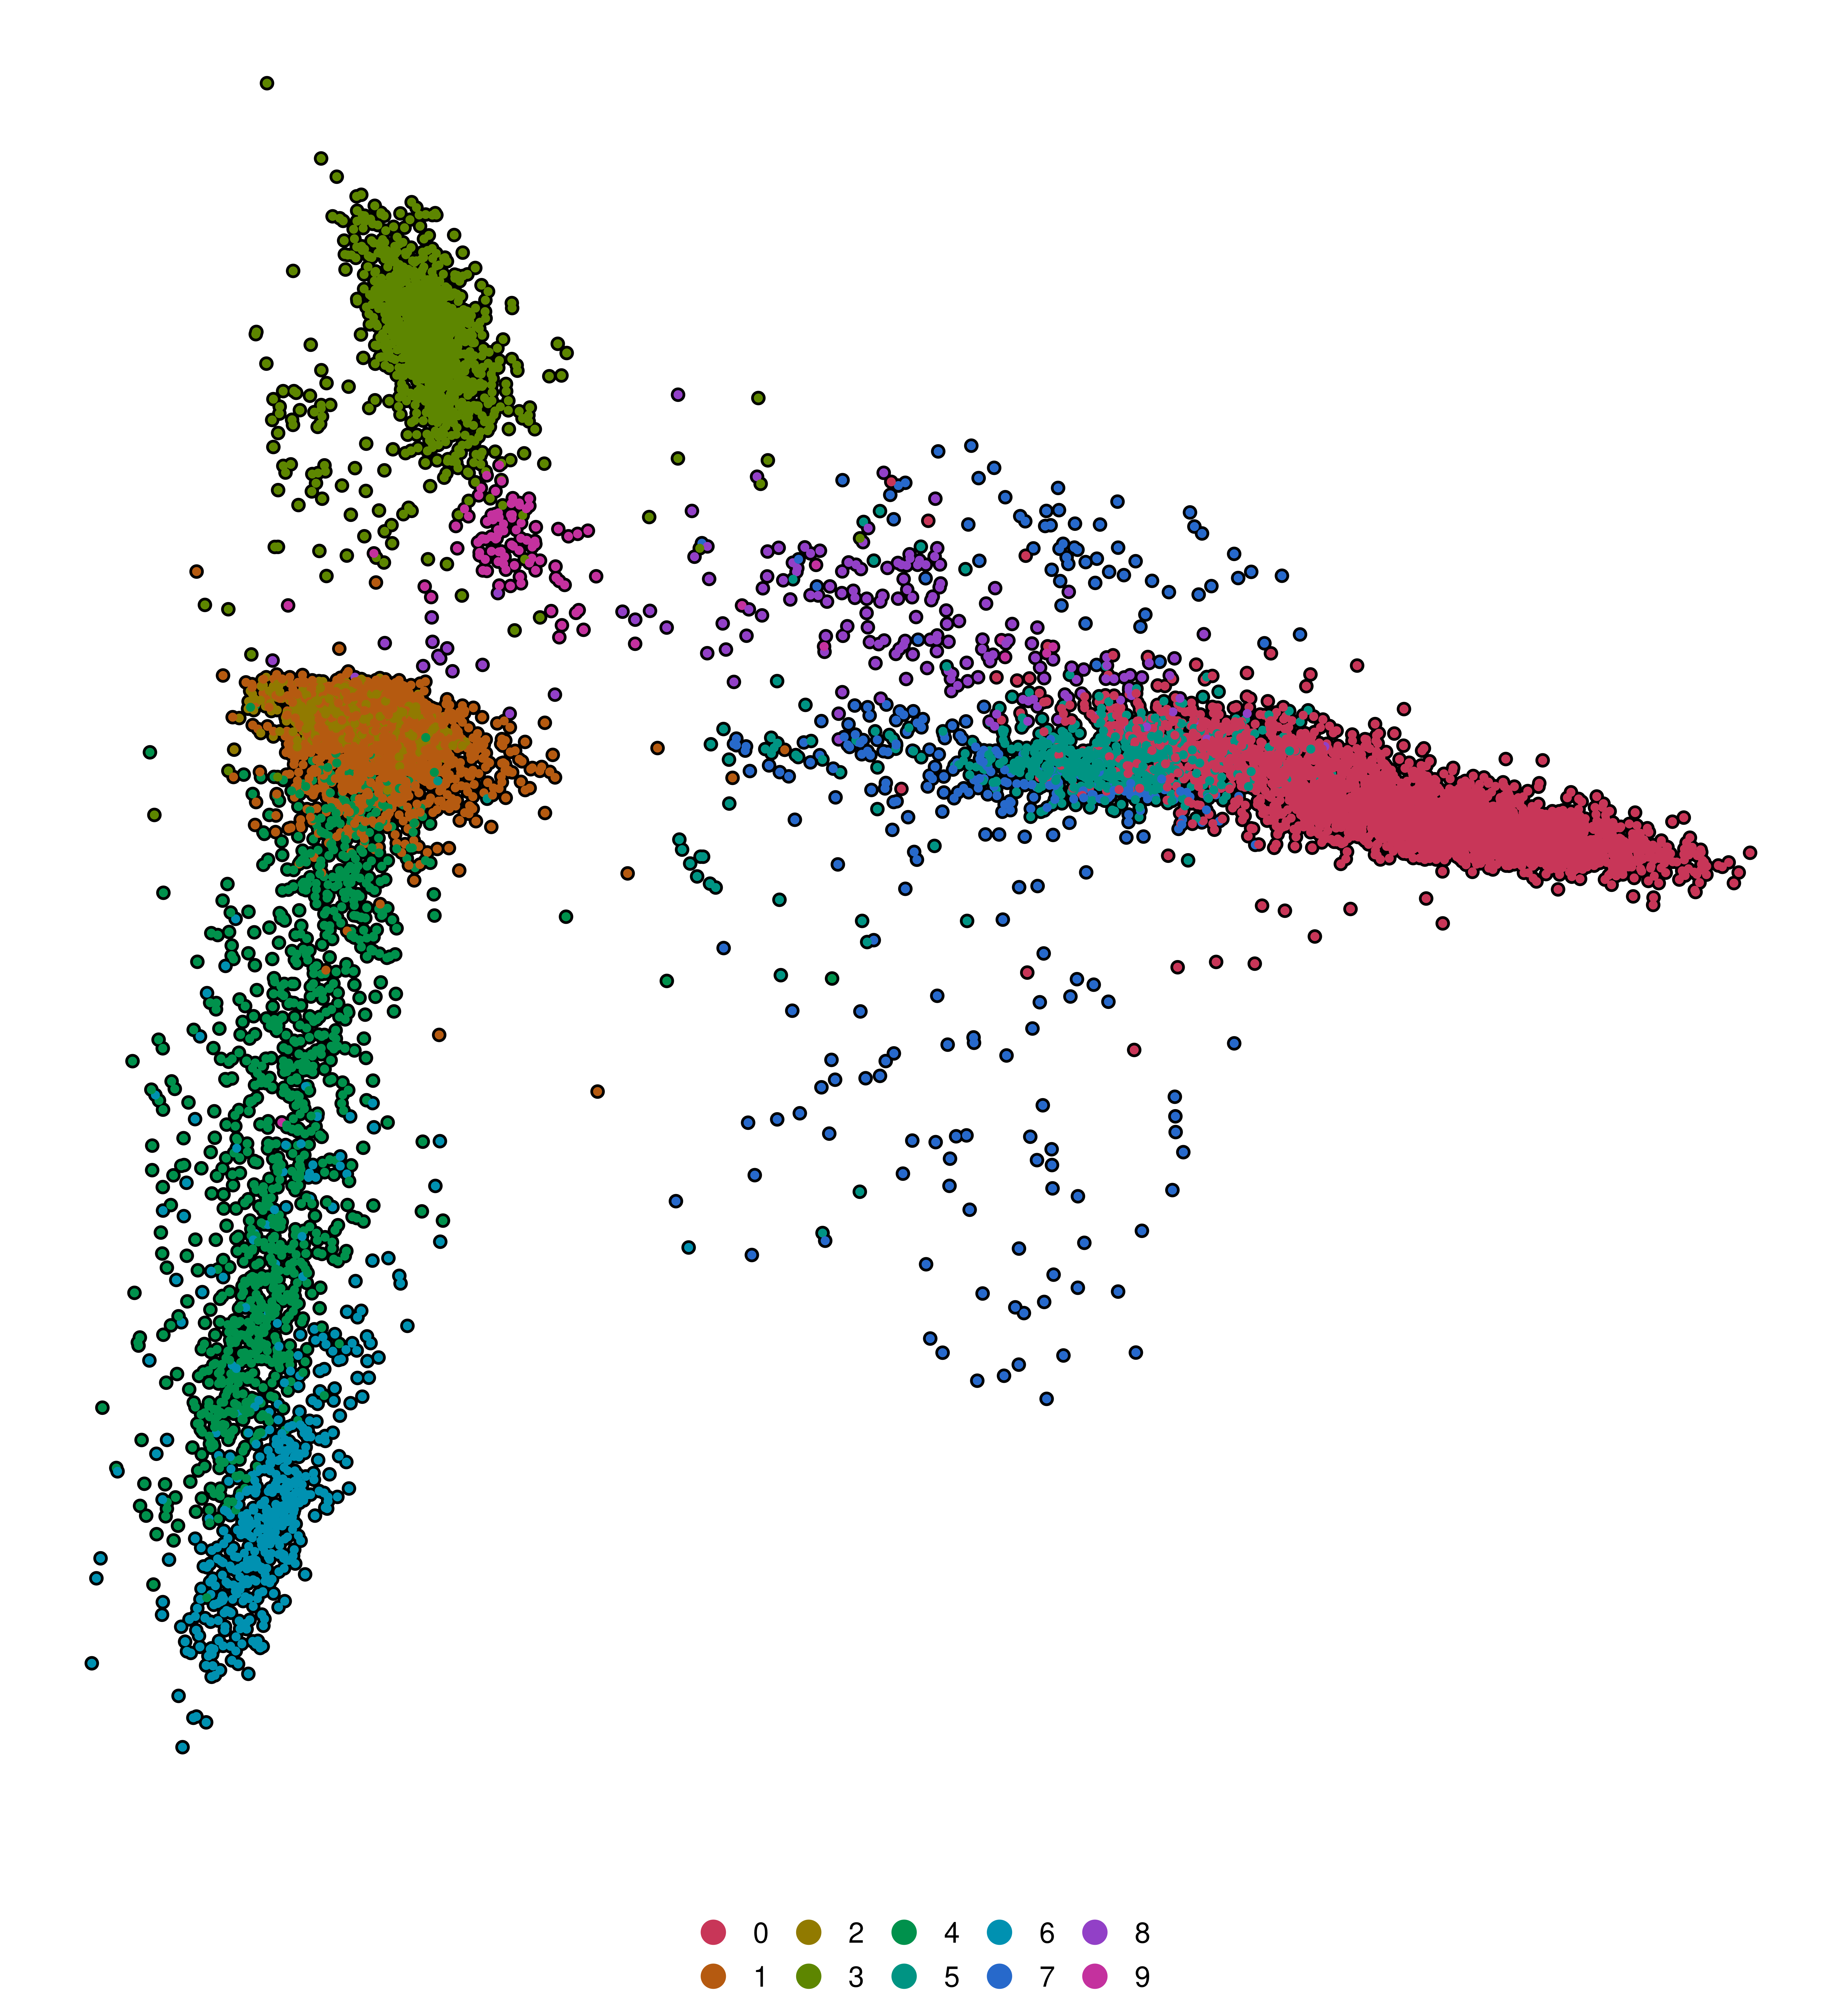
SCpubr::do_DimPlot(sample = sample,
                   reduction = "pca",
                   dims = c(1, 2))
Note that, by default, the dimensional reduction of choice is the lastest computed in the Seurat object.
SCpubr::do_DimPlot(sample = sample,
                   plot.axes = TRUE)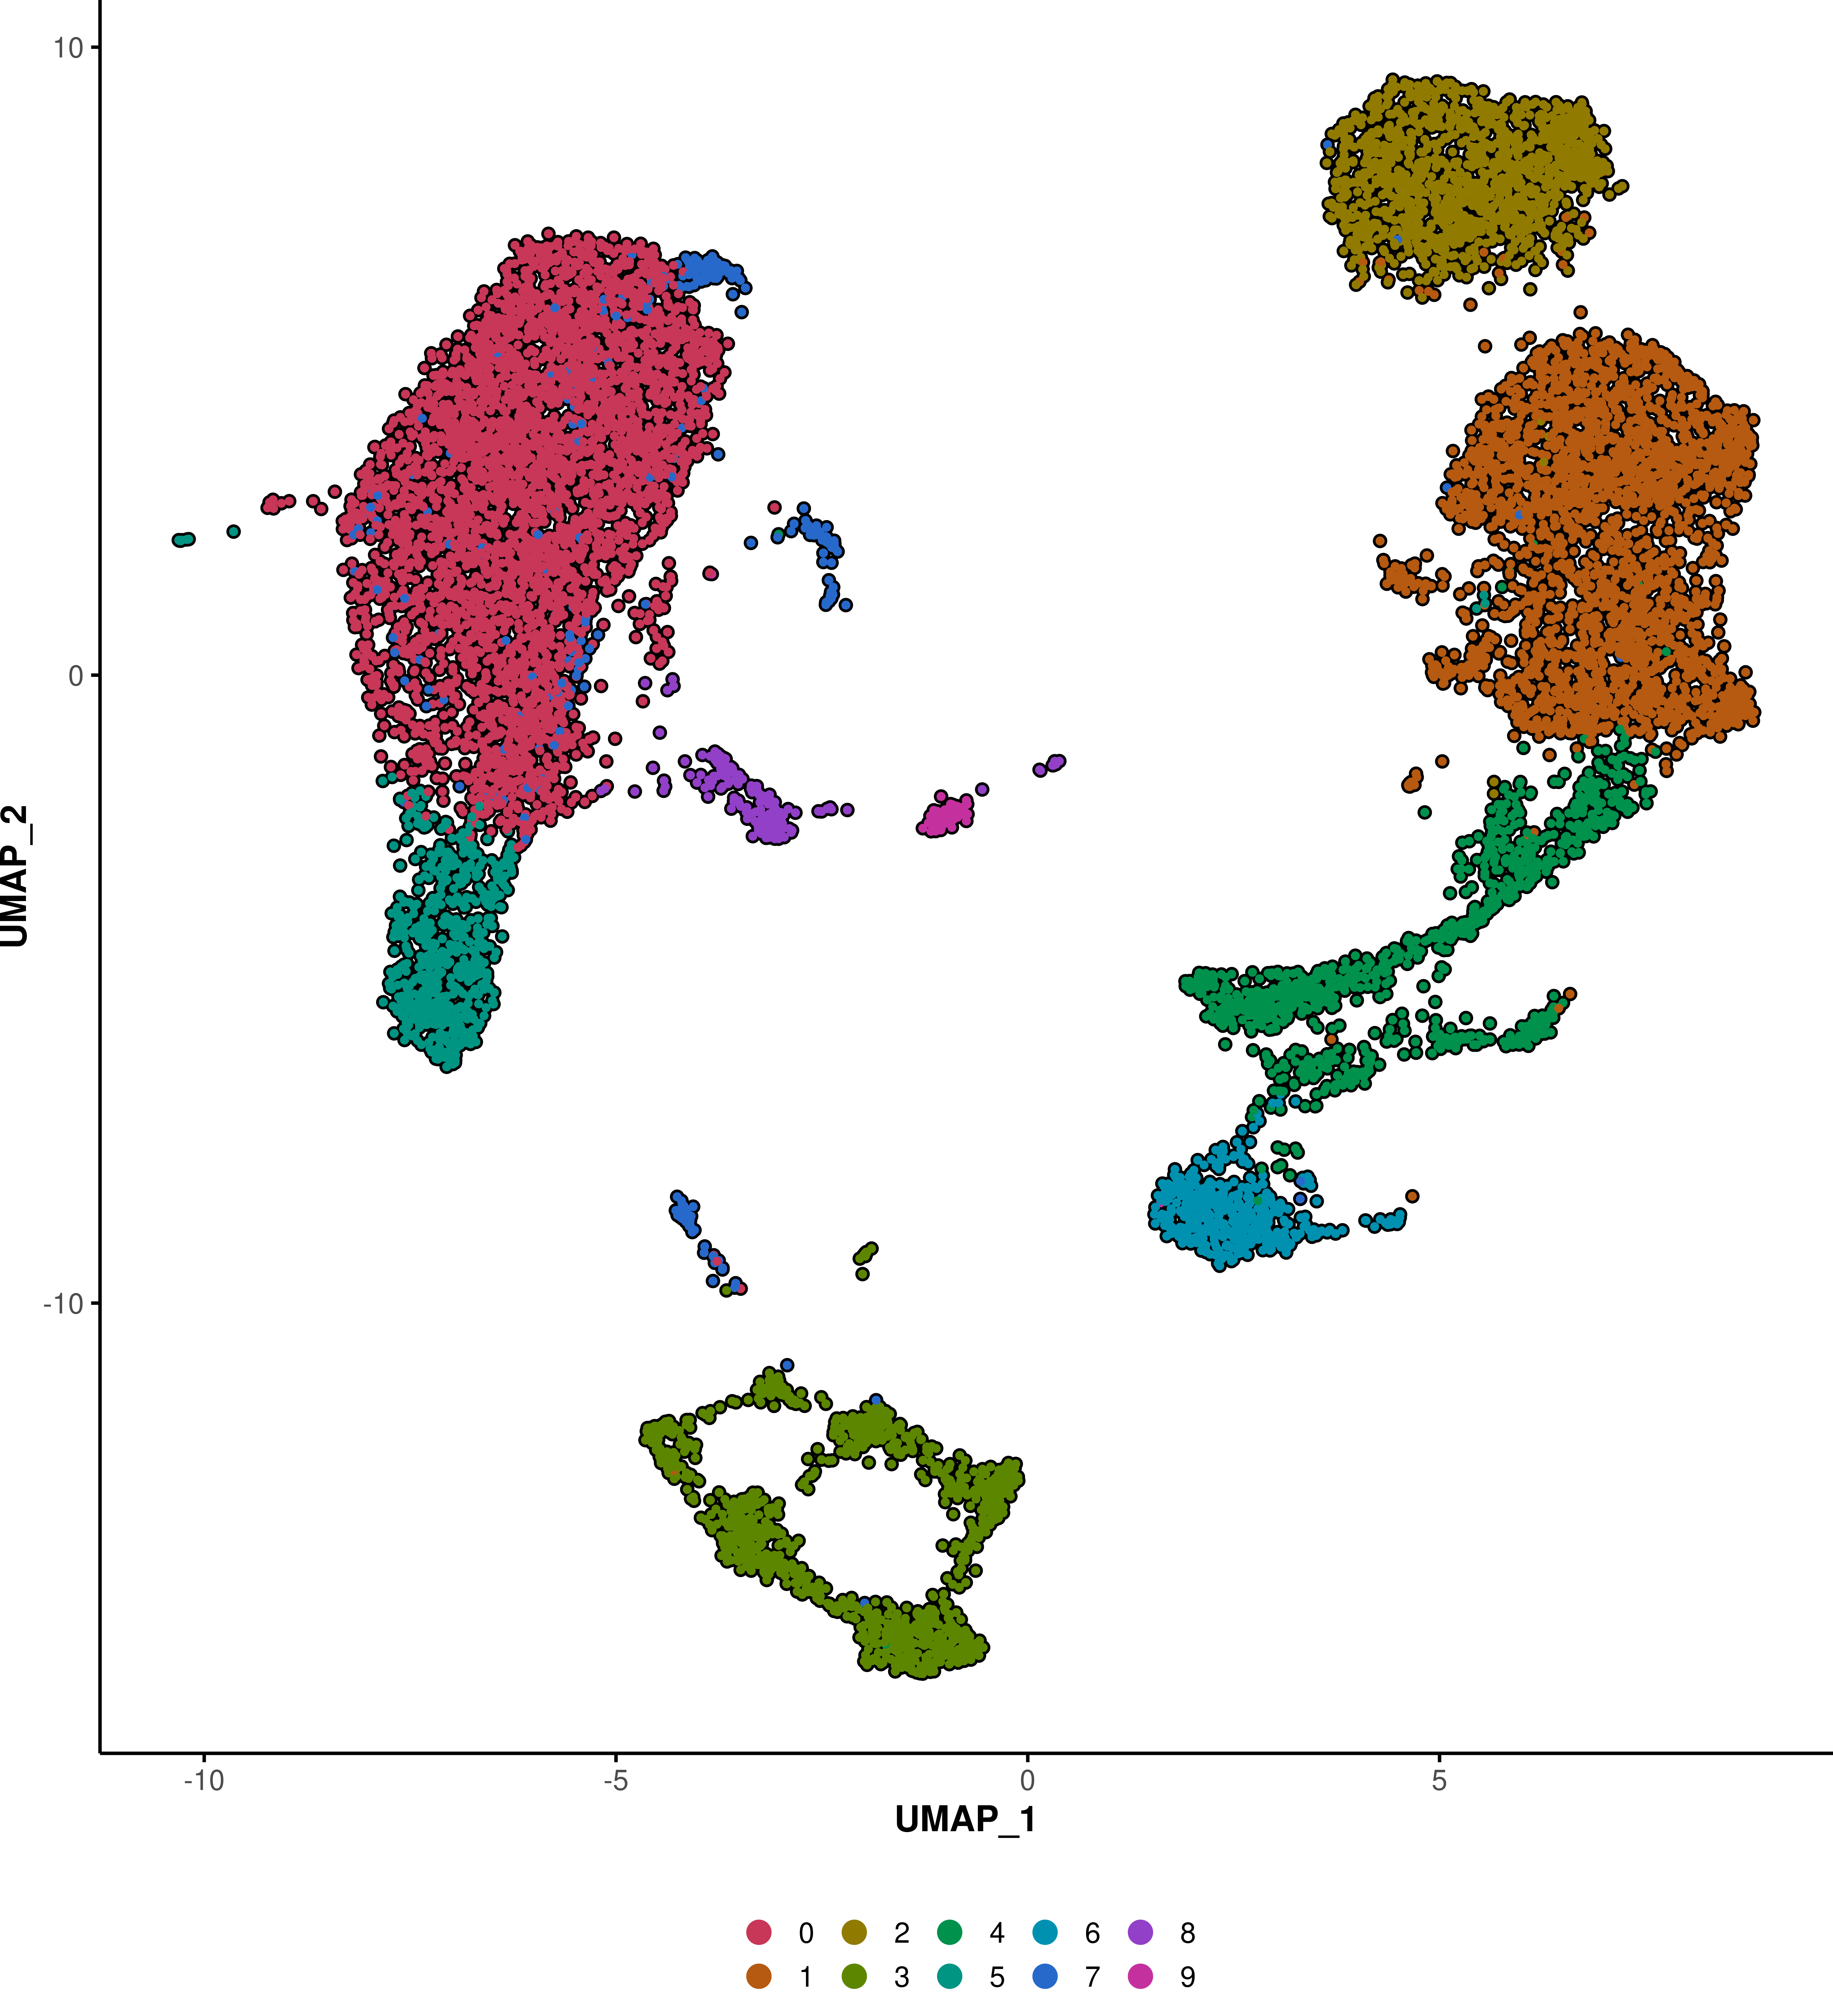
# Label the clusters - label geom.
SCpubr::do_DimPlot(sample = sample,
                   label = TRUE)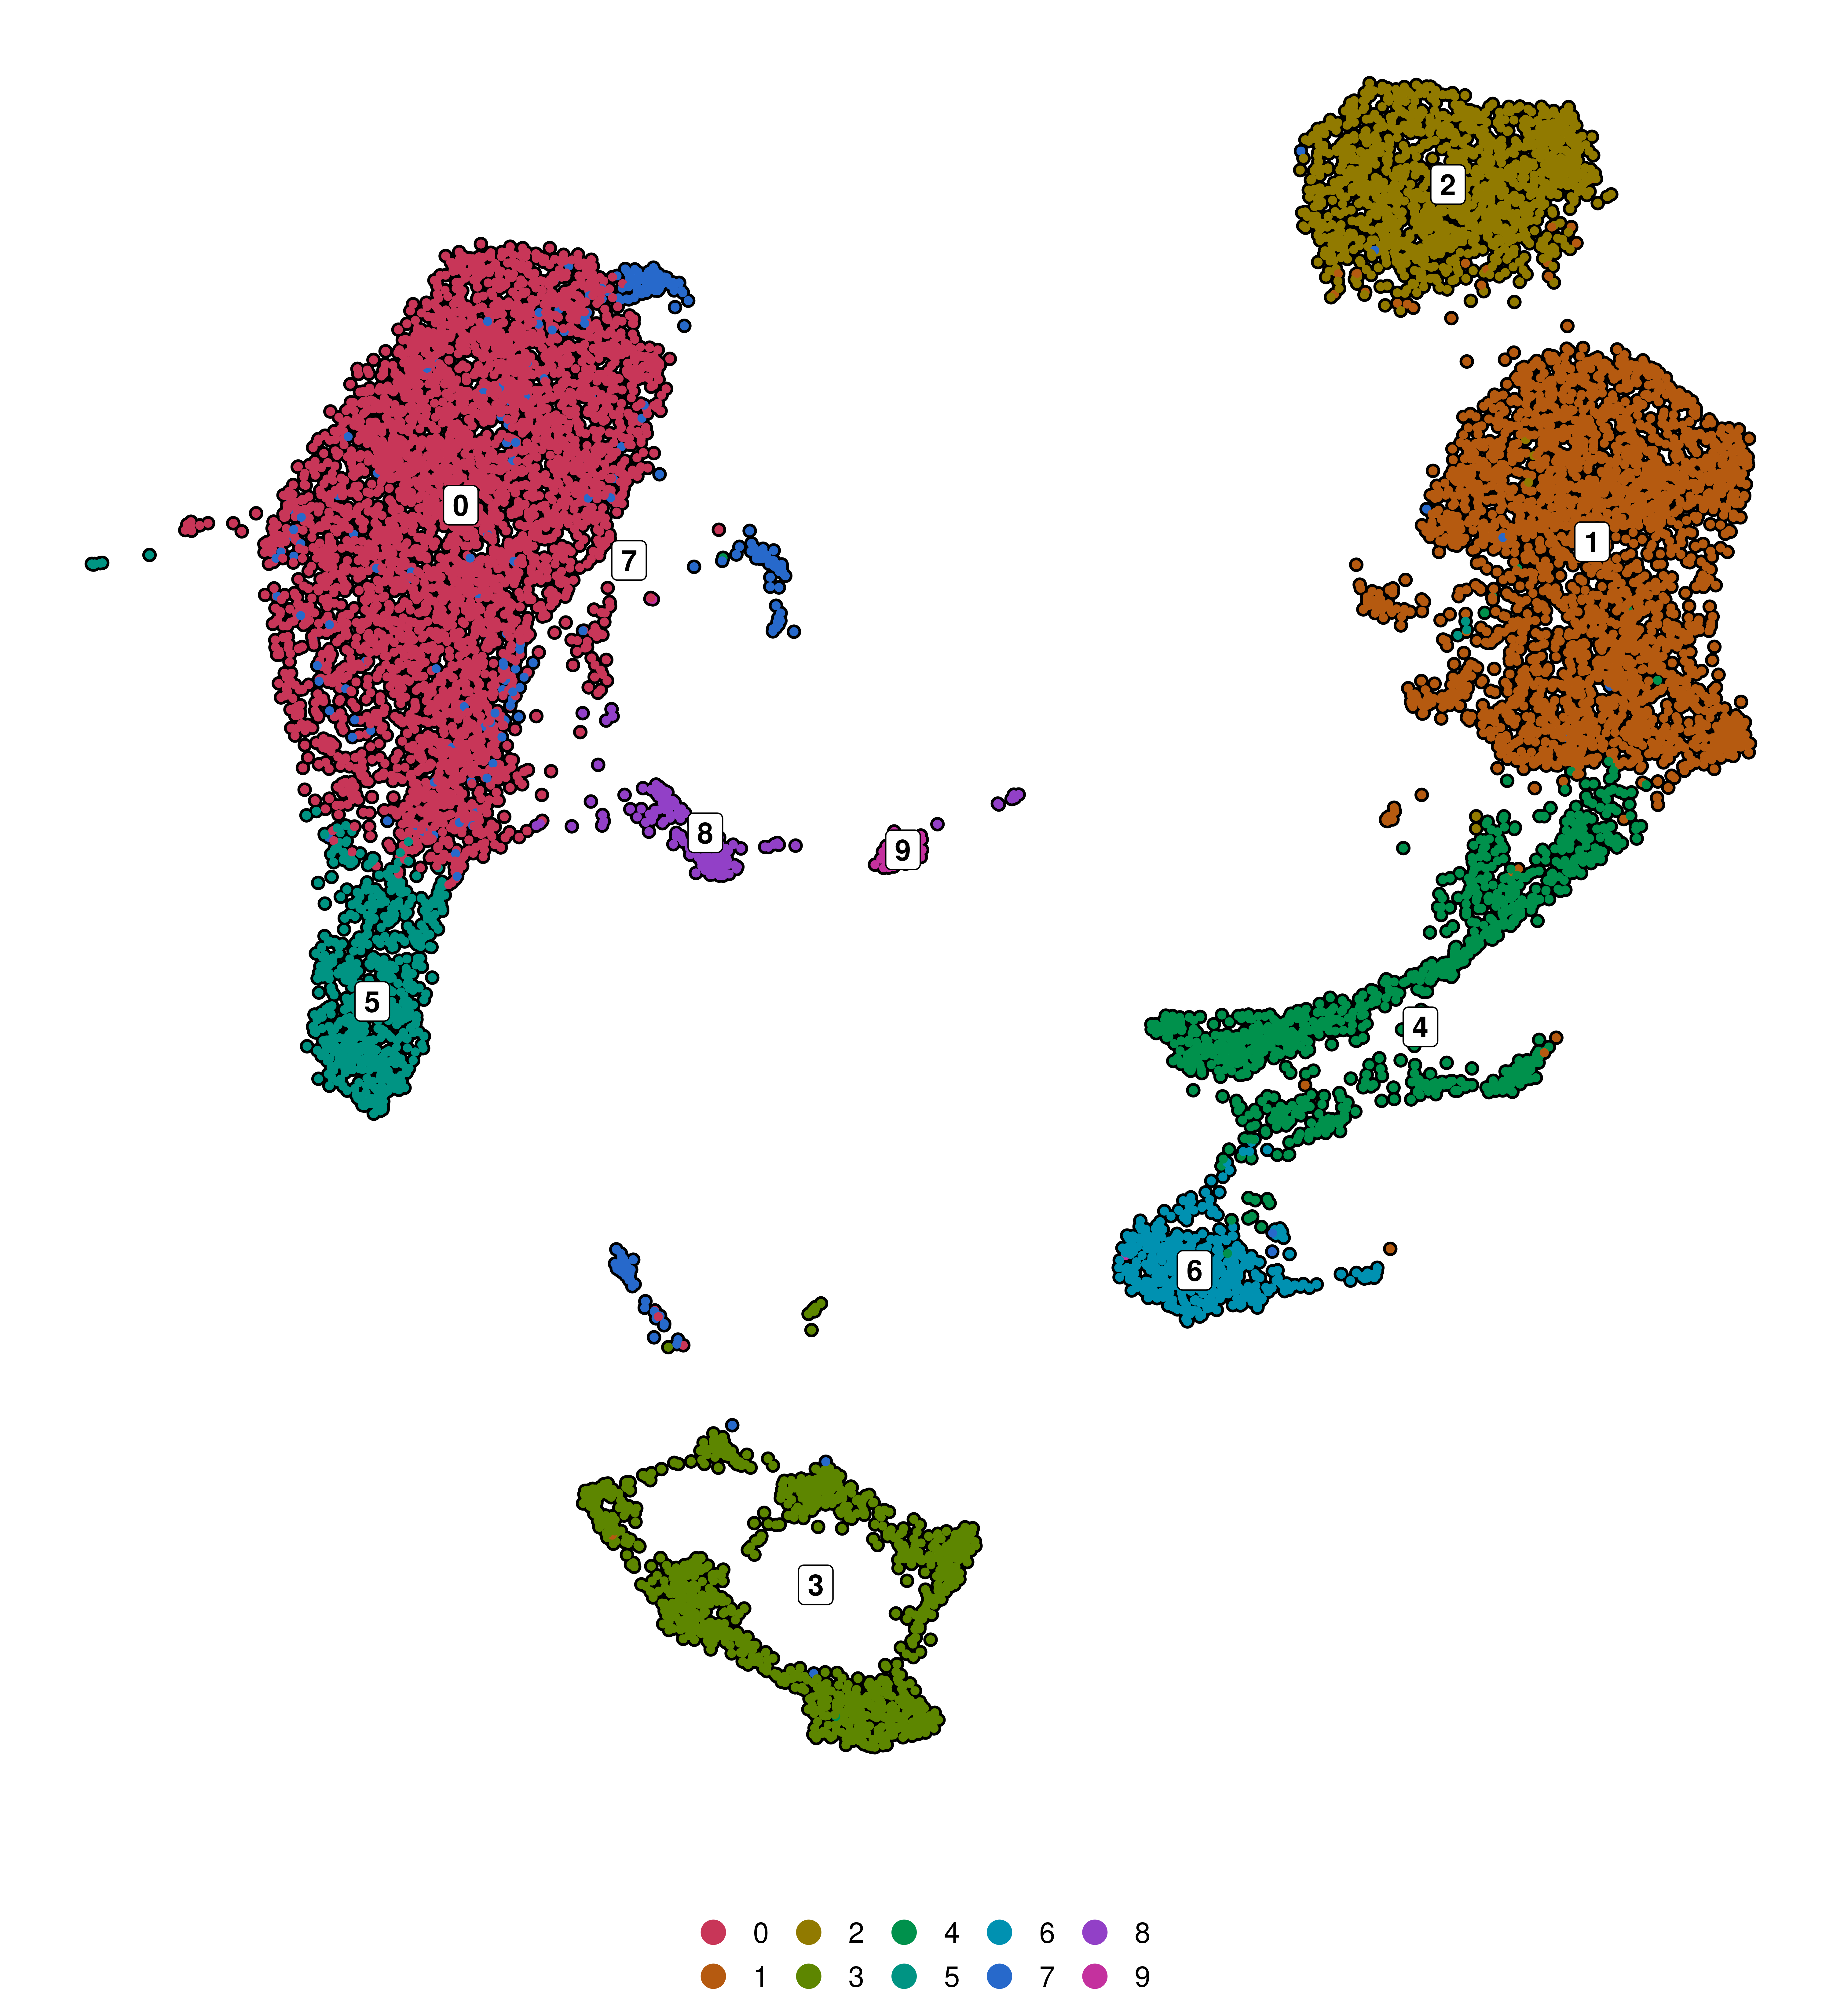
# Label the clusters - text geom.
SCpubr::do_DimPlot(sample = sample,
                   label = TRUE,
                   label.box = FALSE)
# Label the clusters - label geom.
SCpubr::do_DimPlot(sample = sample,
                   label = TRUE,
                   repel = TRUE)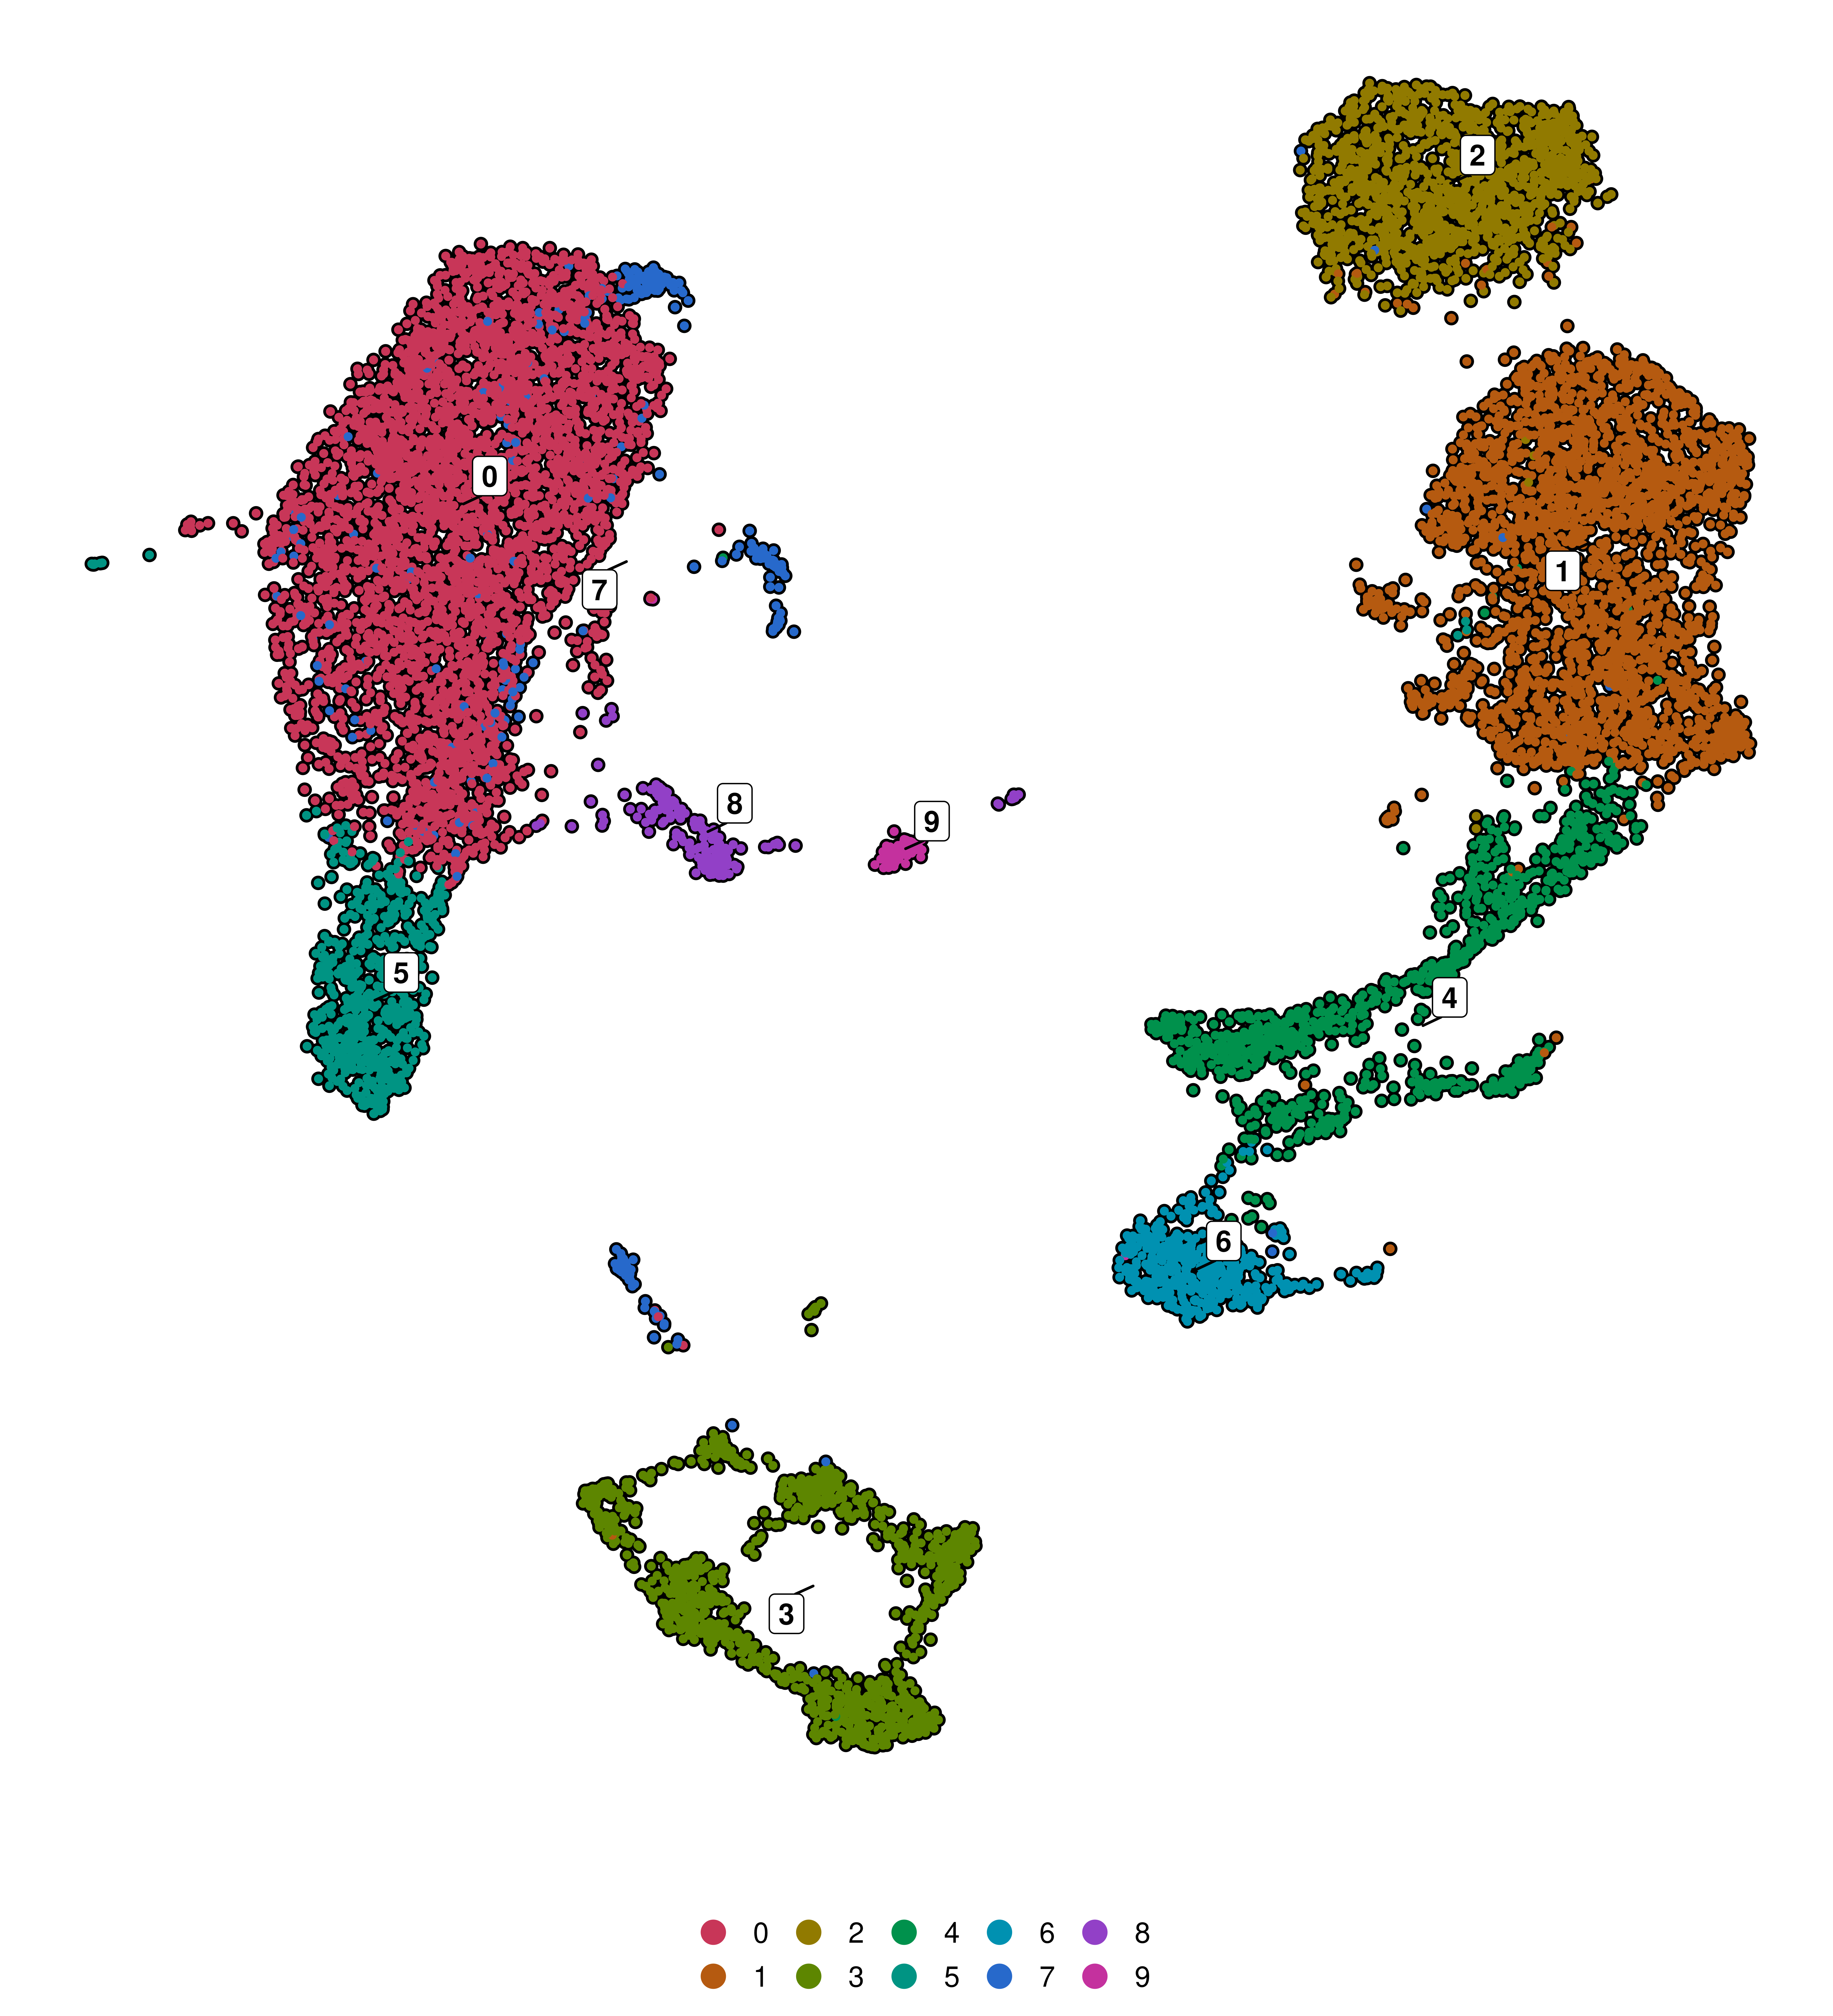
# Label the clusters - text geom.
SCpubr::do_DimPlot(sample = sample,
                   label = TRUE,
                   label.box = FALSE,
                   repel = TRUE)
# Label the clusters - modify the color of the text and label border..
SCpubr::do_DimPlot(sample = sample,
                   label = TRUE,
                   repel = TRUE,
                   label.color = "blue")
# Label the clusters - modify the fill of the labels.
SCpubr::do_DimPlot(sample = sample,
                   label = TRUE,
                   repel = TRUE,
                   label.color = "yellow",
                   label.fill = "black")
# Define a set of colors.
colors <- c("0" = "#001219",
            "1" = "#005f73",
            "2" = "#0a9396",
            "3" = "#94d2bd",
            "4" = "#e9d8a6",
            "5" = "#ee9b00",
            "6" = "#ca6702",
            "7" = "#bb3e03",
            "8" = "#ae2012",
            "9" = "#9b2226")

# Label the clusters - text geom.
SCpubr::do_DimPlot(sample = sample,
                   colors.use = colors)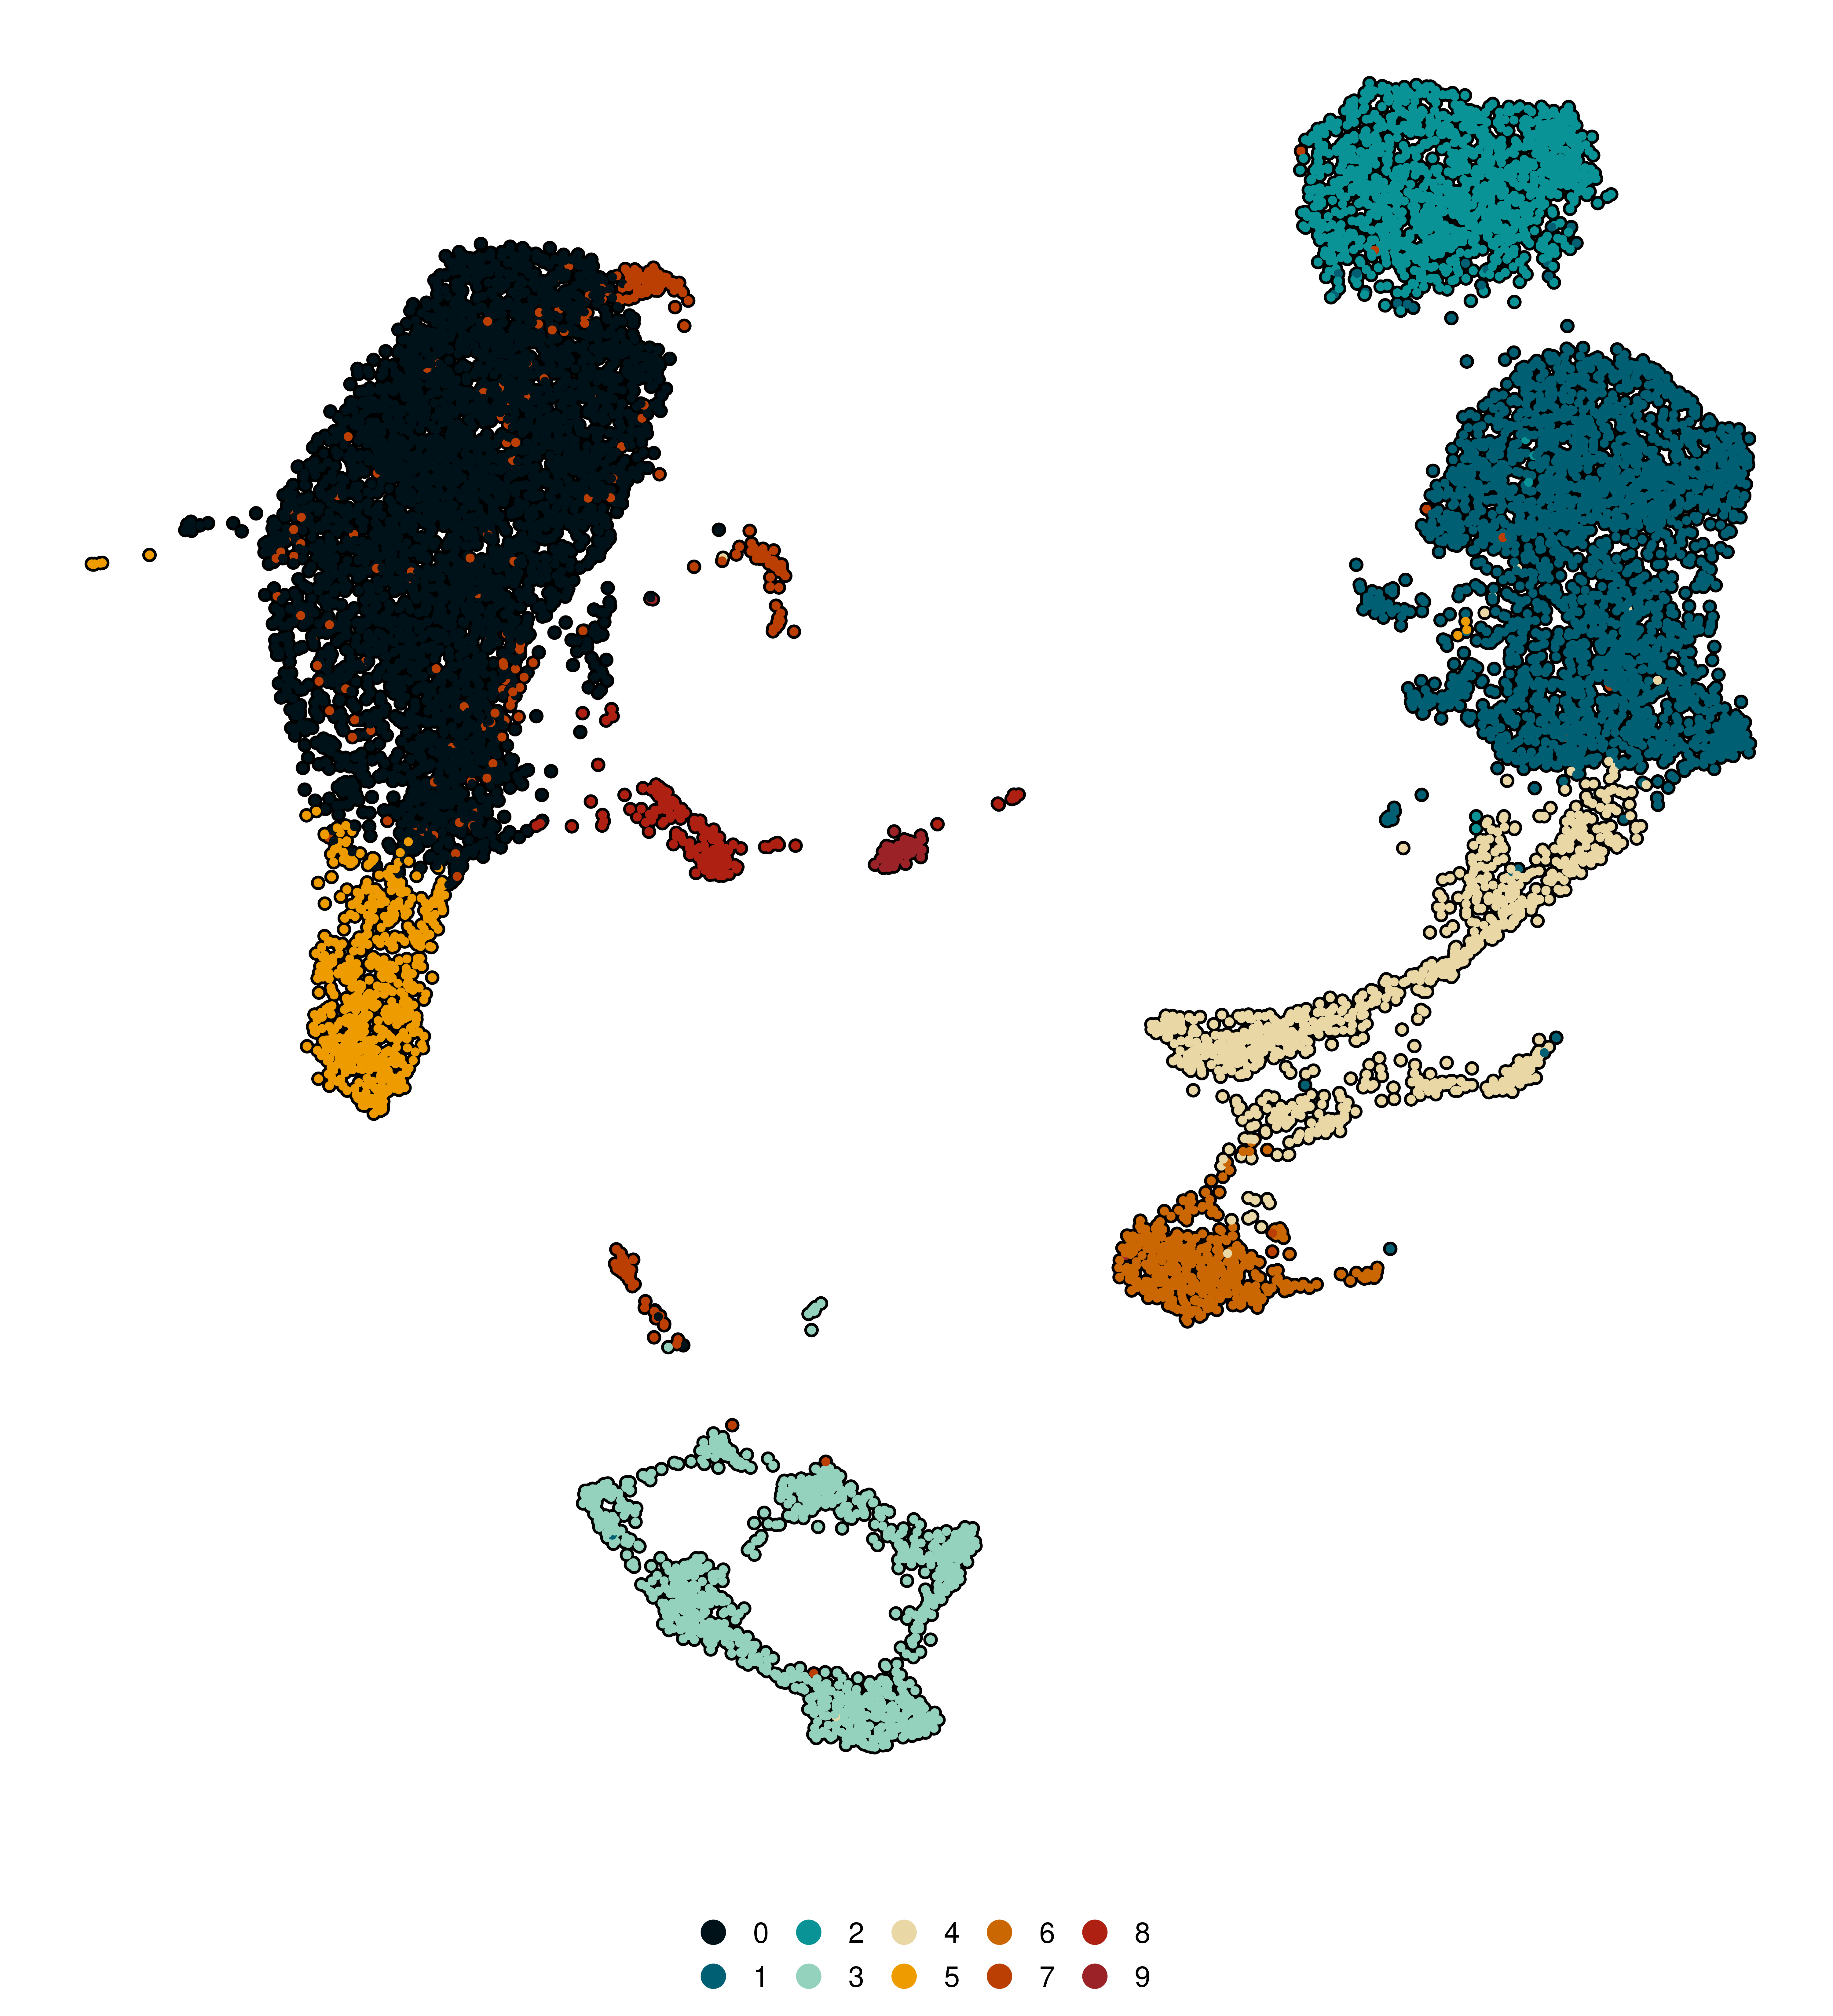
There are many synergies across functions. Have a look at the section Shared features across functions!