SCpubr::do_FeaturePlot(sample = sample,
                       features = "nCount_RNA")
SCpubr::do_FeaturePlot(sample = sample,
features = "nCount_RNA")
SCpubr::do_FeaturePlot(sample = sample,
                       features = c("nCount_RNA", "nFeature_RNA"))
SCpubr::do_FeaturePlot(sample = sample,
                       features = "nCount_RNA",
                       min.cutoff = 5000,
                       max.cutoff = 30000)
# Use a vector of cells
p1 <- SCpubr::do_FeaturePlot(sample = sample,
                             features = c("PC_1"),
                             cells.highlight = sample(colnames(sample), 500))

# Select identities.
p2 <- SCpubr::do_FeaturePlot(sample = sample,
                             features = c("PC_1"),
                             idents.highlight = c("0", "2", "5"))
p1 | p2
# Use a vector of cells
SCpubr::do_FeaturePlot(sample = sample,
                       features = c("PC_1"),
                       split.by = "seurat_clusters",
                       ncol = 5)
# Use a vector of cells
SCpubr::do_FeaturePlot(sample = sample,
                       features = c("PC_1"),
                       split.by = "seurat_clusters",
                       idents.keep = c("0", "5", "7"),
                       ncol = 3)
SCpubr::do_FeaturePlot(sample = sample,
                       features = "PC_1",
                       group.by = "seurat_clusters")
SCpubr::do_FeaturePlot(sample = sample,
                            features = "PC_1",
                            group.by = "seurat_clusters",
                            group.by.dot.size = 12)
SCpubr::do_FeaturePlot(sample = sample,
                            features = "PC_1",
                            group.by = "seurat_clusters",
                            group.by.cell_borders = TRUE,
                            group.by.cell_borders.alpha = 0.1)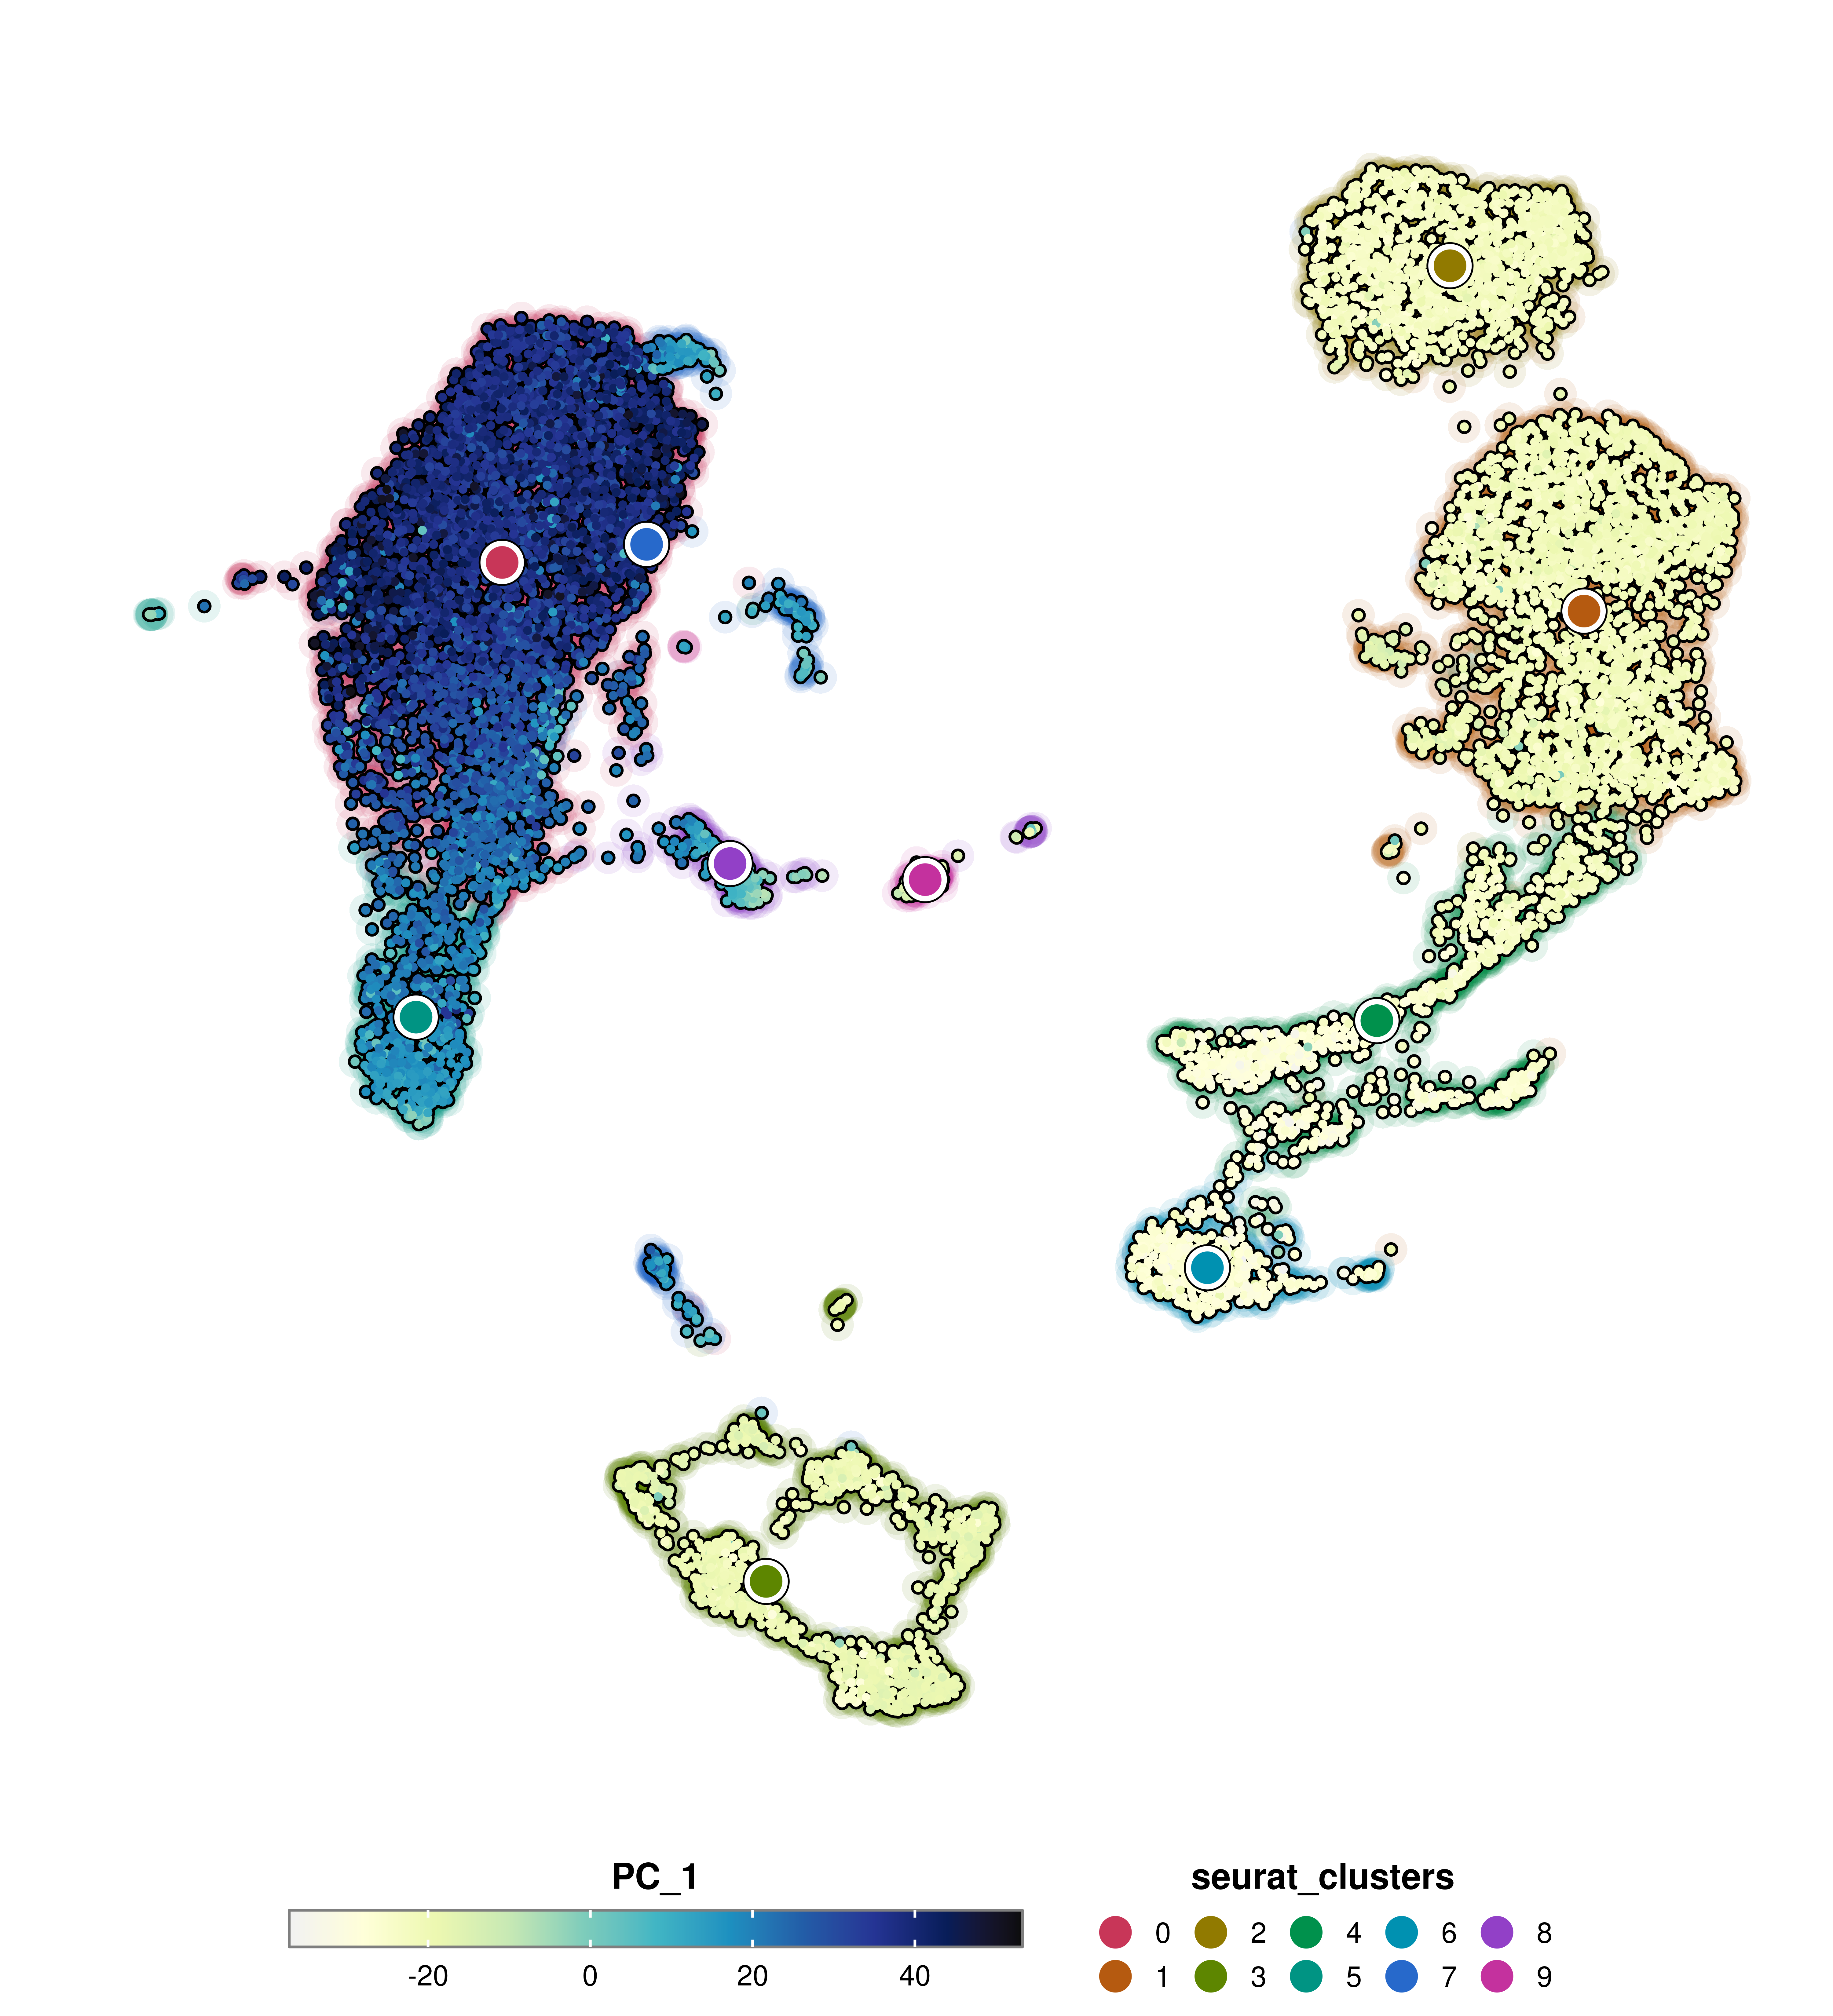
SCpubr::do_FeaturePlot(sample = sample,
                            features = "PC_1",
                            group.by = "seurat_clusters",
                            group.by.cell_borders = TRUE,
                            group.by.cell_borders.alpha = 0.1,
                            group.by.show.dots = FALSE)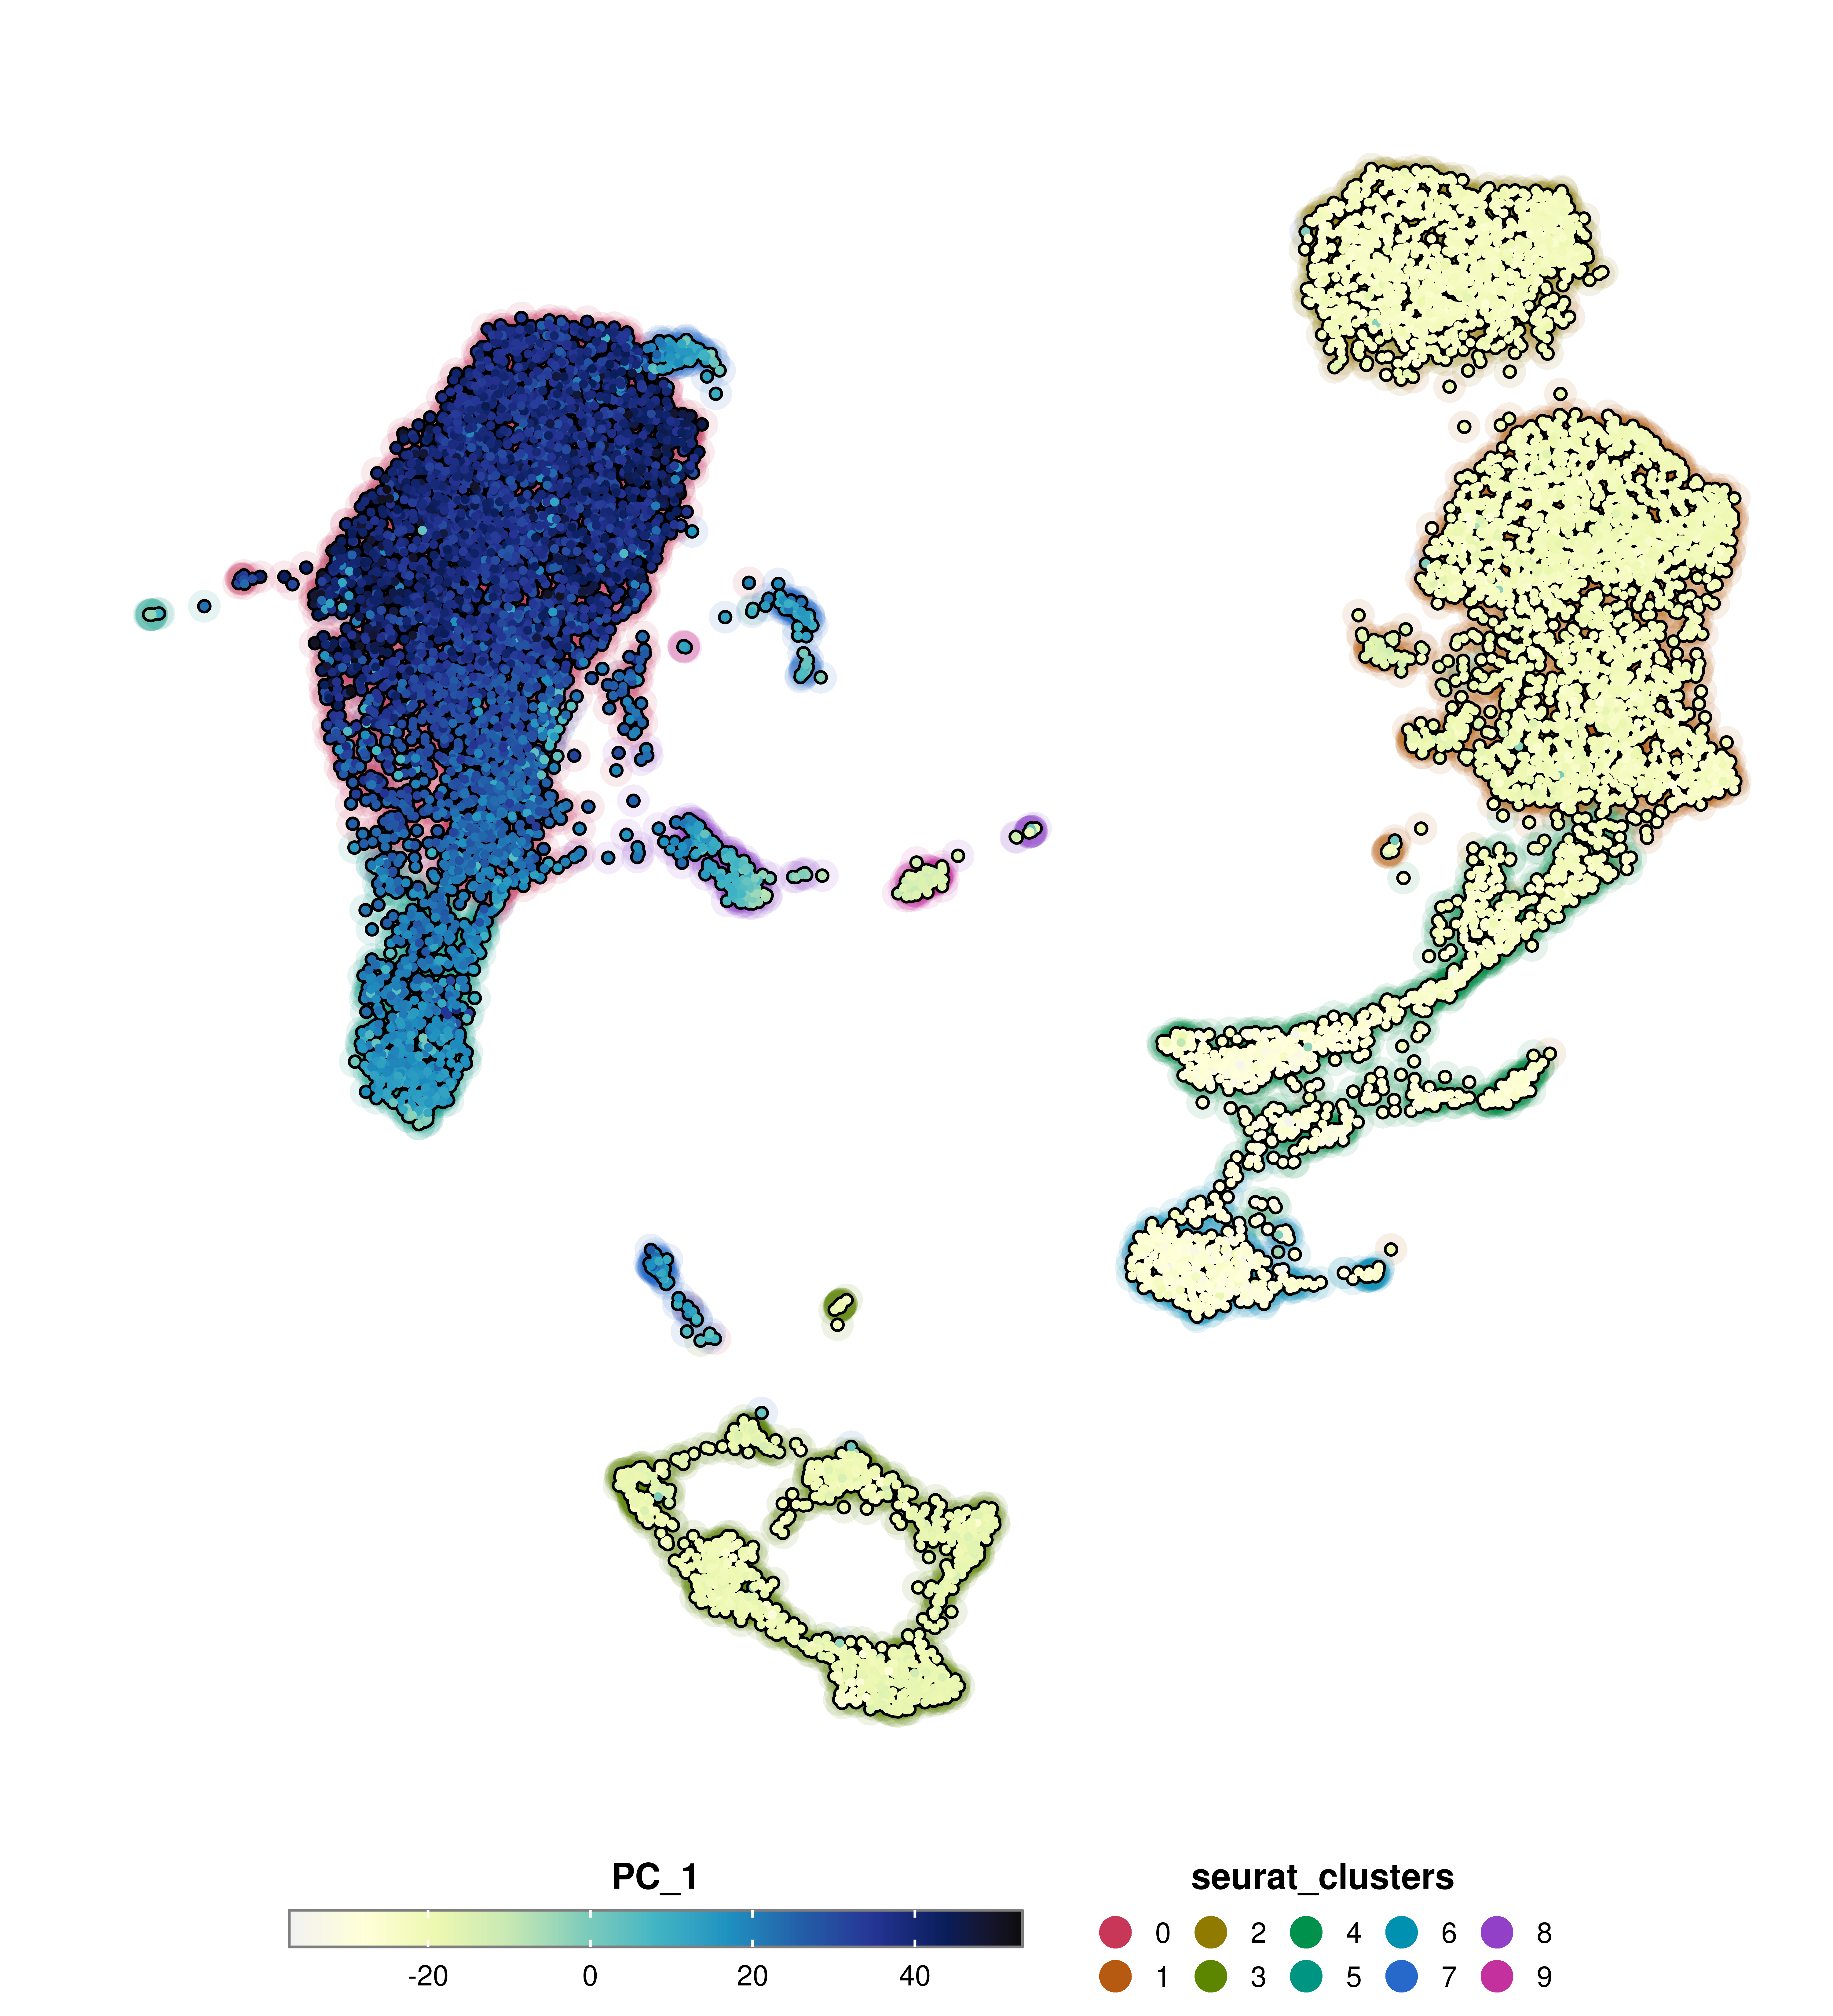
SCpubr::do_FeaturePlot(sample = sample,
                            features = "PC_1",
                            group.by = "seurat_clusters",
                            group.by.cell_borders = TRUE,
                            group.by.cell_borders.alpha = 0.1,
                            group.by.show.dots = TRUE,
                            group.by.legend = "My Clusters",
                            group.by.colors.use = c("0" = "#001219",
                                                    "1" = "#005f73",
                                                    "2" = "#0a9396",
                                                    "3" = "#94d2bd",
                                                    "4" = "#e9d8a6",
                                                    "5" = "#ee9b00",
                                                    "6" = "#ca6702",
                                                    "7" = "#bb3e03",
                                                    "8" = "#ae2012",
                                                    "9" = "#9b2226"))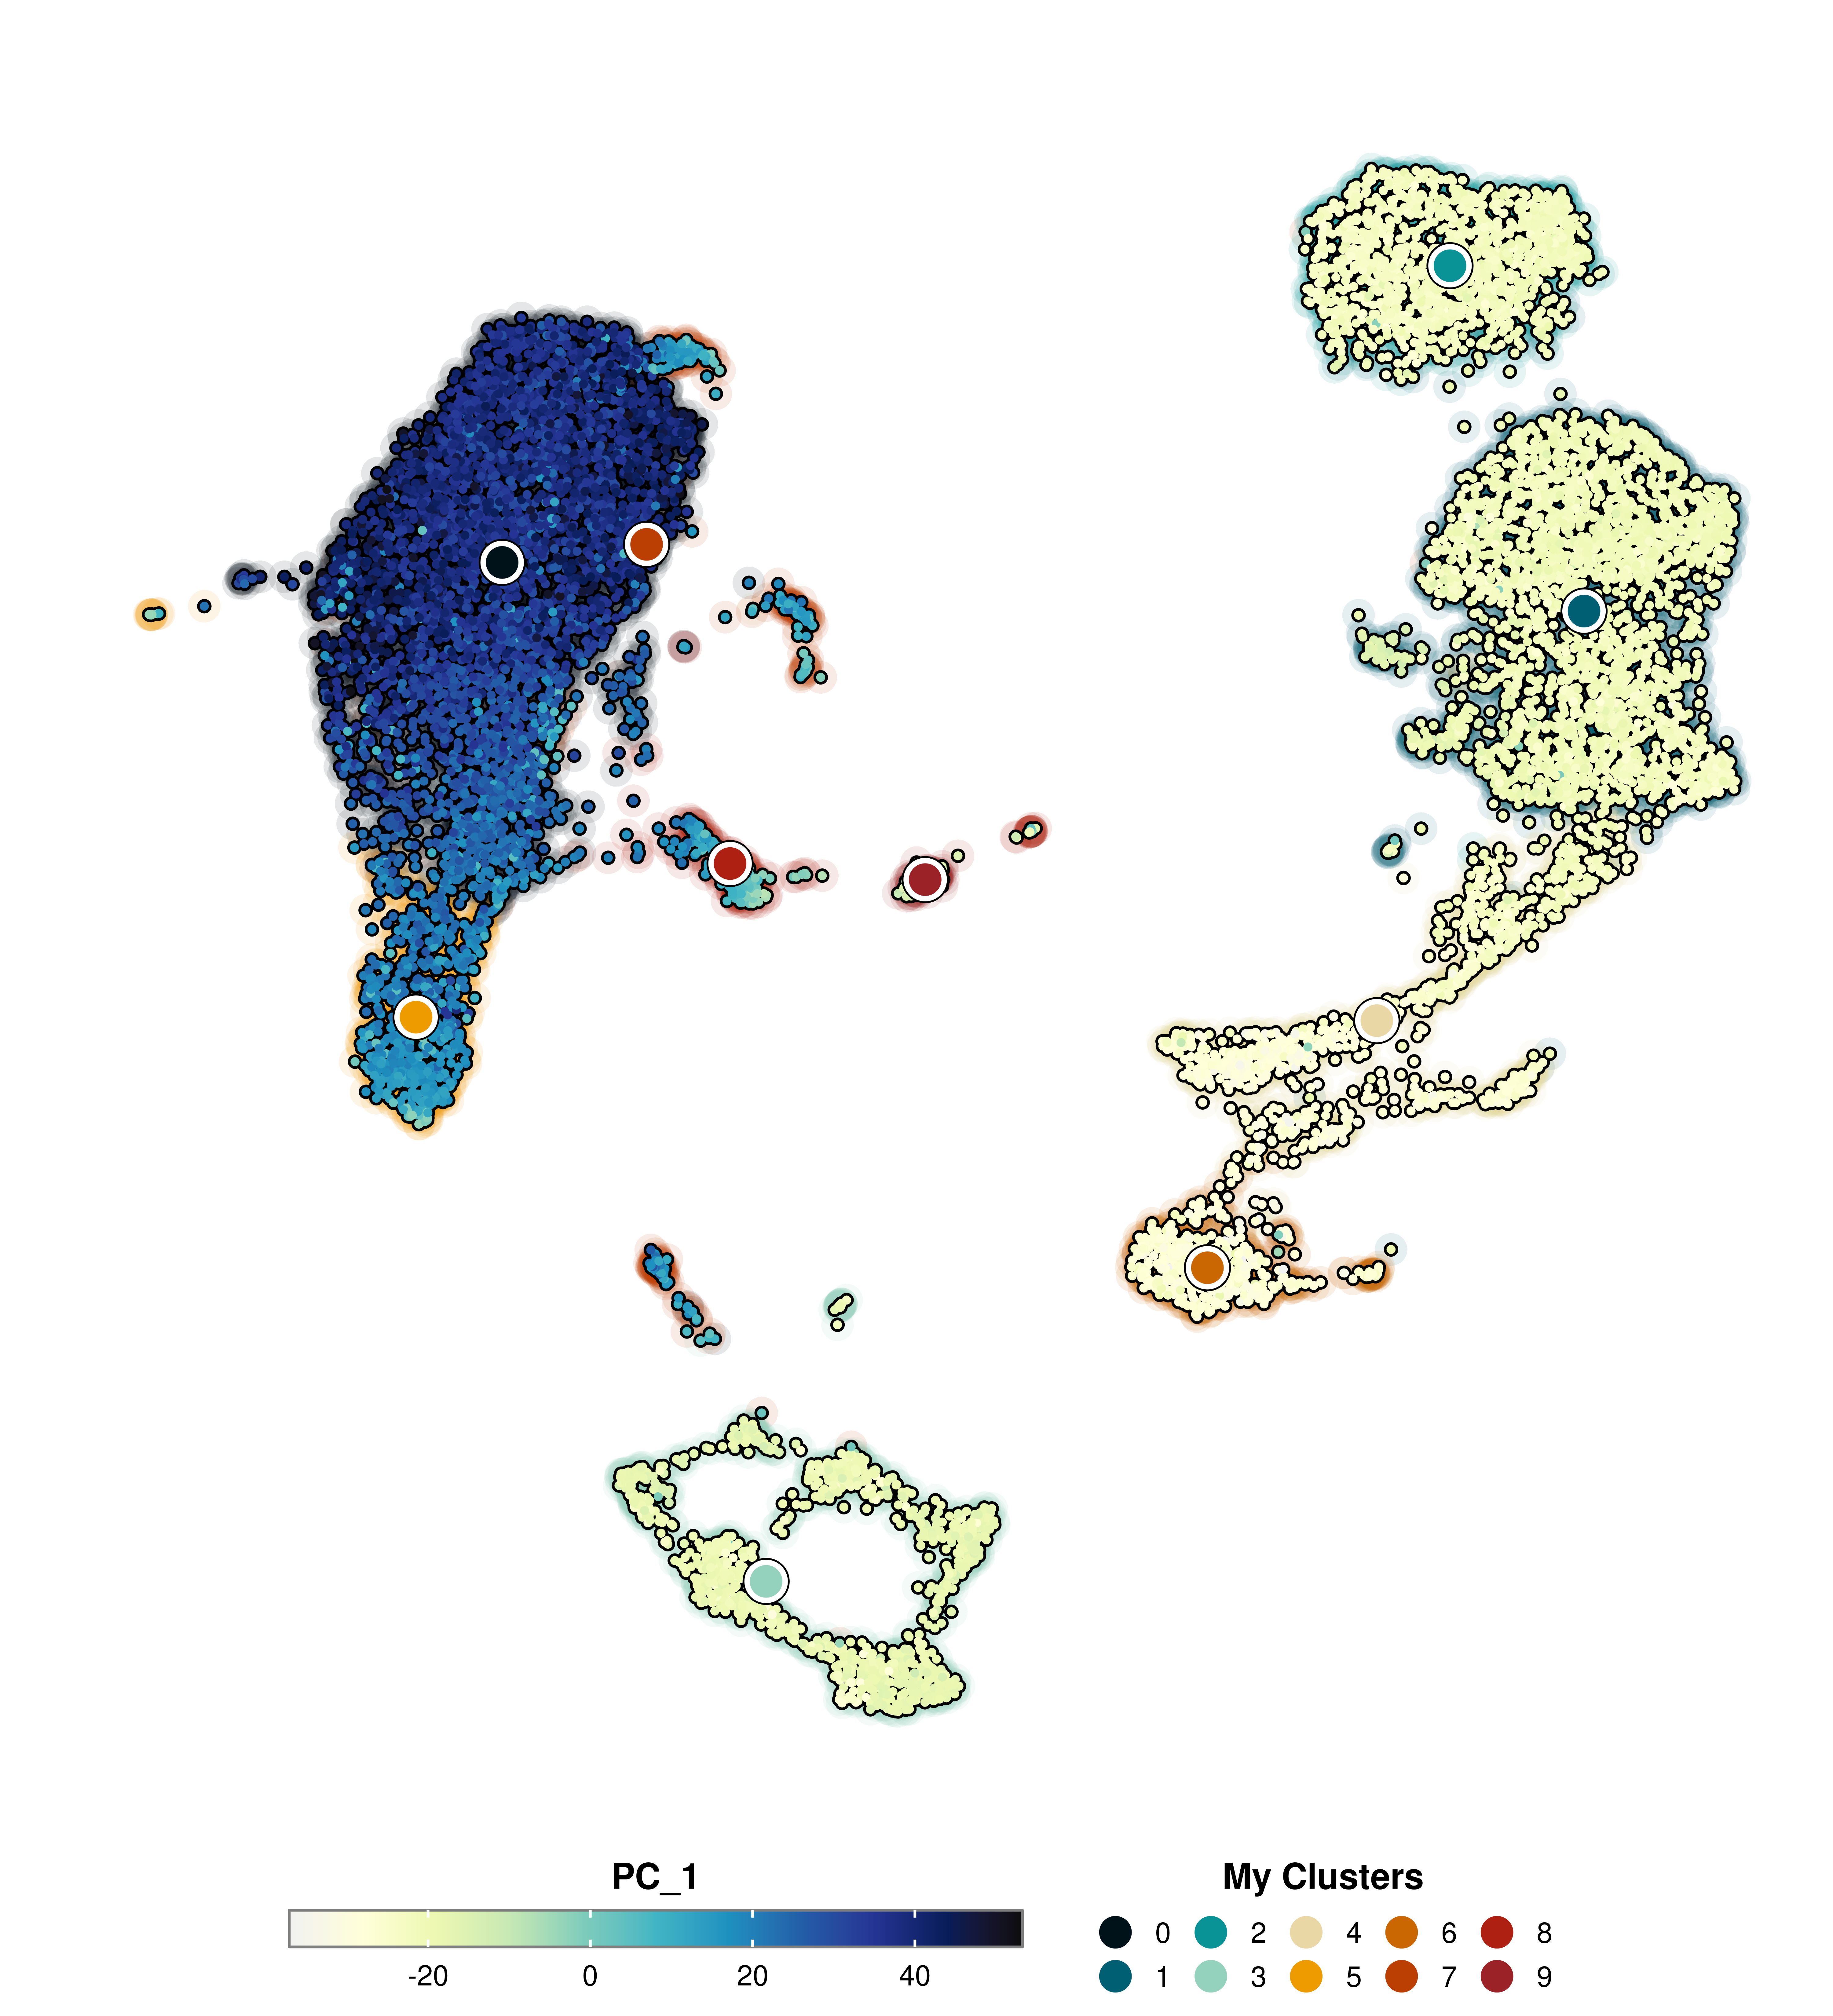
SCpubr::do_FeaturePlot(sample = sample,
                            features = "PC_1",
                            label = TRUE,
                            label.color = "#ca6702",
                            label.size = 8)